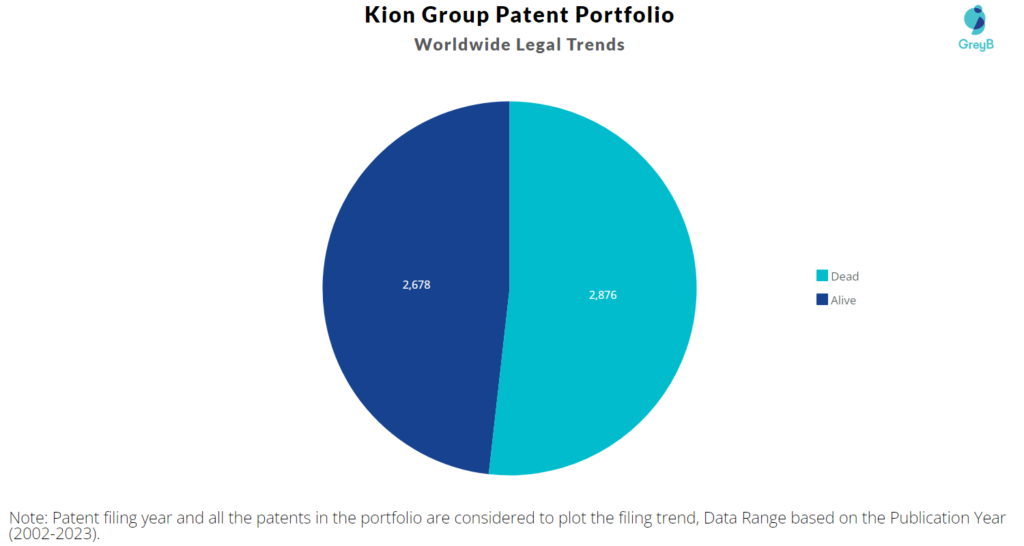
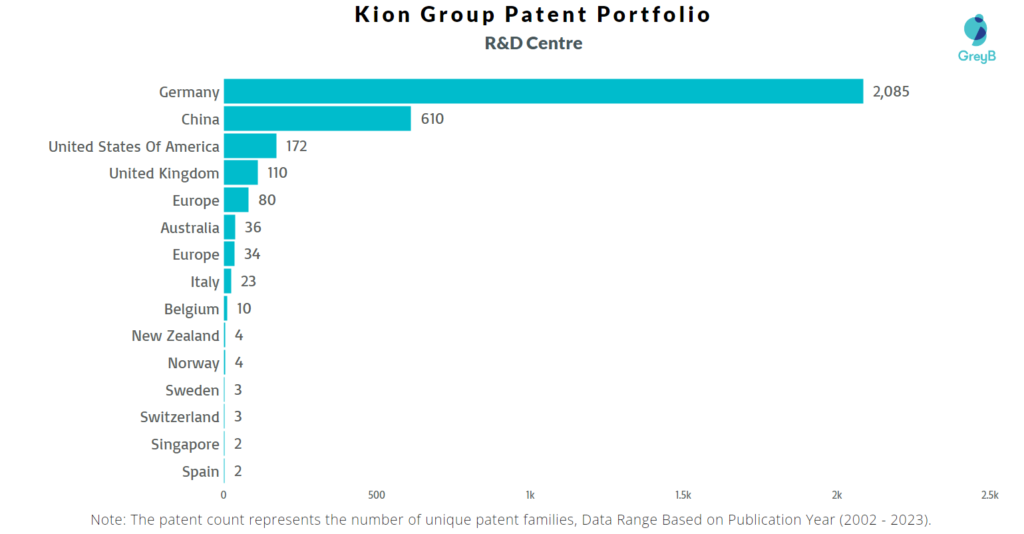
Kion Group has a total of 5554 patents globally, out of which 2926 have been granted. Of these 5554 patents, more than 48% patents are active. Germany is where Kion Group has filed the maximum number of patents, followed by Europe and China. Parallelly, Germany seems to be the main focused R&D centre and also is the origin country of Kion Group.
Kion Group was founded in the year 2006. The Company provides material handling solutions. The Company offers forklifts, warehouse equipments and other industrial trucks. As of March 2023, the market cap of Kion Group is $5.39 Billion.
Do read about some of the most popular patents of Kion Group which have been covered by us in this article and also you can find Kion Group patents information, the worldwide patent filing activity and its patent filing trend over the years, and many other stats over Kion Group patent portfolio.
How many patents does the CEO of Kion Group have?
The CEO Richard Robinson Smith has 0 patent.
How many patents does Kion Group have?
Kion Group has a total of 5554 patents globally. These patents belong to 3193 unique patent families. Out of 5554 patents, 2678 patents are active.
How Many Patents did Kion Group File Every Year?
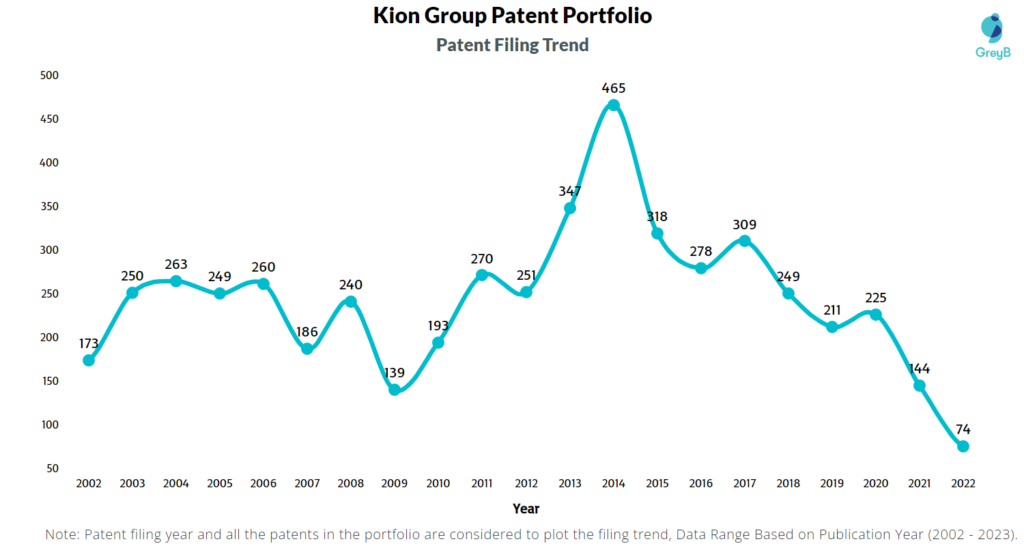
Are you wondering why there is a drop in patent filing for the last two years? It is because a patent application can take up to 18 months to get published. Certainly, it doesn’t suggest a decrease in the patent filing.
| Year of Patents Filing or Grant | Kion Group Applications Filed | Kion Group Patents Granted |
| 2023 | – | 19 |
| 2022 | 74 | 170 |
| 2021 | 144 | 163 |
| 2020 | 225 | 125 |
| 2019 | 211 | 174 |
| 2018 | 249 | 210 |
| 2017 | 309 | 188 |
| 2016 | 278 | 193 |
| 2015 | 318 | 172 |
| 2014 | 465 | 187 |
| 2013 | 347 | 120 |
| 2012 | 251 | 96 |
How many Kion Group patents are Alive/Dead?
How Many Patents did Kion Group File in Different Countries?
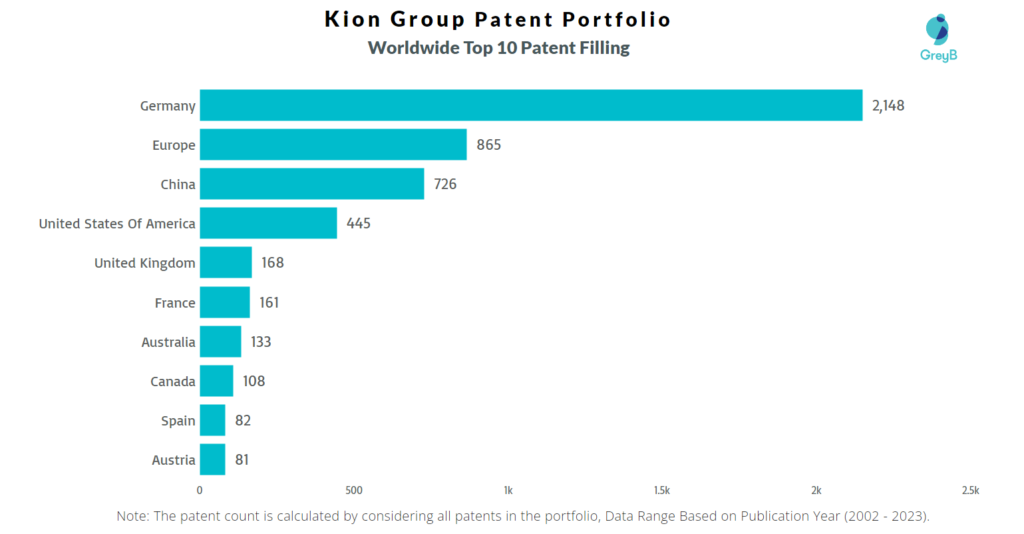
Countries in which Kion Group Filed Patents
| Country | Patents |
| Germany | 2148 |
| Europe | 865 |
| China | 726 |
| United States Of America | 445 |
| United Kingdom | 168 |
| France | 161 |
| Australia | 133 |
| Canada | 108 |
| Spain | 82 |
| Austria | 81 |
| Japan | 74 |
| Italy | 49 |
| Denmark | 35 |
| Hong Kong (S.A.R.) | 34 |
| Korea (South) | 33 |
| Mexico | 32 |
| Sweden | 30 |
| Singapore | 30 |
| New Zealand | 29 |
| Poland | 27 |
| Brazil | 19 |
| Portugal | 9 |
| Belgium | 8 |
| Norway | 8 |
| Slovenia | 6 |
| Hungary | 5 |
| India | 5 |
| Croatia | 4 |
| Switzerland | 3 |
| Russia | 3 |
| Malaysia | 3 |
| Turkey | 1 |
| Lithuania | 1 |
| Serbia | 1 |
| Indonesia | 1 |
Where are Research Centres of Kion Group Patents Located?
10 Best Kion Group Patents
US6721638B2 is the most popular patent in the Kion Group portfolio. It has received 129 citations so far from companies like General Motors, Skyfence and Symbotic.
Below is the list of 10 most cited patents of Kion Group:
| Publication Number | Citation Count |
| US6721638B2 | 129 |
| US6345217B1 | 121 |
| US7629996B2 | 118 |
| US6629593B2 | 92 |
| US20110008137A1 | 88 |
| US6478138B1 | 87 |
| US20050243739A1 | 83 |
| US6799099B2 | 77 |
| US6513641B1 | 76 |
| US8790061B2 | 69 |
How many inventions of other companies were rejected due to Kion Group patents?
The statistics below share strategic R&D insights. It tells the companies that were trying to protect inventions similar to Kion Group invention. They couldn’t because Kion Group had protected those before them.
Examiners at the USPTO referred 150 Kion Group patents in 546 rejections (35 USC § 102 or 35 USC § 103 types).
The top citing companies in the Kion Group patent portfolio are Dematic, Intelligrated Headquarters and Laitram Llc.
List of the Companies whose Patents were rejected citing Kion Group –
| Company | Number of Patent Applications that faced Rejection Citing Kion Group Patents | Number of Rejections (102 & 103) |
| Dematic | 24 | 51 |
| Intelligrated Headquarters | 14 | 24 |
| Laitram Llc | 7 | 11 |
| Interroll Holding | 7 | 12 |
| Siemens | 6 | 17 |
| Individual | 5 | 6 |
| Symbotic Llc | 5 | 9 |
| Jungheinrich Aktiengesellschaft | 5 | 9 |
| Raymond | 4 | 7 |
| Insight Automation | 4 | 4 |
Count of 102 and 103 Type Rejections based on Kion Group Patents
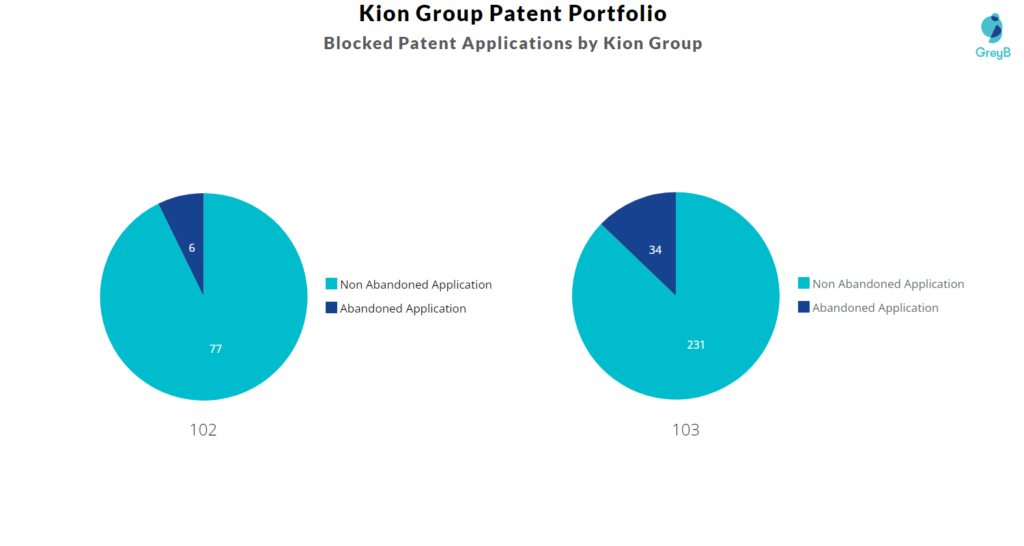
Top Kion Group Patents used in Rejecting Most Patent Applications
| Patent Number | Count of Rejected Applications |
| US9550624B2 | 15 |
| US7035714B2 | 10 |
| US8468781B2 | 9 |
| US20050243739A1 | 7 |
| US20110008137A1 | 6 |
| US6799099B2 | 6 |
| US7909155B2 | 5 |
| US7040478B2 | 5 |
| US20070261941A1 | 5 |
| US6644459B2 | 5 |
| US7631747B2 | 5 |
| US6832139B2 | 5 |
| US6505733B2 | 5 |
| US6609607B2 | 5 |
| US7021456B2 | 5 |
What Percentage of Kion Group US Patent Applications were Granted?
Kion Group (Excluding its subsidiaries) has filed 54 patent applications at USPTO so far (Excluding Design and PCT applications). Out of these 52 have been granted leading to a grant rate of 100.0%.
Below are the key stats of Kion Group patent prosecution at the USPTO.

Which Law Firms Filed Most US Patents for Kion Group?
| Law Firm | Total Applications | Success Rate |
| Mark G Mortenson | 25 | 100.00% |
| Clariant Corporation | 10 | 100.00% |
| Howard M Ellis | 4 | 100.00% |
| Kevin J Boland | 3 | 100.00% |
| Carol A Lewis | 2 | 100.00% |
| Greenblum & Bernstein | 2 | 100.00% |
| Morrison & Foerster | 2 | 100.00% |
| Carol Lewis | 1 | 100.00% |
| Emd Performance Materials | 1 | 100.00% |
| Joanne W Patterson | 1 | 100.00% |
| Lanxide Corporation Mark G Mortenson | 1 | 100.00% |
| Lanxide Technology Company | 1 | 100.00% |
| Mark G Morttenson | 1 | 100.00% |
