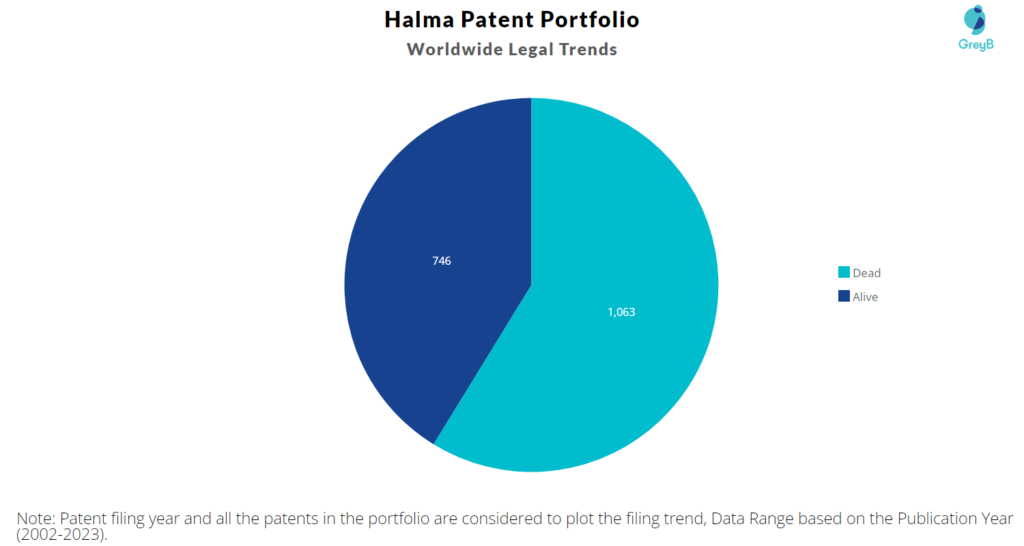
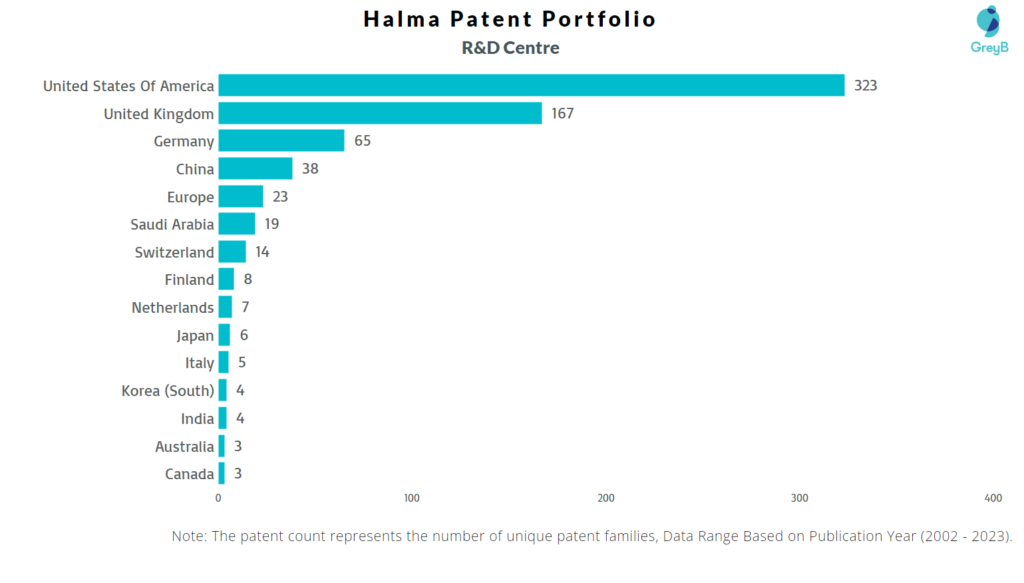
Halma has a total of 1809 patents globally, out of which 985 have been granted. Of these 1809 patents, more than 41% patents are active. United States of America is where Halma has filed the maximum number of patents, followed by United Kingdom and Europe. Parallelly, United States of America seems to be the main focused R&D centre and United Kingdom is the origin country of Halma.
Halma was founded in the year 1894. The Company is a health and safety sensor technology group which manufactures products that detect hazards and also protect assets and people at work in public and commercial buildings. Company develops technologies and products that are used for analysis in safety, environmental and leisure related markets, including water, to improve personal and public health. As of April 2023, the market cap of Halma is $1.04 Billion.
Do read about some of the most popular patents of Halma which have been covered by us in this article and also you can find Halma patents information, the worldwide patent filing activity and its patent filing trend over the years, and many other stats over Halma patent portfolio.
How many patents does the founder and the CEO of Halma have?
The founder David Barber has 10 patents and CEO Andrew Williams has 36 patents.
How many patents does Halma have?
Halma has a total of 1809 patents globally. These patents belong to 705 unique patent families. Out of 1809 patents, 746 patents are active.
How Many Patents did Halma File Every Year?
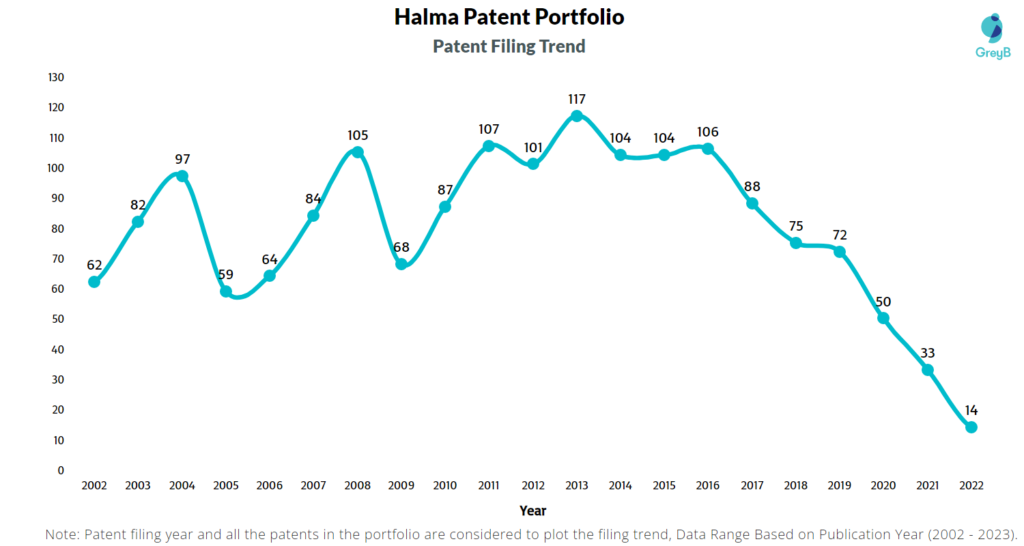
Are you wondering why there is a drop in patent filing for the last two years? It is because a patent application can take up to 18 months to get published. Certainly, it doesn’t suggest a decrease in the patent filing.
| Year of Patents Filing or Grant | Halma Applications Filed | Halma Patents Granted |
| 2023 | – | 9 |
| 2022 | 14 | 31 |
| 2021 | 33 | 52 |
| 2020 | 50 | 51 |
| 2019 | 72 | 50 |
| 2018 | 75 | 54 |
| 2017 | 88 | 71 |
| 2016 | 106 | 75 |
| 2015 | 104 | 62 |
| 2014 | 104 | 86 |
| 2013 | 117 | 64 |
| 2012 | 101 | 66 |
How many Halma patents are Alive/Dead?
How Many Patents did Halma File in Different Countries?
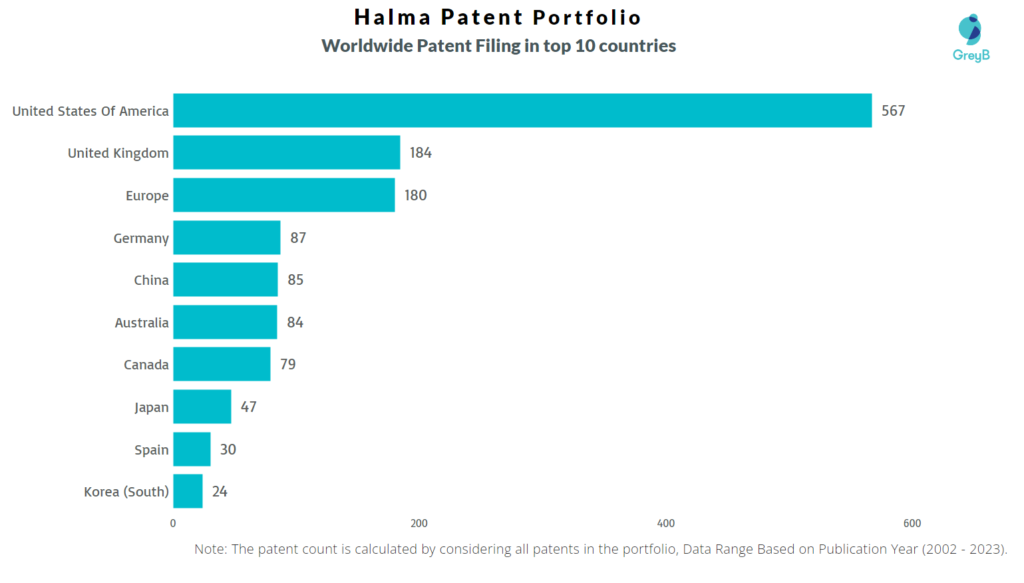
Countries in which Halma Filed Patents
| Country | Patents |
| United States Of America | 567 |
| United Kingdom | 184 |
| Europe | 180 |
| Germany | 87 |
| China | 85 |
| Australia | 84 |
| Canada | 79 |
| Japan | 47 |
| Spain | 30 |
| Korea (South) | 24 |
| India | 24 |
| Hong Kong (S.A.R.) | 24 |
| Austria | 23 |
| Saudi Arabia | 20 |
| Singapore | 15 |
| Taiwan | 15 |
| Finland | 13 |
| Brazil | 12 |
| Indonesia | 9 |
| Switzerland | 9 |
| Norway | 8 |
| Mexico | 8 |
| Italy | 7 |
| Chile | 6 |
| Netherlands | 6 |
| Denmark | 6 |
| Argentina | 4 |
| Portugal | 3 |
| Russia | 2 |
| Malta | 2 |
| Hungary | 2 |
| Israel | 2 |
| Eurasia | 1 |
| Peru | 1 |
| Cyprus | 1 |
| Gulf Cooperation Council | 1 |
| Poland | 1 |
| New Zealand | 1 |
| South Africa | 1 |
| Slovenia | 1 |
| Thailand | 1 |
Where are Research Centres of Halma Patents Located?
10 Best Halma Patents
US8992042B2 is the most popular patent in the Halma portfolio. It has received 669 citations so far from companies like Ethicon, Mitsubishi and Lumencor.
Below is the list of 10 most cited patents of Halma:
| Publication Number | Citation Count |
| US8992042B2 | 669 |
| US8457656B2 | 257 |
| US7324824B2 | 239 |
| US7312752B2 | 211 |
| US20050096695A1 | 209 |
| US7785368B2 | 173 |
| US6419621B1 | 144 |
| US8139945B1 | 124 |
| US7670374B2 | 122 |
| US8057544B2 | 118 |
How many inventions of other companies were rejected due to Halma patents?
The statistics below share strategic R&D insights. It tells the companies that were trying to protect inventions similar to Halma invention. They couldn’t because Halma had protected those before them.
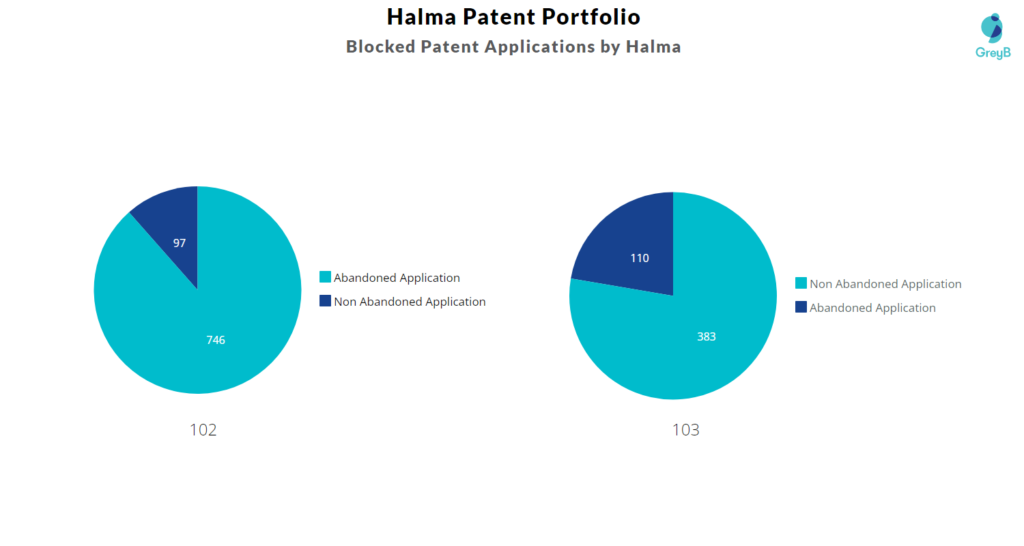
Examiners at the USPTO referred 223 Halma patents in 1058 rejections (35 USC § 102 or 35 USC § 103 types).
The top citing companies in the Halma patent portfolio are Qualcomm, General Electric and IBM.
List of the Companies whose Patents were rejected citing Halma –
| Company | Number of Patent Applications that faced Rejection Citing Halma Patents | Number of Rejections (102 & 103) |
| Qualcomm | 13 | 21 |
| General Electric | 9 | 23 |
| IBM | 9 | 16 |
| Covidien | 9 | 13 |
| Depuy Synthes Products | 8 | 17 |
| 7 | 14 | |
| Clinical Patents | 5 | 9 |
| Wells Fargo Bank | 5 | 8 |
| Intel | 4 | 9 |
| Oklahoma Safety Equipment | 4 | 6 |
Count of 102 and 103 Type Rejections based on Halma Patents
Top Halma Patents used in Rejecting Most Patent Applications
| Patent Number | Count of Rejected Applications |
| US7312752B2 | 41 |
| US7324824B2 | 21 |
| US7671741B2 | 12 |
| US8057544B2 | 12 |
| US20050096695A1 | 10 |
| US20100090901A1 | 9 |
| US7463907B2 | 9 |
| US20050120030A1 | 7 |
| US20080221469A1 | 7 |
| US20120127317A1 | 7 |
| US6907284B2 | 6 |
| US6700690B1 | 6 |
| US6916308B2 | 6 |
| US8139945B1 | 6 |
| US8031120B2 | 6 |
