Biocon has a total of 1721 patents globally, out of which 878 have been granted. Of these 1721 patents, more than 38% patents are active. United States of America is where Biocon has filed the maximum number of patents, followed by India and Europe. Parallelly, India seems to be the main focused R&D centre and also is the origin country of Biocon.
Biocon was founded in the year 1978. The Company is a fully integrated healthcare company that delivers innovative biopharmaceutical solutions. From discovery to development and commercialisation, Company has the defining science, cost-effective drug development capabilities and significant manufacturing capacity to move ideas to market.
Do read about some of the most popular patents of Biocon which have been covered by us in this article and also you can find Biocon patents information, the worldwide patent filing activity and its patent filing trend over the years, and many other stats over Biocon patent portfolio.
How many patents does the founder and the CEO of Biocon have?
The founder Kiran Mazumdar-Shaw has 12 patents and CEO Siddharth Mittal has 0 patent.
How many patents does Biocon have?
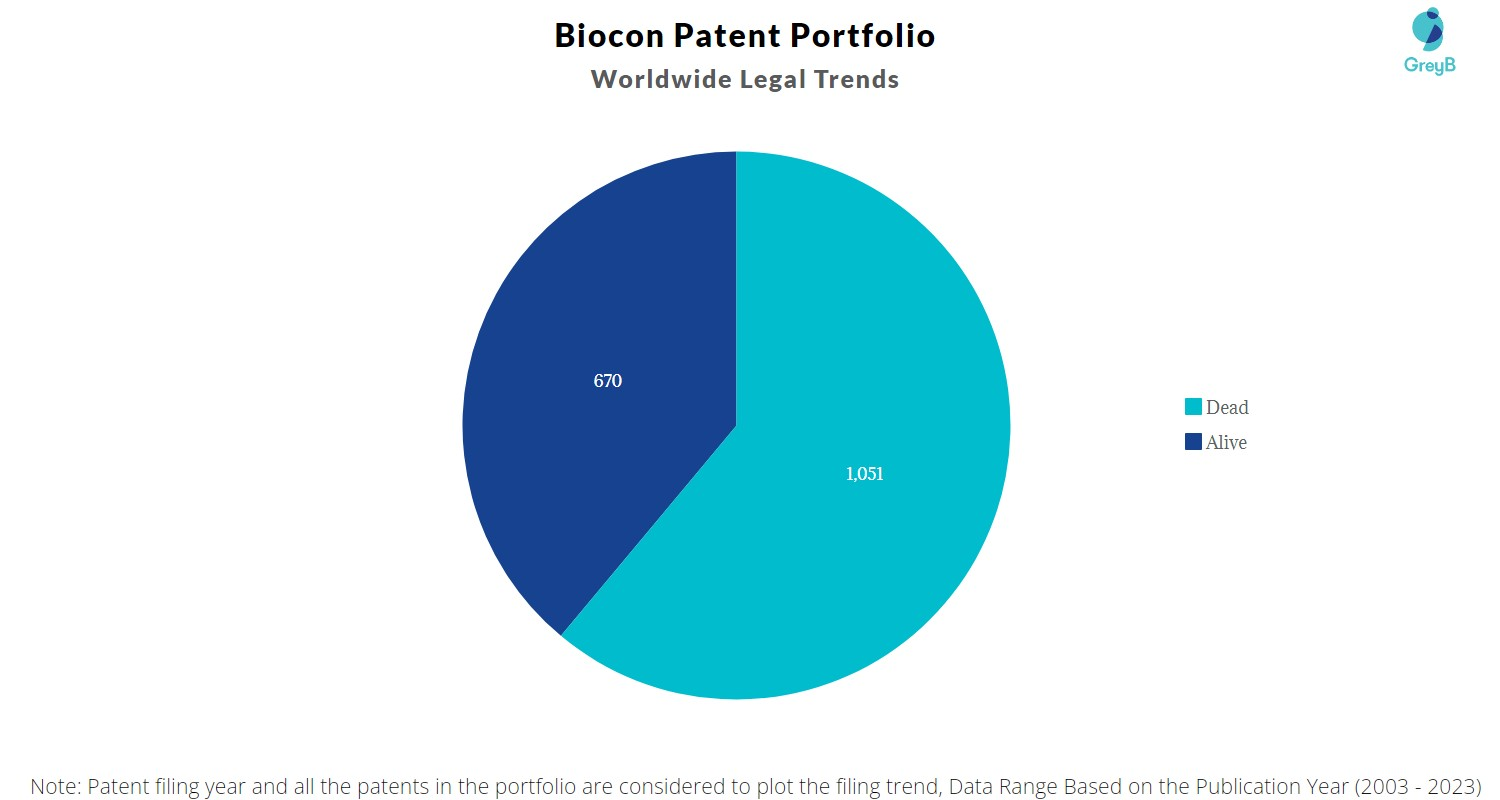
Biocon has a total of 1721 patents globally. These patents belong to 425 unique patent families. Out of 1721 patents, 670 patents are active.
How Many Patents did Biocon File Every Year?
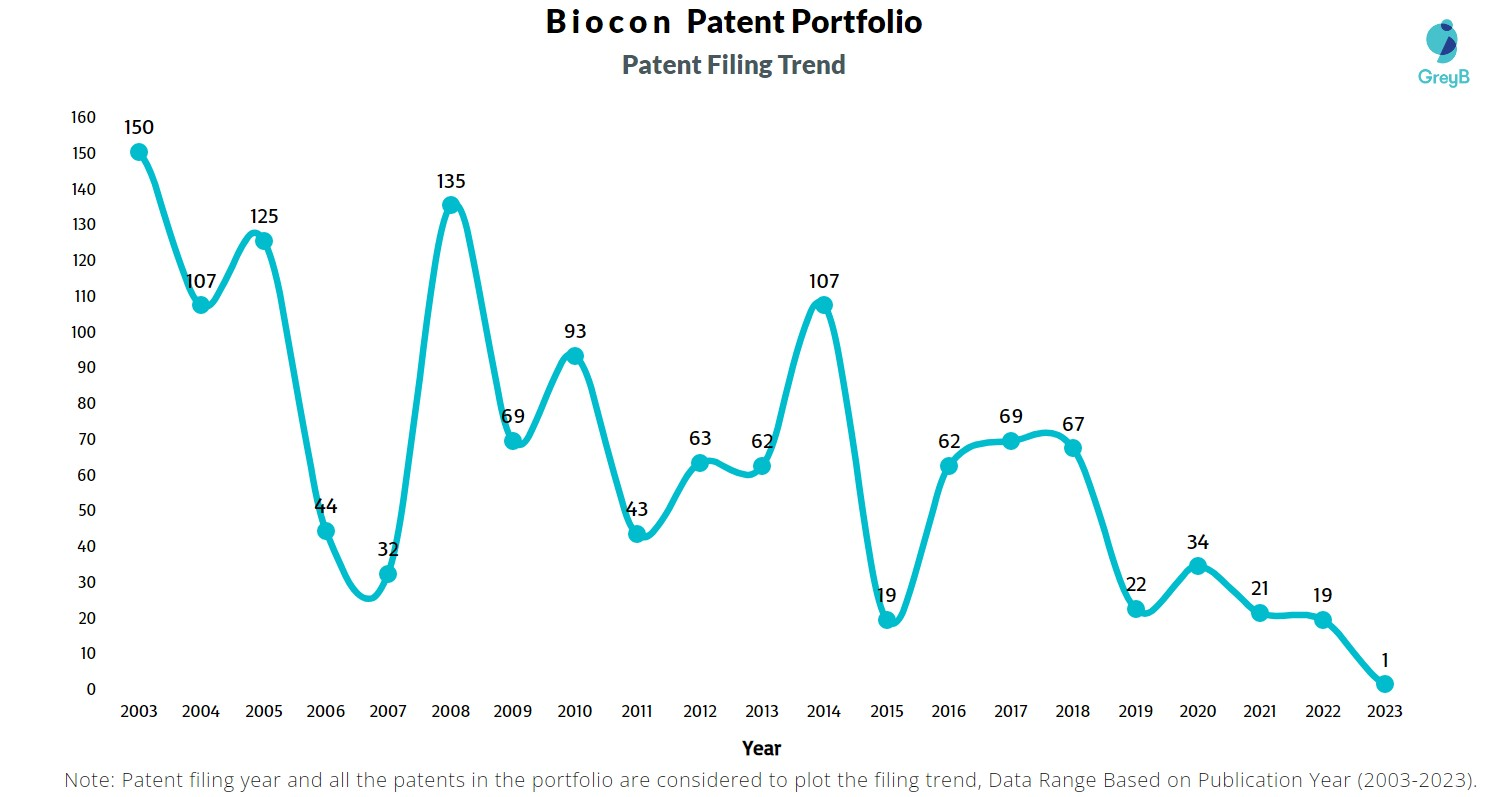
Are you wondering why there is a drop in patent filing for the last two years? It is because a patent application can take up to 18 months to get published. Certainly, it doesn’t suggest a decrease in the patent filing.
| Year of Patents Filing or Grant | Biocon Applications Filed | Biocon Patents Granted |
| 2023 | 1 | 28 |
| 2022 | 19 | 39 |
| 2021 | 21 | 49 |
| 2020 | 34 | 40 |
| 2019 | 22 | 42 |
| 2018 | 67 | 64 |
| 2017 | 69 | 52 |
| 2016 | 62 | 61 |
| 2015 | 19 | 49 |
| 2014 | 107 | 31 |
| 2013 | 62 | 48 |
| 2012 | 63 | 41 |
How many Biocon patents are Alive/Dead?
How Many Patents did Biocon File in Different Countries?
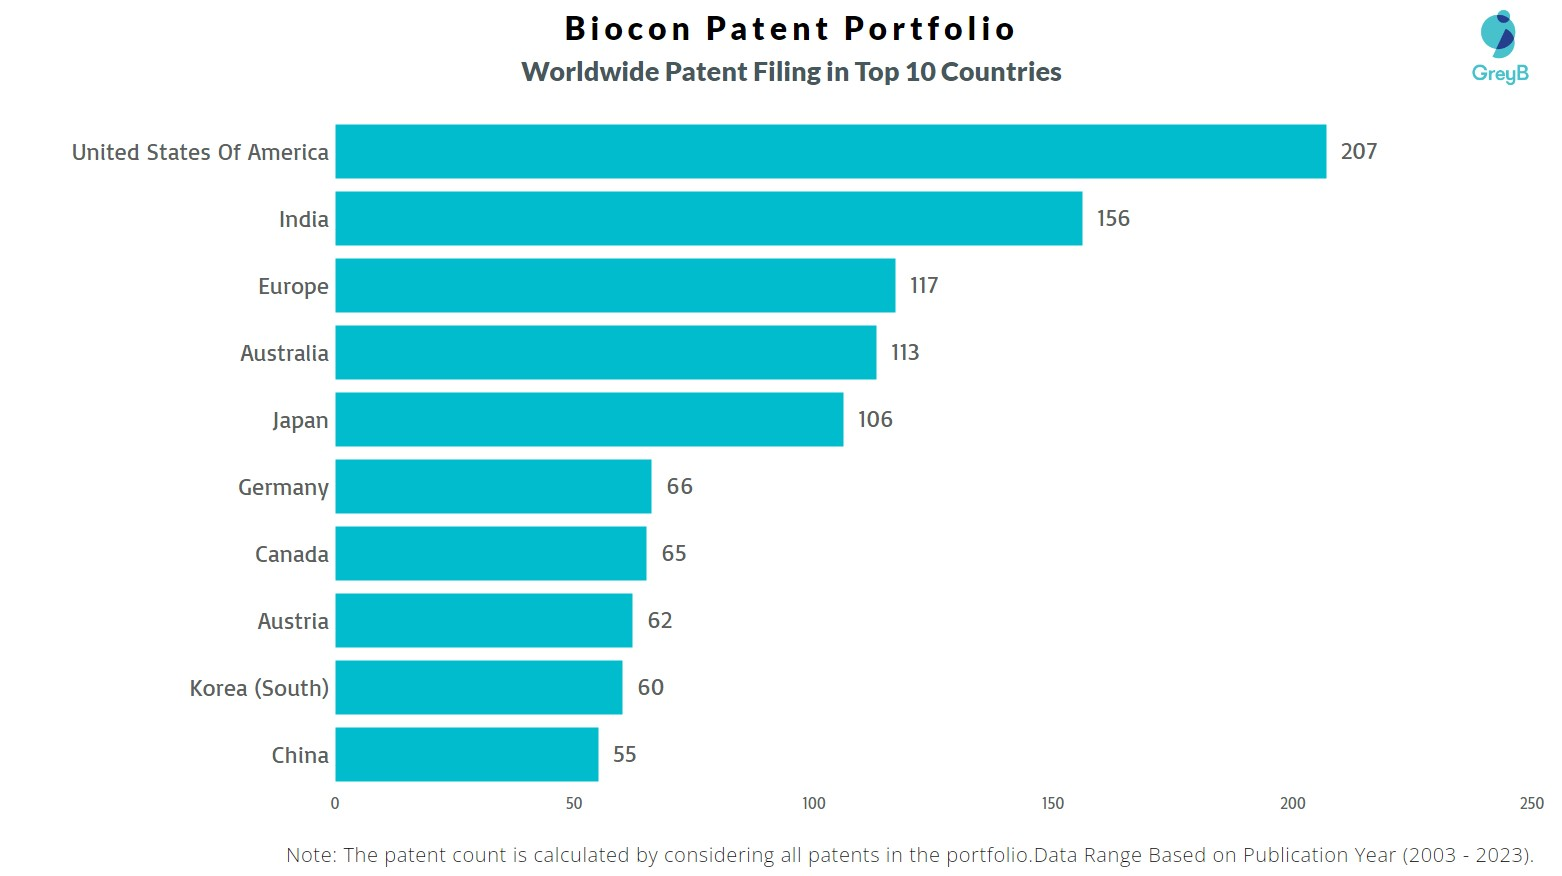
Countries in which Biocon Filed Patents
| Country | Patents |
| United States Of America | 207 |
| India | 156 |
| Europe | 117 |
| Australia | 113 |
| Japan | 106 |
| Germany | 66 |
| Canada | 65 |
| Austria | 62 |
| Korea (South) | 60 |
| China | 55 |
| Russia | 50 |
| Brazil | 45 |
| Mexico | 44 |
| Spain | 42 |
| Hong Kong (S.A.R.) | 36 |
| Israel | 34 |
| Denmark | 33 |
| Poland | 31 |
| New Zealand | 30 |
| Malaysia | 26 |
| Portugal | 22 |
| South Africa | 20 |
| Singapore | 17 |
| Taiwan | 13 |
| Argentina | 11 |
| Hungary | 7 |
| Indonesia | 6 |
| Saudi Arabia | 6 |
| Ukraine | 6 |
| Norway | 5 |
| Czech Republic | 5 |
| Cyprus | 5 |
| Chile | 4 |
| Italy | 4 |
| United Arab Emirates | 4 |
| Slovenia | 4 |
| Slovakia | 4 |
| Cuba | 4 |
| Colombia | 3 |
| Estonia | 3 |
| Peru | 3 |
| Viet Nam | 3 |
| Croatia | 3 |
| Uruguay | 2 |
| Eurasia | 2 |
| Philippines | 2 |
| Romania | 1 |
| Malta | 1 |
| Kazakhstan | 1 |
| Latvia | 1 |
Where are Research Centres of Biocon Patents Located?

10 Best Biocon Patents
US6600201B2 is the most popular patent in the Biocon portfolio. It has received 224 citations so far from companies like Hewlett-Packard Development Company, Qualcomm Mems Technologies and Idc, Llc.
Below is the list of 10 most cited patents of Biocon:
| Publication Number | Citation Count |
| US6600201B2 | 224 |
| WO2006076471A2 | 134 |
| US6858580B2 | 128 |
| WO2013164694A1 | 125 |
| US6703381B1 | 105 |
| WO2011061712A1 | 86 |
| US6713454B1 | 82 |
| US7030084B2 | 80 |
| WO2009113083A1 | 79 |
| WO2012147053A1 | 71 |
How many inventions of other companies were rejected due to Biocon patents?
The statistics below share strategic R&D insights. It tells the companies that were trying to protect inventions similar to Biocon invention. They couldn’t because Biocon had protected those before them.
Examiners at the USPTO referred 37 Biocon patents in 131 rejections (35 USC § 102 or 35 USC § 103 types).
The top citing companies in the Biocon patent portfolio are Nektar Therapeutics, Novo Nordisk and Merck Patent.
List of the Companies whose Patents were rejected citing Biocon –
| Company | Number of Patent Applications that faced Rejection Citing Biocon Patents | Number of Rejections (102 & 103) |
| Nektar Therapeutics | 5 | 10 |
| Novo Nordisk | 5 | 13 |
| Merck Patent | 4 | 8 |
| Immunomedics | 3 | 3 |
| Upjohn | 2 | 2 |
| Biomarin Pharmaceutical | 2 | 2 |
| Heat Biologics | 2 | 2 |
| Igisu | 2 | 4 |
| Phyton Holdings | 1 | 1 |
| Neuren Pharmaceuticals | 1 | 2 |
Count of 102 and 103 Type Rejections based on Biocon Patents

Top Biocon Patents used in Rejecting Most Patent Applications
| Patent Number | Count of Rejected Applications |
| US8815247B2 | 12 |
| US20040152769A1 | 5 |
| US7875700B2 | 4 |
| US7605123B2 | 4 |
| US7648962B2 | 4 |
| US6664095B1 | 3 |
| US7060675B2 | 2 |
| US7230120B2 | 2 |
| US20080243923A1 | 2 |
| US6770625B2 | 2 |
| US8133716B2 | 2 |
| US6835802B2 | 2 |
| US6858580B2 | 2 |
| US6541508B2 | 1 |
| US20100029933A1 | 1 |
What Percentage of Biocon US Patent Applications were Granted?
Biocon (Excluding its subsidiaries) has filed 208 patent applications at USPTO so far (Excluding Design and PCT applications). Out of these 135 have been granted leading to a grant rate of 79.88%.
Below are the key stats of Biocon patent prosecution at the USPTO.

Which Law Firms Filed Most US Patents for Biocon?
| Law Firm | Total Applications | Success Rate |
| Moore & Van Allen | 96 | 82.76% |
| Schwegman Lundberg & Woessner | 29 | 86.21% |
| Myers Bigel | 18 | 75.00% |
| Cooley | 14 | 77.78% |
| Katten Muchin Rosenman | 13 | 90.91% |
| Olive Law Group | 5 | 80.00% |
| Caesar Rivise | 3 | 66.67% |
| Dla Piper | 3 | 0.00% |
| Harness Dickey Troy | 3 | 0.00% |
| Ballard Spahr | 2 | 50.00% |
What are Biocon key innovation segments?
What Technologies are Covered by Biocon?
The chart below distributes patents filed by Biocon