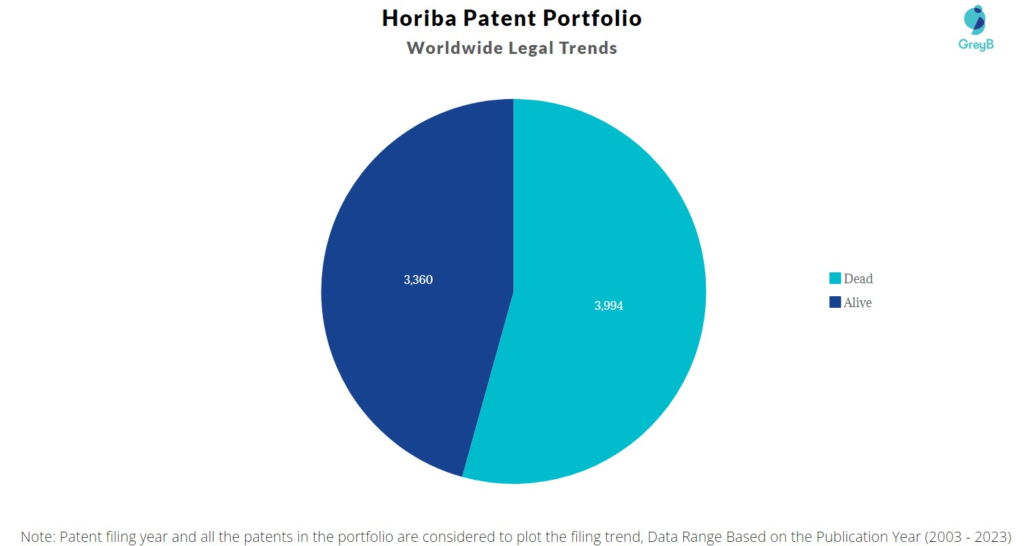
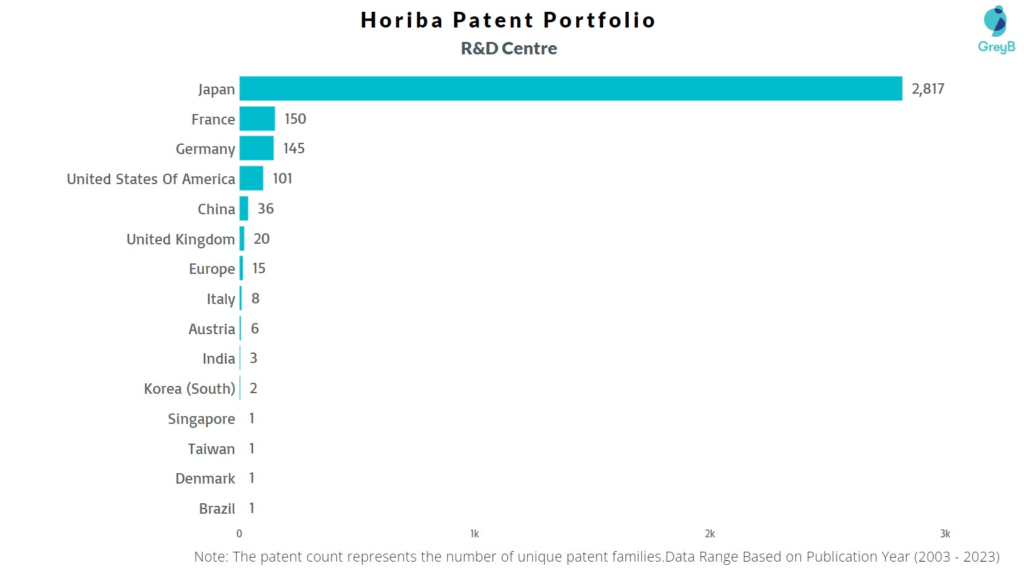
Horiba has a total of 7354 patents globally, out of which 4153 have been granted. Of these 7354 patents, more than 45% patents are active. Japan is where Horiba has filed the maximum number of patents, followed by United States of America and China. Parallelly, Japan seems to be the main focused R&D centre and also is the origin country of Horiba.
Horiba was founded in the year 1945. The Company manufactures and markets measuring instruments and analyzers. The Company’s main product lines are scientific analyzers, environment monitoring, medical analyzers, engine emission analyzers and semiconductor test equipment.
Do read about some of the most popular patents of Horiba which have been covered by us in this article and also you can find Horiba patents information, the worldwide patent filing activity and its patent filing trend over the years, and many other stats over Horiba patent portfolio.
How many patents does the founder of Horiba have?
The founder Masao Horiba has 5 patents.
How many patents does Horiba have?
Horiba has a total of 7354 patents globally. These patents belong to 3309 unique patent families. Out of 7354 patents, 3360 patents are active.
How Many Patents did Horiba File Every Year?
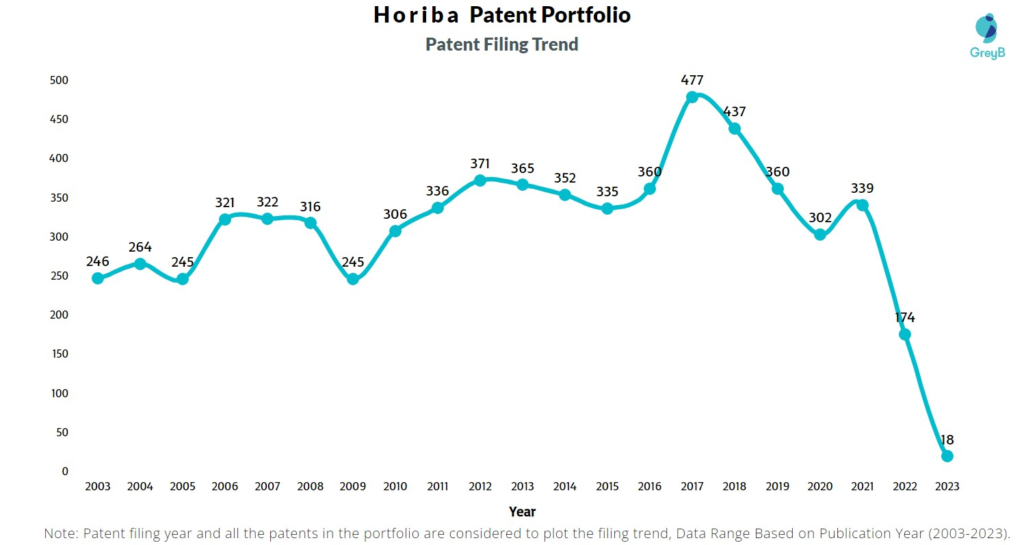
Are you wondering why there is a drop in patent filing for the last two years? It is because a patent application can take up to 18 months to get published. Certainly, it doesn’t suggest a decrease in the patent filing.
| Year of Patents Filing or Grant | Horiba Applications Filed | Horiba Patents Granted |
| 2023 | 18 | 162 |
| 2022 | 174 | 281 |
| 2021 | 339 | 298 |
| 2020 | 302 | 270 |
| 2019 | 360 | 282 |
| 2018 | 437 | 236 |
| 2017 | 477 | 204 |
| 2016 | 360 | 195 |
| 2015 | 335 | 234 |
| 2014 | 352 | 191 |
| 2013 | 365 | 219 |
| 2012 | 371 | 193 |
How many Horiba patents are Alive/Dead?
How Many Patents did Horiba File in Different Countries?
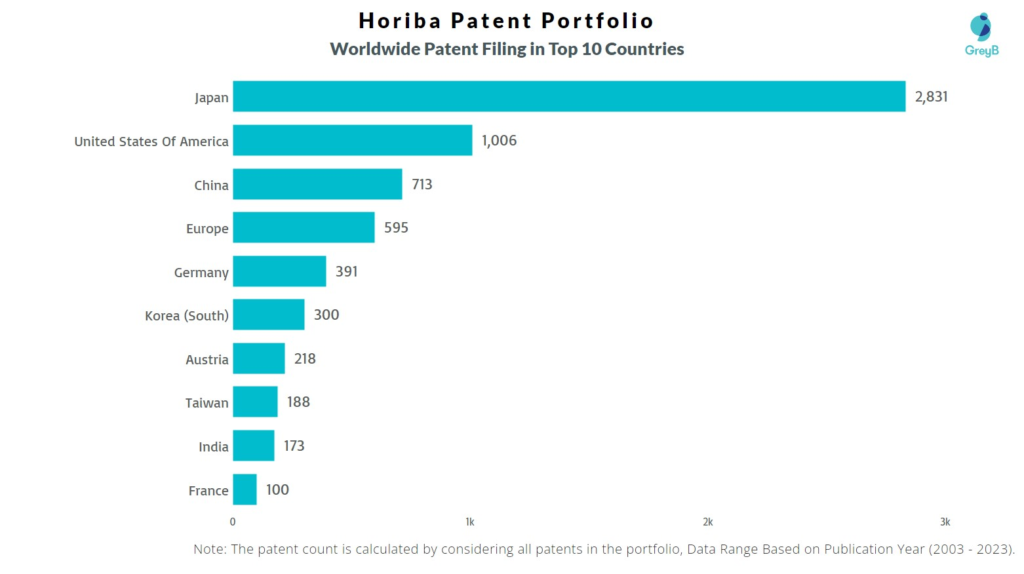
Countries in which Horiba Filed Patents
| Country | Patents |
| Japan | 2831 |
| United States Of America | 1006 |
| China | 713 |
| Europe | 595 |
| Germany | 391 |
| Korea (South) | 300 |
| Austria | 218 |
| Taiwan | 188 |
| India | 173 |
| France | 100 |
| United Kingdom | 61 |
| Brazil | 24 |
| Singapore | 18 |
| Spain | 15 |
| Denmark | 14 |
| Hong Kong (S.A.R.) | 14 |
| Canada | 11 |
| Italy | 10 |
| Indonesia | 9 |
| Australia | 7 |
| Malaysia | 5 |
| Mexico | 3 |
| South Africa | 3 |
| Russia | 3 |
| Switzerland | 2 |
| Egypt | 1 |
| Norway | 1 |
| Israel | 1 |
| Slovenia | 1 |
| Brunei | 1 |
| Hungary | 1 |
Where are Research Centres of Horiba Patents Located?
10 Best Horiba Patents
US6633231B1 is the most popular patent in the Horiba portfolio. It has received 318 citations so far from companies like Samsung Electronics, Polycom and Belkin International.
Below is the list of 10 most cited patents of Horiba:
| Publication Number | Citation Count |
| US6633231B1 | 318 |
| US6539968B1 | 198 |
| US6522078B1 | 154 |
| USD549827S1 | 118 |
| US20030083980A1 | 110 |
| WO2011012825A1 | 81 |
| US8356623B2 | 51 |
| JP2003279532A | 51 |
| JP2006284225A | 49 |
| JP2006071388A | 49 |
How many inventions of other companies were rejected due to Horiba patents?
The statistics below share strategic R&D insights. It tells the companies that were trying to protect inventions similar to Horiba invention. They couldn’t because Horiba had protected those before them.
Examiners at the USPTO referred 284 Horiba patents in 987 rejections (35 USC § 102 or 35 USC § 103 types).
The top citing companies in the Horiba patent portfolio are Fujikin, Sysmex Corporation and Hitachi Metals.
List of the Companies whose Patents were rejected citing Horiba –
| Company | Number of Patent Applications that faced Rejection Citing Horiba Patents | Number of Rejections (102 & 103) |
| Fujikin | 13 | 32 |
| Sysmex Corporation | 10 | 21 |
| Hitachi Metals | 10 | 15 |
| Samsung Electronics | 8 | 23 |
| Rohm | 8 | 17 |
| Tokyo Electron Limited | 7 | 17 |
| Illinois Tool Works | 7 | 13 |
| Ichor Systems | 6 | 17 |
| Shimadzu | 5 | 13 |
| Hitachi High-Tech Corporation | 5 | 7 |
Count of 102 and 103 Type Rejections based on Horiba Patents
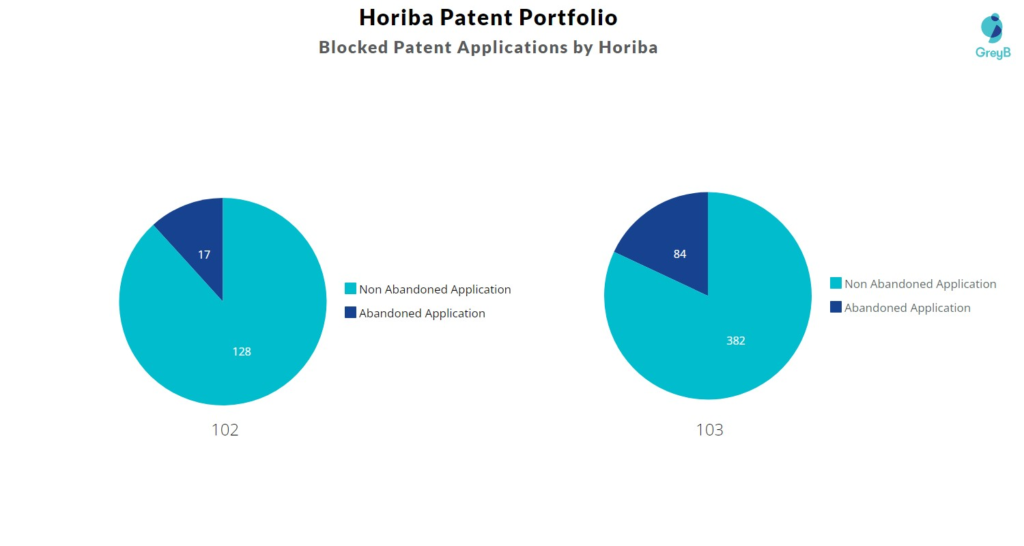
Top Horiba Patents used in Rejecting Most Patent Applications
| Patent Number | Count of Rejected Applications |
| US9008876B2 | 12 |
| US7327444B2 | 11 |
| US8901513B2 | 10 |
| US6539968B1 | 10 |
| US6633231B1 | 8 |
| US7691328B2 | 7 |
| US6522078B1 | 6 |
| US7604010B2 | 6 |
| US9952238B2 | 6 |
| US8377393B2 | 5 |
| US9736389B2 | 5 |
| US9371930B2 | 5 |
| US7254212B2 | 5 |
| US9870650B2 | 5 |
| US7485189B2 | 5 |
What Percentage of Horiba US Patent Applications were Granted?
Horiba (Excluding its subsidiaries) has filed 240 patent applications at USPTO so far (Excluding Design and PCT applications). Out of these 177 have been granted leading to a grant rate of 83.89%.
Below are the key stats of Horiba patent prosecution at the USPTO.

Which Law Firms Filed Most US Patents for Horiba?
| Law Firm | Total Applications | Success Rate |
| Alleman Hall Creasman & Tuttle | 110 | 87.06% |
| Mccoy Russell | 60 | 81.67% |
| Greenblum & Bernstein | 35 | 71.88% |
| Brooks Kushman | 6 | 83.33% |
| Nields Lemack & Frame | 4 | 100.00% |
| Snell & Wilmer | 3 | 66.67% |
| Steptoe & Johnson | 3 | 100.00% |
| Sughrue Mion | 3 | 100.00% |
| Cantor Colburn | 2 | 50.00% |
| Horiba | 2 | 100.00% |
What are Horiba key innovation segments?
What Technologies are Covered by Horiba?
The chart below distributes patents filed by Horiba
