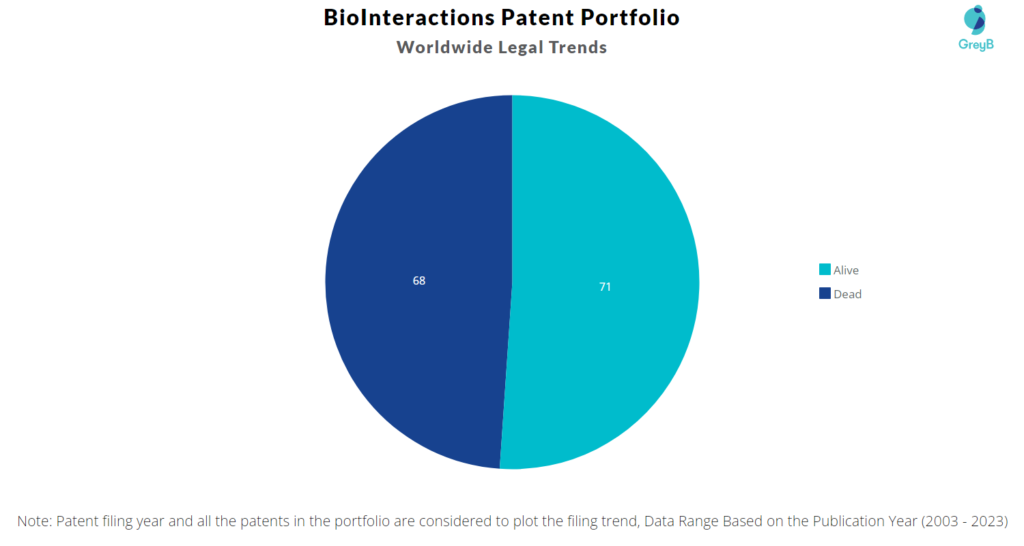
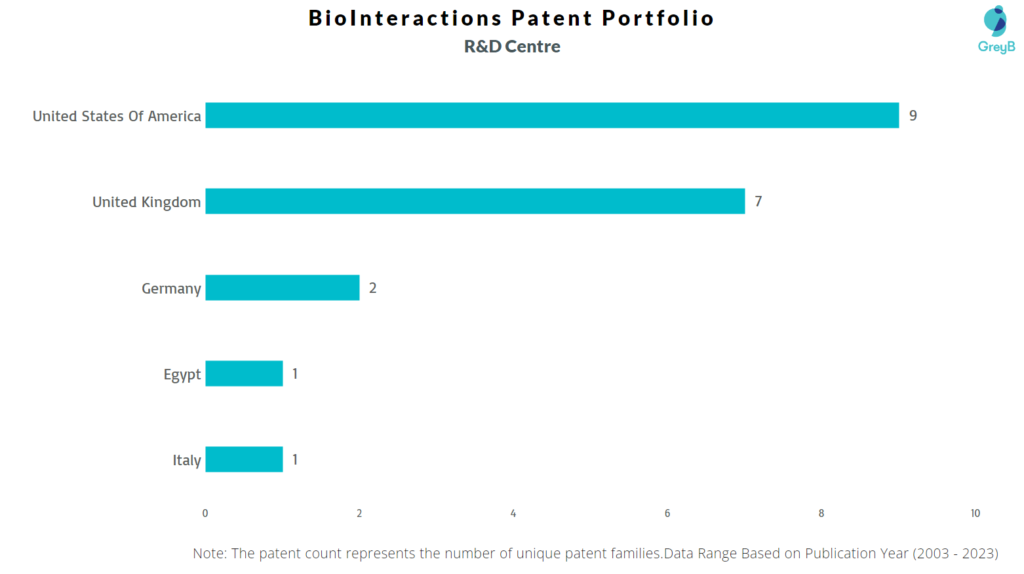
BioInteractions has a total of 139 patents globally, out of which 89 have been granted. Of these 139 patents, more than 51% patents are active. The United States of America is where BioInteractions has filed the maximum number of patents, followed by Europe and Australia. Parallelly, The United States of America seems to be the main focused R&D center and also the USA is the origin country of BioInteractions.
BioInteractions was founded in 1991. The Company provides biocompatible materials for medical devices and is an innovative provider of biocompatible solutions to the worldwide medical device and pharmaceutical industry.
Do read about some of the most popular patents of BioInteractions which have been covered by us in this article and also you can find BioInteractions patents information, the worldwide patent filing activity and its patent filing trend over the years, and many other stats over BioInteractions patent portfolio.
How many patents does BioInteractions have?
BioInteractions has a total of 139 patents globally. These patents belong to 20 unique patent families. Out of 139 patents, 71 patents are active.
How Many Patents did BioInteractions File Every Year?
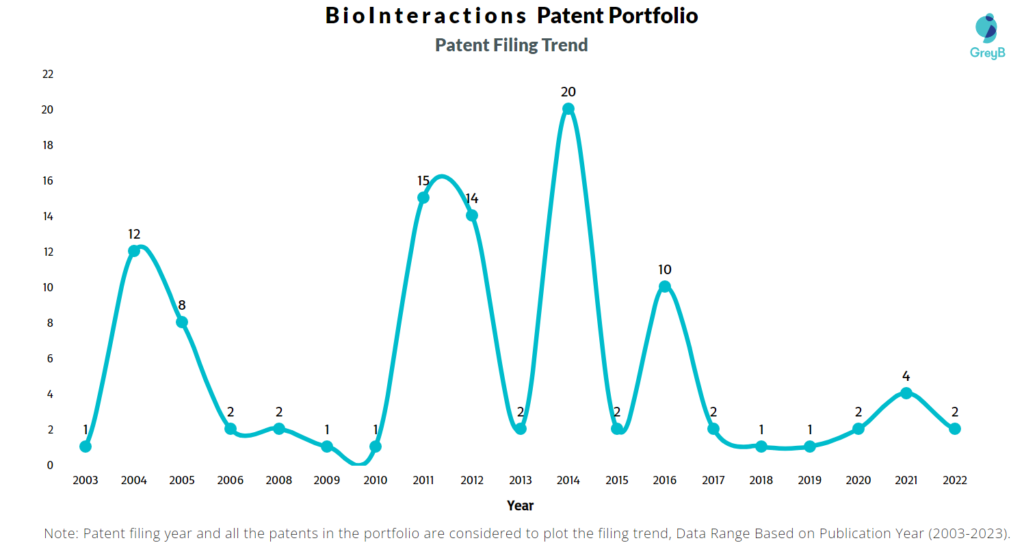
Are you wondering why there is a drop in patent filing for the last two years? It is because a patent application can take up to 18 months to get published. Certainly, it doesn’t suggest a decrease in the patent filing.
| Year of Patents Filing or Grant | Biointeractions Applications Filed | Biointeractions Patents Granted |
| 2023 | – | 6 |
| 2022 | 2 | 2 |
| 2021 | 4 | 11 |
| 2020 | 2 | 9 |
| 2019 | 1 | 7 |
| 2018 | 1 | 4 |
| 2017 | 2 | 1 |
| 2016 | 10 | 1 |
| 2015 | 2 | 9 |
| 2014 | 20 | 2 |
| 2013 | 2 | 2 |
| 2012 | 14 | 5 |
| 2011 | 15 | 3 |
How many BioInteractions patents are Alive/Dead?
Worldwide Patents
How Many Patents did BioInteractions File in Different Countries?
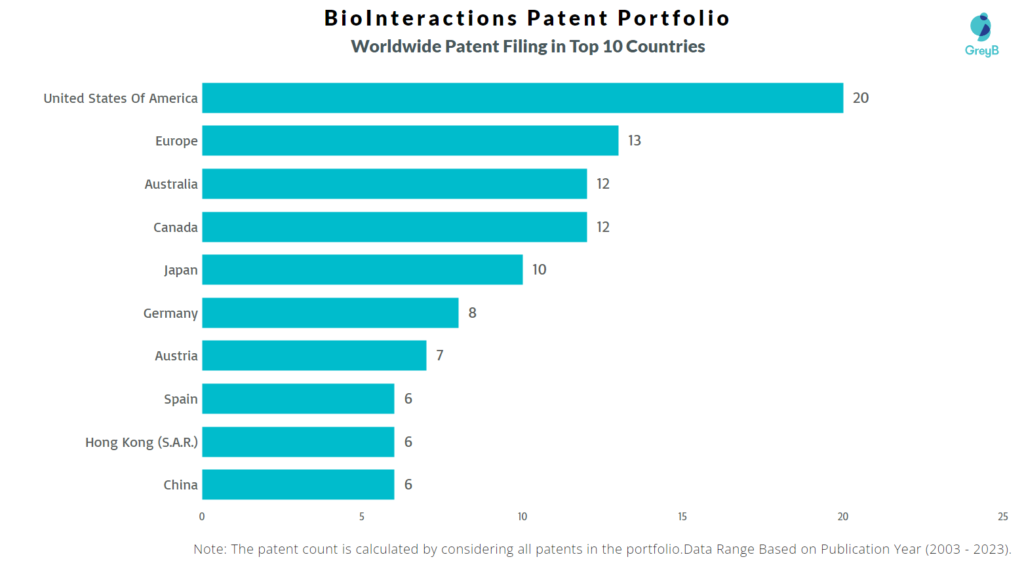
Countries in which BioInteractions Filed Patents
| Country | Patents |
| United States Of America | 20 |
| Europe | 13 |
| Australia | 12 |
| Canada | 12 |
| Japan | 10 |
| Germany | 8 |
| Austria | 7 |
| Spain | 6 |
| Hong Kong (S.A.R.) | 6 |
| China | 6 |
| India | 6 |
| United Kingdom | 5 |
| Brazil | 4 |
| Denmark | 4 |
| Portugal | 3 |
| Poland | 2 |
| Norway | 2 |
| Italy | 1 |
| Egypt | 1 |
| Slovenia | 1 |
Where are Research Centers of BioInteractions Patents Located?
10 Best BioInteractions Patents
WO2004075943A1 is the most popular patent in the BioInteractions portfolio. It has received 39 citations so far from companies like Abbott, and Surmodics Inc.
Below is the list of 10 most cited patents of BioInteractions:
| Publication Number | Citation count |
| WO2004075943A1 | 39 |
| US7771743B1 | 38 |
| WO2012032283A1 | 26 |
| US6929818B2 | 24 |
| US7655038B2 | 21 |
| US20060134166A1 | 20 |
| WO2005115492A1 | 20 |
| US7034061B1 | 17 |
| US6955682B2 | 17 |
| US8101196B2 | 10 |
What Percentage of BioInteractions US Patent Applications were Granted?
BioInteractions (Excluding its subsidiaries) has filed 20 patent applications at USPTO so far (Excluding Design and PCT applications). Out of these 12 have been granted leading to a grant rate of 75.0%.
Below are the key stats of BioInteractions patent prosecution at the USPTO.

Which Law Firms Filed Most US Patents for BioInteractions?
| Law Firm | Total Applications | Success Rate |
| Christensen Fonder Dardi & Herbert Pllc | 9 | 71.43% |
| Ostrolenk Faber Llp | 7 | 100.00% |
| Dardi & Herbert Pllc | 1 | 0.00% |
| Patterson Thuente Ip | 1 | 0% |
| Patterson Thuente Pa | 1 | 100.00% |
| Thompson Coburn Llp | 1 | 0.00% |
What are BioInteractions key innovation segments?
What Technologies are Covered by BioInteractions?
The chart below distributes patents filed by BioInteractions
