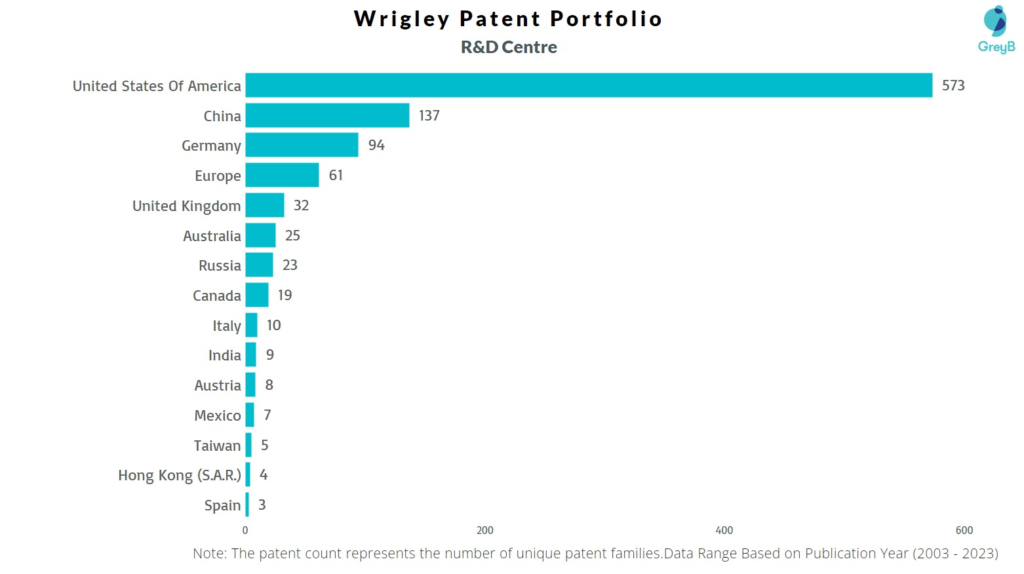
Wrigley has a total of 3653 patents globally, out of which 2300 have been granted. Of these 3653 patents, more than 44% patents are active. United States of America is where Wrigley has filed the maximum number of patents, followed by China and Europe. Parallelly, United States of America seems to be the main focused R&D centre and also is the origin country of Wrigley.
Wrigley was founded in the year 1891. The Company manufactures confectionary products. The Company offers gum, candy, mints, hard and chewy candies and lollipops.
Do read about some of the most popular patents of Wrigley which have been covered by us in this article and also you can find Wrigley patents information, the worldwide patent filing activity and its patent filing trend over the years, and many other stats over Wrigley patent portfolio.
How many patents does Wrigley have?
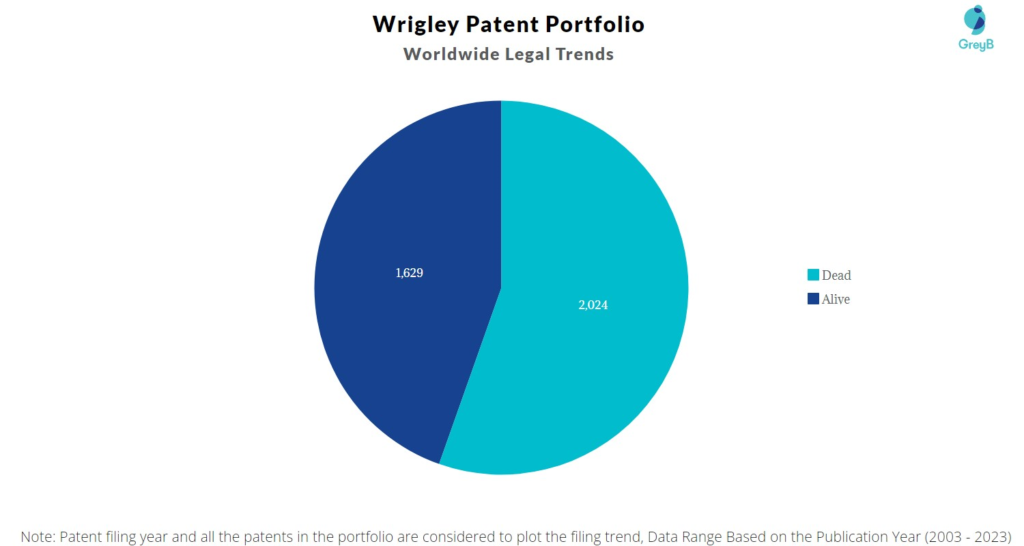
Wrigley has a total of 3653 patents globally. These patents belong to 1023 unique patent families. Out of 3653 patents, 1629 patents are active.
How Many Patents did Wrigley File Every Year?
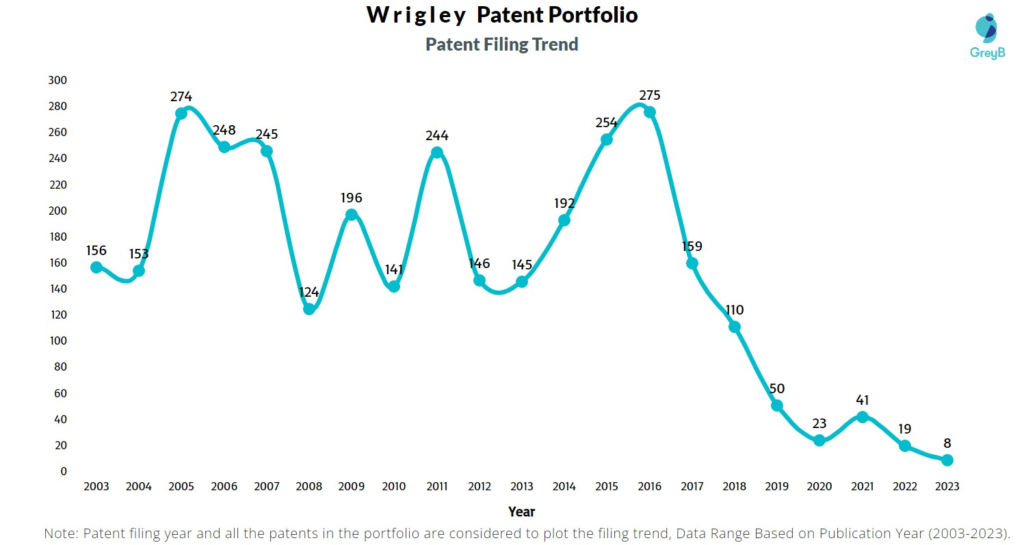
Are you wondering why there is a drop in patent filing for the last two years? It is because a patent application can take up to 18 months to get published. Certainly, it doesn’t suggest a decrease in the patent filing.
| Year of Patents Filing or Grant | Wrigley Applications Filed | Wrigley Patents Granted |
| 2023 | 8 | 54 |
| 2022 | 19 | 56 |
| 2021 | 41 | 102 |
| 2020 | 23 | 97 |
| 2019 | 50 | 97 |
| 2018 | 110 | 161 |
| 2017 | 159 | 163 |
| 2016 | 275 | 189 |
| 2015 | 254 | 141 |
| 2014 | 192 | 136 |
| 2013 | 145 | 124 |
| 2012 | 146 | 133 |
How many Wrigley patents are Alive/Dead?
How Many Patents did Wrigley File in Different Countries?
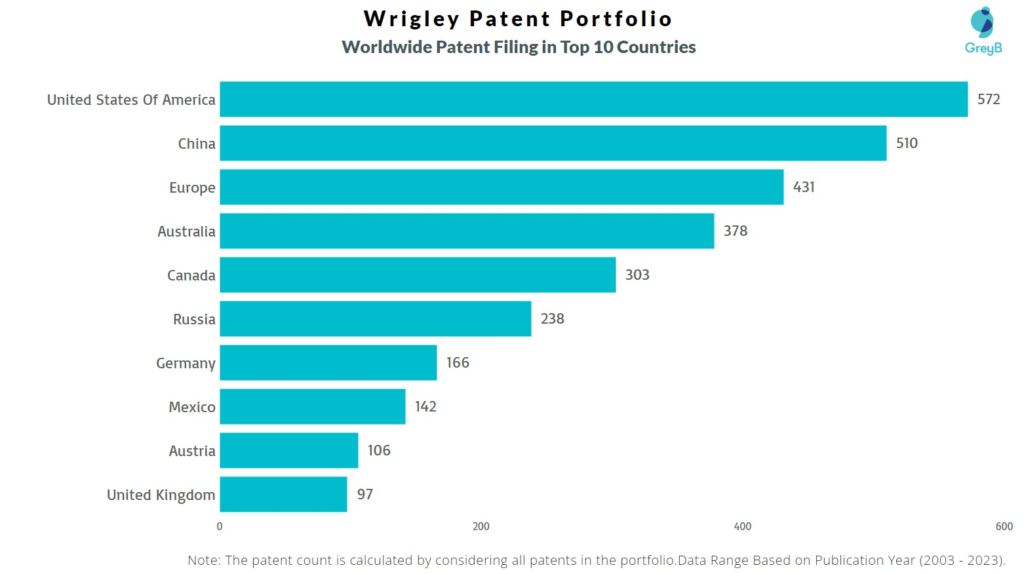
Countries in which Wrigley Filed Patents
| Country | Patents |
| United States Of America | 572 |
| China | 510 |
| Europe | 431 |
| Australia | 378 |
| Canada | 303 |
| Russia | 238 |
| Germany | 166 |
| Mexico | 142 |
| Austria | 106 |
| United Kingdom | 97 |
| India | 89 |
| Poland | 70 |
| Denmark | 55 |
| Brazil | 49 |
| Spain | 34 |
| Japan | 26 |
| Hong Kong (S.A.R.) | 24 |
| Taiwan | 20 |
| Colombia | 13 |
| Italy | 11 |
| Argentina | 10 |
| South Africa | 6 |
| Indonesia | 4 |
| Viet Nam | 3 |
| Singapore | 3 |
| Norway | 3 |
| Africa | 2 |
| Switzerland | 2 |
| Eurasia | 2 |
| Slovakia | 1 |
| Dominican Republic | 1 |
| Czech Republic | 1 |
| Malaysia | 1 |
| Kenya | 1 |
| Israel | 1 |
| Saudi Arabia | 1 |
| United Arab Emirates | 1 |
| Hungary | 1 |
Where are Research Centres of Wrigley Patents Located?
10 Best Wrigley Patents
US6627233B1 is the most popular patent in the Wrigley portfolio. It has received 487 citations so far from companies like Firmenich Sa, Givaudan Sa and Cadbury Adams Usa.
Below is the list of 10 most cited patents of Wrigley:
| Publication Number | Citation Count |
| US6627233B1 | 487 |
| US20040096569A1 | 216 |
| US6656493B2 | 142 |
| US20040043134A1 | 127 |
| US20070104828A1 | 121 |
| US6949264B1 | 111 |
| US6586023B1 | 108 |
| US6627234B1 | 105 |
| US6773716B2 | 105 |
| US6692778B2 | 101 |
How many inventions of other companies were rejected due to Wrigley patents?
The statistics below share strategic R&D insights. It tells the companies that were trying to protect inventions similar to Wrigley invention. They couldn’t because Wrigley had protected those before them.
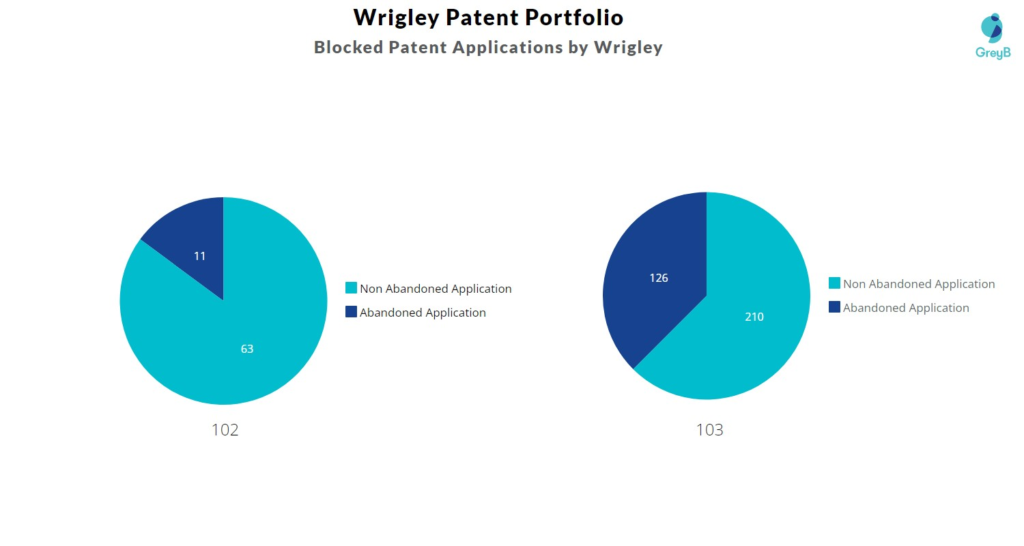
Examiners at the USPTO referred 169 Wrigley patents in 958 rejections (35 USC § 102 or 35 USC § 103 types).
The top citing companies in the Wrigley patent portfolio are Intercontinental Great Brands, Mars Incorporated and Nestec Sa.
List of the Companies whose Patents were rejected citing Wrigley –
| Company | Number of Patent Applications that faced Rejection Citing Wrigley Patents | Number of Rejections (102 & 103) |
| Intercontinental Great Brands | 47 | 151 |
| Mars Incorporated | 10 | 26 |
| Nestec Sa | 8 | 17 |
| Lotte Corporation | 6 | 11 |
| Cargill | 6 | 16 |
| Altria Client Services | 5 | 10 |
| Fertin Pharma | 5 | 12 |
| Gumlink | 5 | 9 |
| Cadbury | 4 | 11 |
| Conopco | 4 | 9 |
Count of 102 and 103 Type Rejections based on Wrigley Patents
Top Wrigley Patents used in Rejecting Most Patent Applications
| Patent Number | Count of Rejected Applications |
| US7032754B2 | 8 |
| US20070141198A1 | 8 |
| US20050260329A1 | 8 |
| US20100166914A1 | 8 |
| US20040043134A1 | 7 |
| US20070104828A1 | 7 |
| US20040156794A1 | 7 |
| US20100291162A1 | 6 |
| US20070183984A1 | 6 |
| US20060198930A1 | 6 |
| US8141707B2 | 6 |
| US20060147585A1 | 6 |
| US20100147724A1 | 6 |
| US7771182B2 | 5 |
| US6783783B2 | 5 |
What Percentage of Wrigley US Patent Applications were Granted?
Wrigley (Excluding its subsidiaries) has filed 365 patent applications at USPTO so far (Excluding Design and PCT applications). Out of these 278 have been granted leading to a grant rate of 76.37%.
Below are the key stats of Wrigley patent prosecution at the USPTO.

Which Law Firms Filed Most US Patents for Wrigley?
| Law Firm | Total Applications | Success Rate |
| Crowell | 154 | 88.96% |
| K&L Gates | 129 | 63.57% |
| Venable | 16 | 68.75% |
| Derick E Allen | 13 | 38.46% |
| Douglas C Mohl | 10 | 100.00% |
| Betty J Zea | 4 | 100.00% |
| David K Dabbiere | 3 | 100.00% |
| Wm Wrigley Jr Company | 3 | 33.33% |
| Bell Boyd & Lloyd | 2 | 50.00% |
| K&L Gates Llp Nestec | 2 | 0.00% |
What are Wrigley key innovation segments?
What Technologies are Covered by Wrigley?
The chart below distributes patents filed by Wrigley
