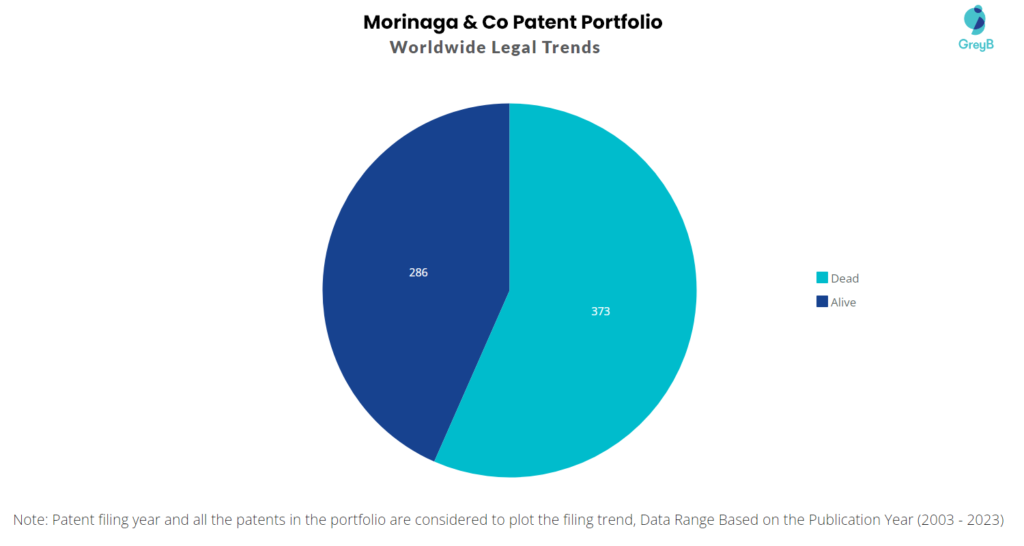
Morinaga & Company has a total of 659 patents globally, out of which 362 have been granted. Of these 659 patents, more than 43% patents are active. Japan is where Morinaga & Company has filed the maximum number of patents, followed by United States of America and Europe (EPO). Parallelly, Japan seems to be the main focused R&D centre of Morinaga & Company and is also the origin country of the firm.
Morinaga & Company was founded in the year 1899 by Taichiro Morinaga. Morinaga & Co is a global confectionery company in Tokyo.
Do read about some of the most popular patents of Morinaga & Company which have been covered by us in this article and also you can find Morinaga & Company patents information, the worldwide patent filing activity and its patent filing trend over the years, and many other stats over Morinaga & Company patent portfolio.
How many patents does Morinaga & Company have?
Morinaga & Company has a total of 659 patents globally. These patents belong to 497 unique patent families. Out of 659 patents, 286 patents are active.
How Many Patents did Morinaga & Company File Every Year?
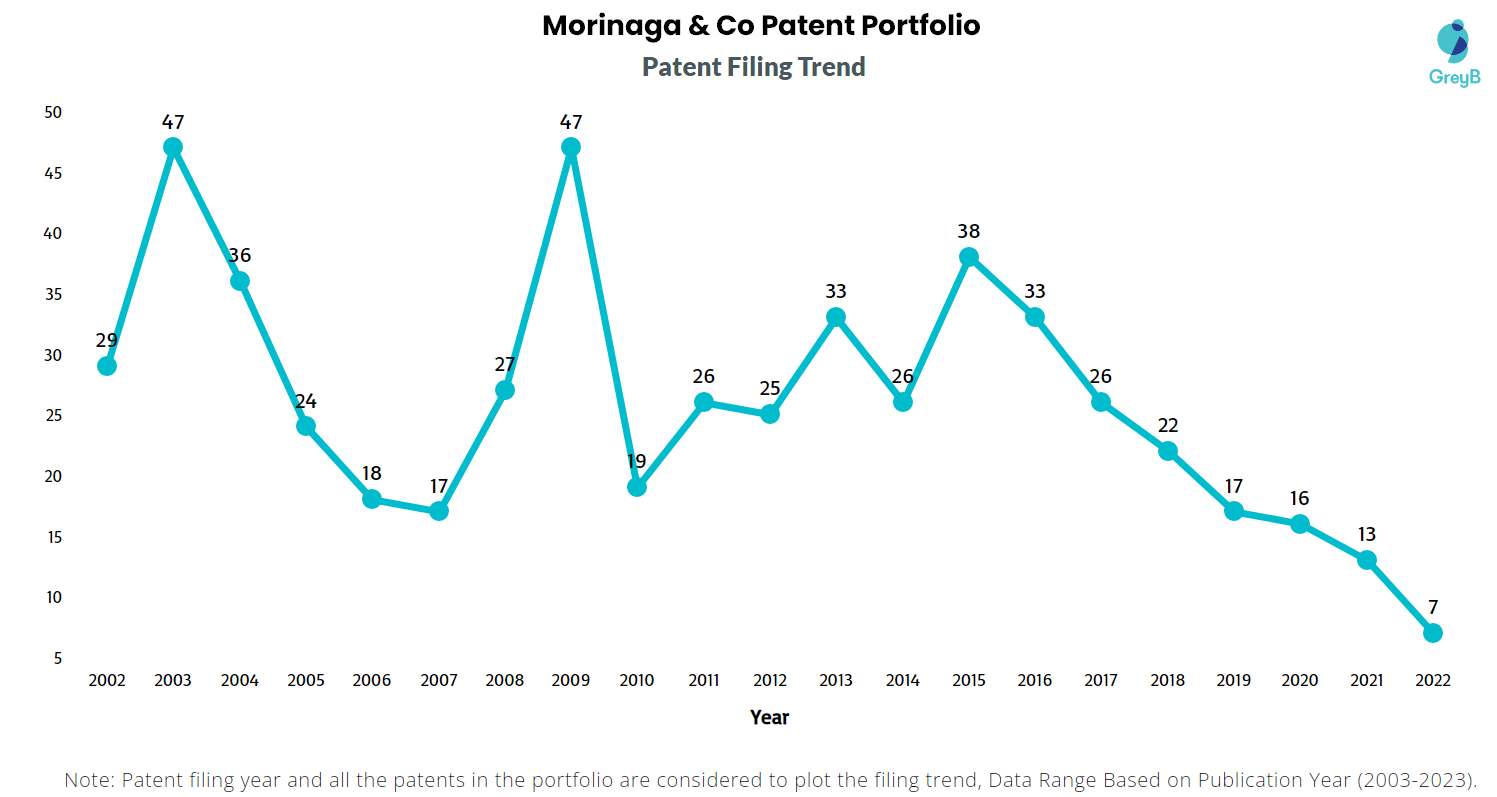
Are you wondering why there is a drop in patent filing for the last two years? It is because a patent application can take up to 18 months to get published. Certainly, it doesn’t suggest a decrease in the patent filing.
| Year of Patents Filing or Grant | Morinaga & Company Applications Filed | Morinaga & Company Patents Granted |
| 2022 | 7 | 11 |
| 2021 | 13 | 14 |
| 2020 | 16 | 18 |
| 2019 | 17 | 13 |
| 2018 | 22 | 13 |
| 2017 | 26 | 14 |
| 2016 | 33 | 23 |
| 2015 | 38 | 27 |
| 2014 | 26 | 20 |
| 2013 | 33 | 21 |
| 2012 | 25 | 15 |
| 2011 | 26 | 21 |
How many Morinaga & Company patents are Alive/Dead?
Worldwide Patents
How Many Patents did Morinaga & Company File in Different Countries?
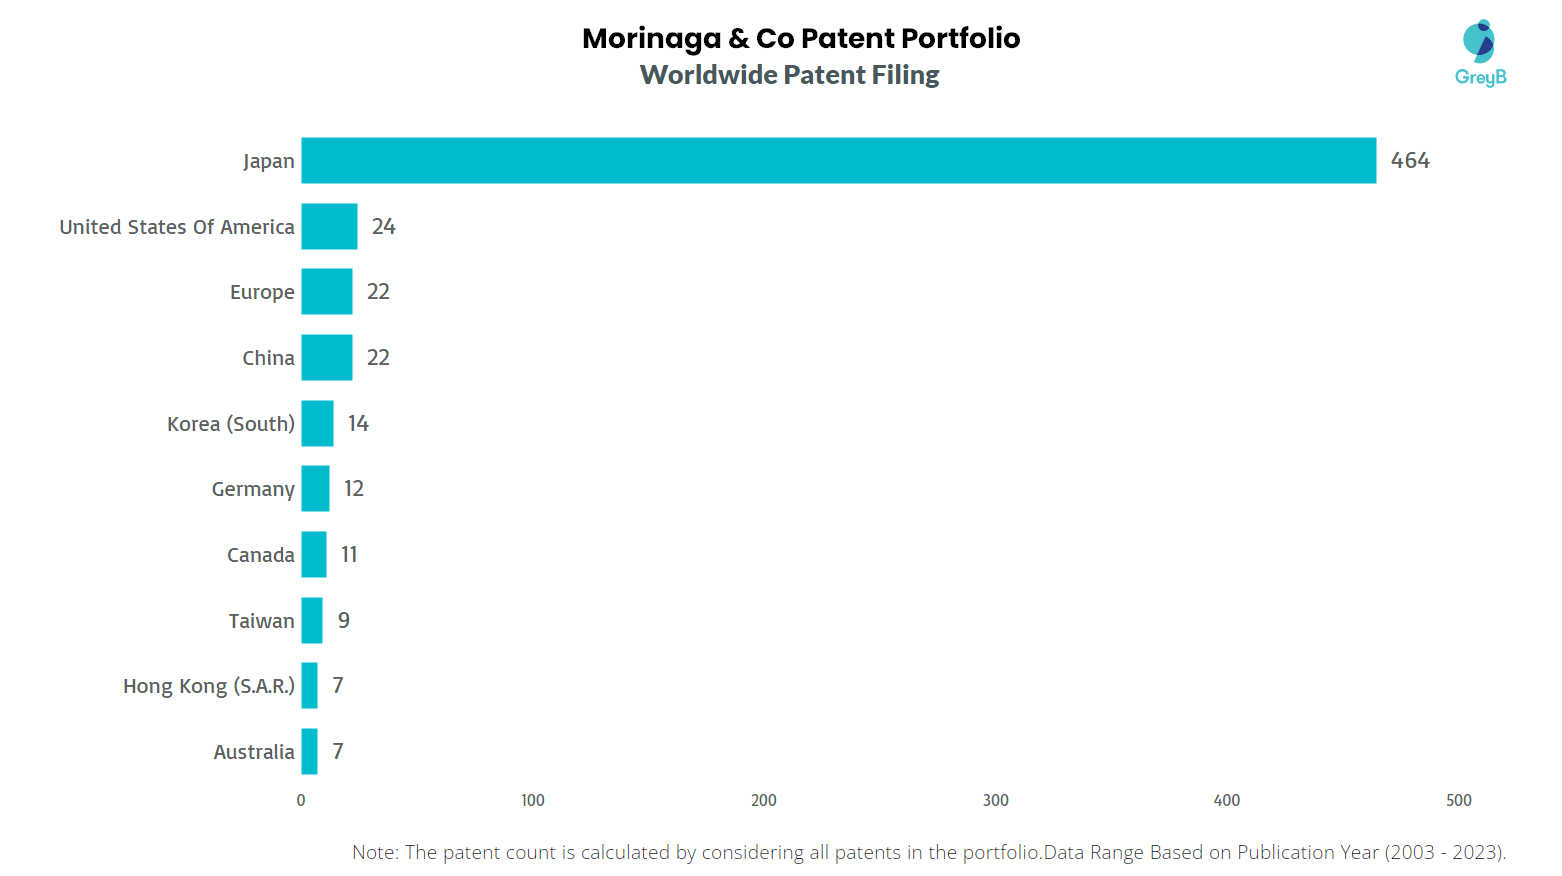
Countries in which Morinaga & Company Filed Patents
| Country | Patents |
| Japan | 464 |
| United States Of America | 24 |
| Europe | 22 |
| China | 22 |
| Korea (South) | 14 |
| Germany | 12 |
| Canada | 11 |
| Taiwan | 9 |
| Hong Kong (S.A.R.) | 7 |
| Australia | 7 |
| Spain | 6 |
| Austria | 6 |
| Brazil | 4 |
| New Zealand | 3 |
| Indonesia | 3 |
| Denmark | 2 |
| Viet Nam | 2 |
| Cyprus | 1 |
| Slovenia | 1 |
| Portugal | 1 |
| Hungary | 1 |
| Argentina | 1 |
| India | 1 |
| Poland | 1 |
| Mexico | 1 |
| Singapore | 1 |
| Estonia | 1 |
| Italy | 1 |
| Norway | 1 |
| United Kingdom | 1 |
Where are Research Centres of Morinaga & Company Patents Located?

10 Best Morinaga & Company Patents
JP2006197857A is the most popular patent in the Morinaga & Company portfolio. It has received 56 citations so far from companies like Lotte, Kracie Foods, and Asahi Soft Drinks.
Below is the list of 10 most cited patents of Morinaga & Company:
| Publication Number | Citation Count |
| JP2006197857A | 56 |
| JP2006197856A | 48 |
| JP2010030911A | 35 |
| JP2003000197A | 35 |
| JP2009055802A | 31 |
| WO2003099304A1 | 30 |
| JP2003000262A | 28 |
| WO2010113315A1 | 27 |
| JP2003235457A | 27 |
| JP2005154339A | 23 |
What are Morinaga & Company key innovation segments?
What Technologies are Covered by Morinaga & Company?
The chart below distributes patents filed by Morinaga & Company