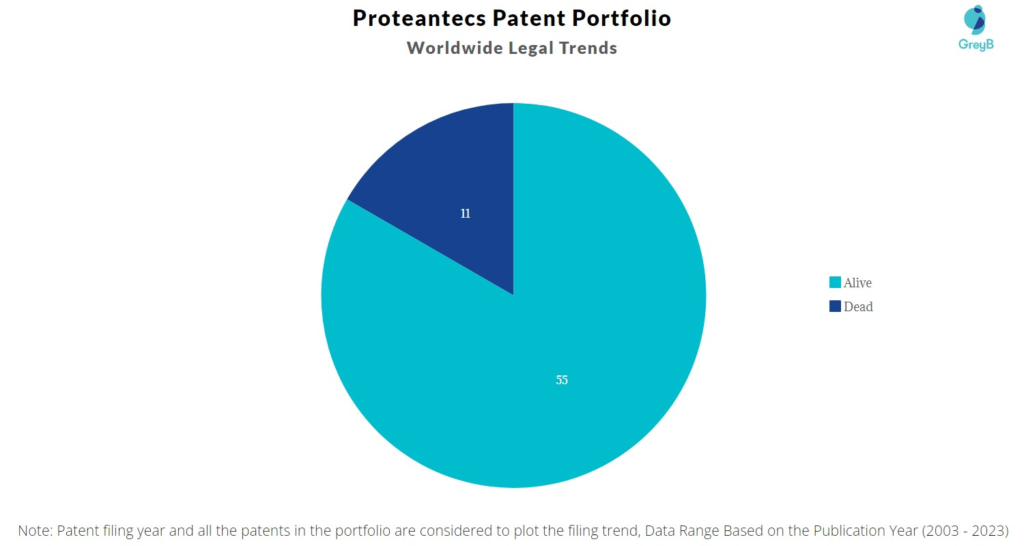
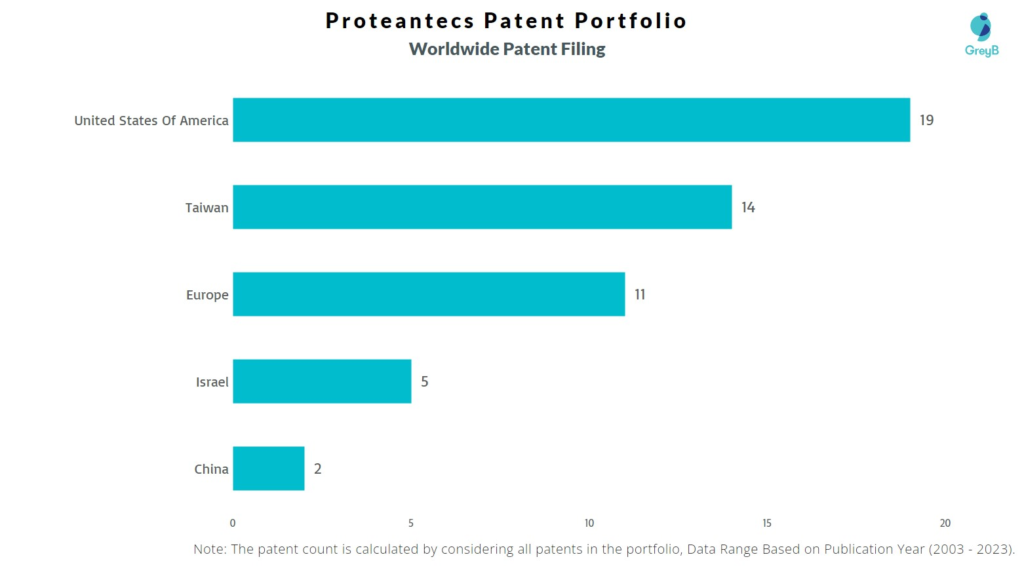
Proteantecs has a total of 66 patents globally, out of which 12 have been granted. Of these 66 patents, more than 83% patents are active. United States of America is where Proteantecs has filed the maximum number of patents, followed by Taiwan and Europe. Parallelly, United States of America seems to be the main focused R&D centre and also Israel is the origin country of Proteantecs.
Proteantecs was founded in the year 2017. The Company provides deep data analytics on a cloud-based platform to monitor the health and performance of advanced electronics.
Do read about some of the most popular patents of Proteantecs which have been covered by us in this article and also you can find Proteantecs patents information, the worldwide patent filing activity and its patent filing trend over the years, and many other stats over Proteantecs patent portfolio.
How many patents does Proteantecs have?
Proteantecs has a total of 66 patents globally. These patents belong to 14 unique patent families. Out of 66 patents, 55 patents are active.
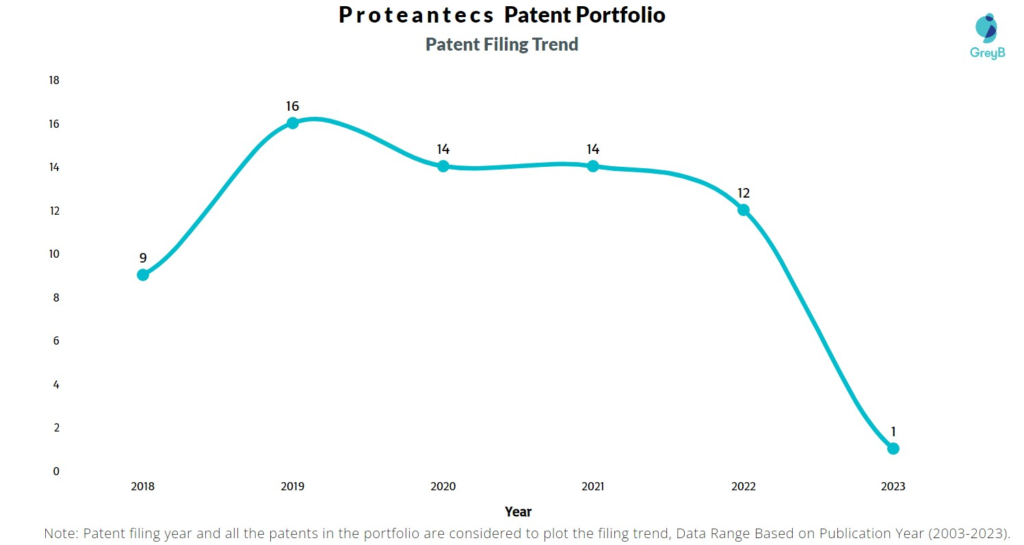
How Many Patents did Proteantecs File Every Year?

Are you wondering why there is a drop in patent filing for the last two years? It is because a patent application can take up to 18 months to get published. Certainly, it doesn’t suggest a decrease in the patent filing.
| Year of Patents Filing or Grant | Proteantecs Applications Filed | Proteantecs Patents Granted |
| 2023 | 1 | 5 |
| 2022 | 12 | 5 |
| 2021 | 14 | 1 |
| 2020 | 14 | 1 |
| 2019 | 16 | – |
| 2018 | 9 | – |
How many Proteantecs patents are Alive/Dead?

How Many Patents did Proteantecs File in Different Countries?

Countries in which Proteantecs Filed Patents
| Country | Patents |
| United States Of America | 19 |
| Taiwan | 14 |
| Europe | 11 |
| Israel | 5 |
| China | 2 |
Where are Research Centres of Proteantecs Patents Located?
The Research Centre for all the Proteantecs patents is the United States of America.
10 Best Proteantecs Patents
WO2019202595A1 is the most popular patent in the Proteantecs portfolio. It has received 14 citations so far from companies like Haiguang Information Technology, AU Optronics and Inventec.
Below is the list of 10 most cited patents of Proteantecs:
| Publication Number | Citation Count |
| WO2019202595A1 | 14 |
| WO2019135247A1 | 10 |
| WO2019097516A1 | 10 |
| WO2021019539A1 | 8 |
| WO2019102467A1 | 8 |
| WO2020230130A1 | 7 |
| WO2020141516A1 | 7 |
| WO2022009199A1 | 6 |
| WO2021214562A1 | 6 |
| WO2019244154A1 | 6 |
What Percentage of Proteantecs US Patent Applications were Granted?
Proteantecs (Excluding its subsidiaries) has filed 16 patent applications at USPTO so far (Excluding Design and PCT applications). Out of these 7 have been granted leading to a grant rate of 100.0%.
Below are the key stats of Proteantecs patent prosecution at the USPTO.

Which Law Firms Filed Most US Patents for Proteantecs?
| Law Firm | Total Applications | Success Rate |
| The Roy Gross Law Firm | 16 | 100.00% |
What are Proteantecs‘ key innovation segments?
What Technologies are Covered by Proteantecs?

The chart below distributes patents filed by Proteantecs
