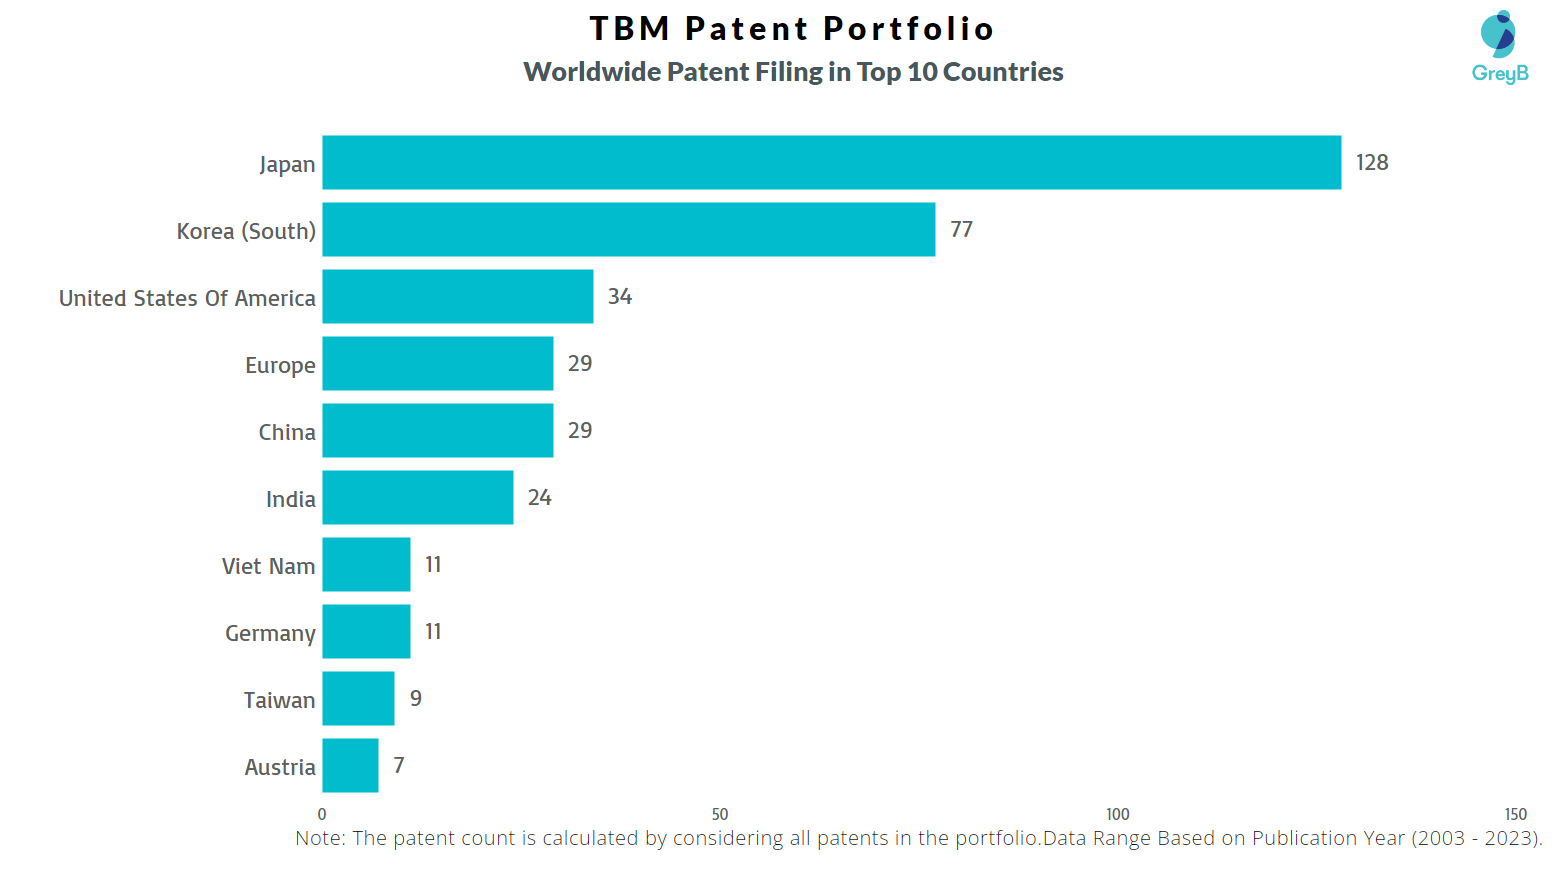
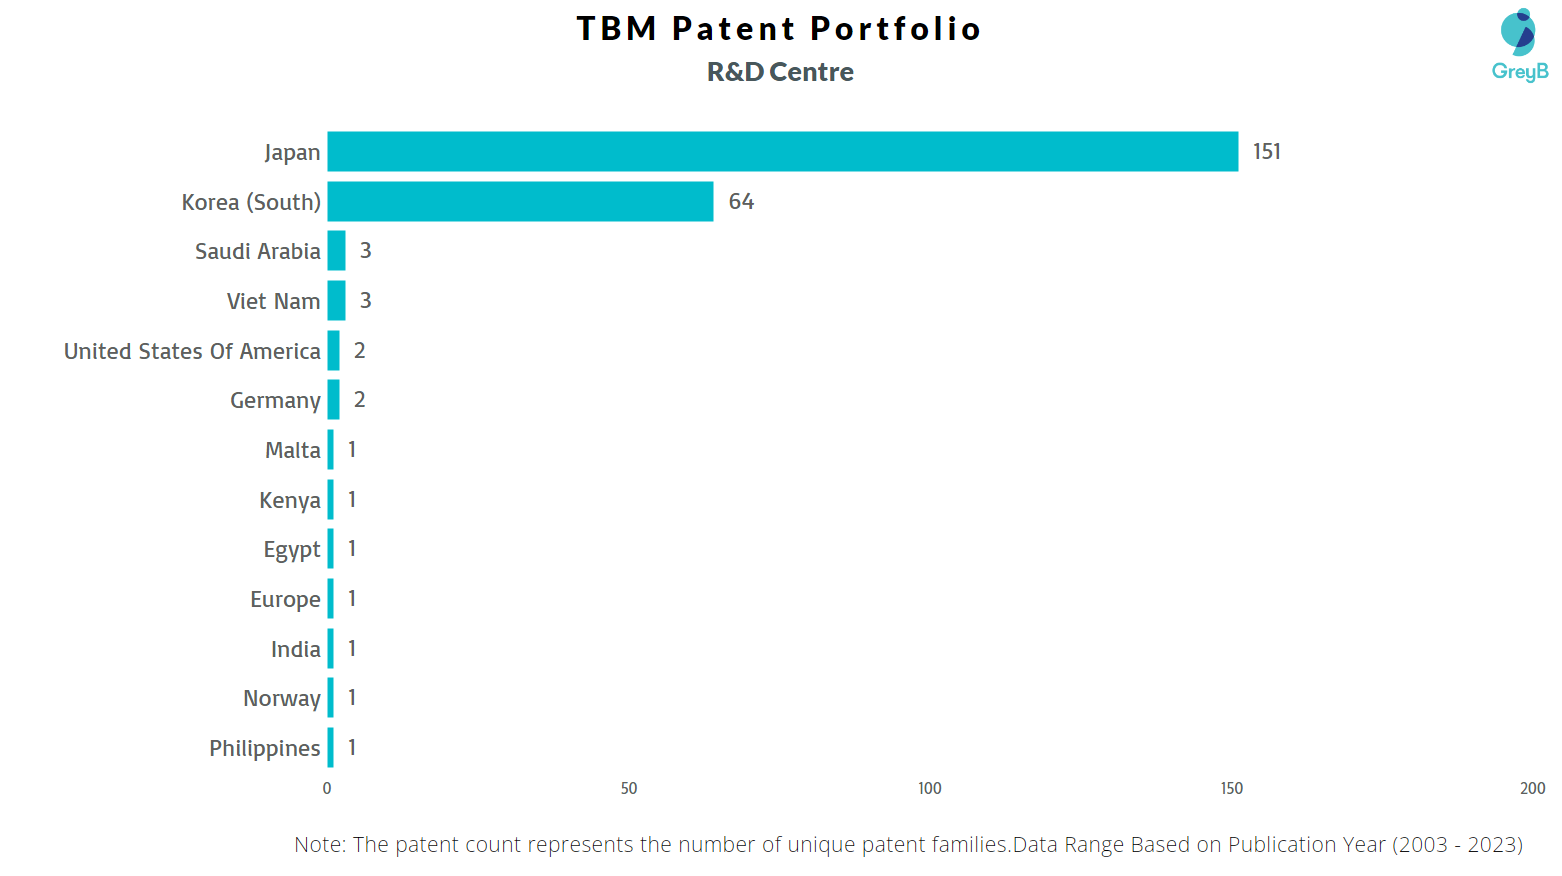
TBM has a total of 468 patents globally, out of which 224 have been granted. Of these 468 patents, more than 72% patents are active. The Japan is where TBM has filed the maximum number of patents, followed by Korea (South) and United States of America. Parallelly, The Japan seems to be the main focused R&D center and also is the origin country of TBM.
TBM was founded in 2011. The Company manufactures and distributes limex products. The Company produces limex paper products, limex plastics and other products. The Company also provides installation services.
Do read about some of the most popular patents of TBM which have been covered by us in this article and also you can find TBM patents information, the worldwide patent filing activity and its patent filing trend over the years, and many other stats over TBM patent portfolio.
How many patents does the Founder and CEO of TBM have?
The Founders Koji Sakamoto has 0 patent, Momo Nakatani has 0 patent, Sumi Yuichiro has 73 patents, Tetsuya Imamura has 0 patents and Adam Bowen has 0 patents and the CEO Yamasaki Nobuyoshi ha 22 patents.
How many patents does TBM have?
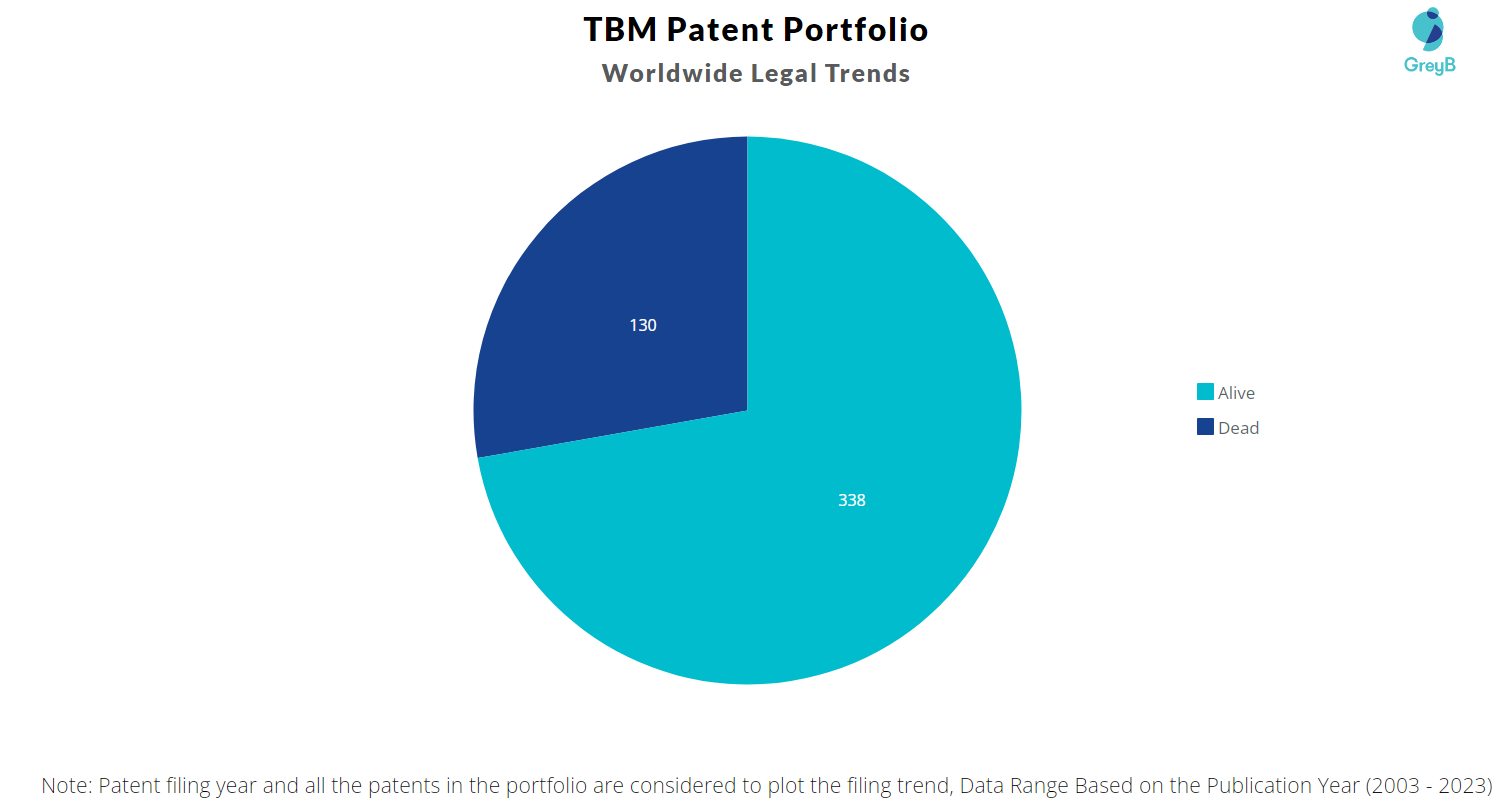
TBM has a total of 468 patents globally. These patents belong to 232 unique patent families. Out of 468 patents, 338 patents are active.
How Many Patents did TBM File Every Year?
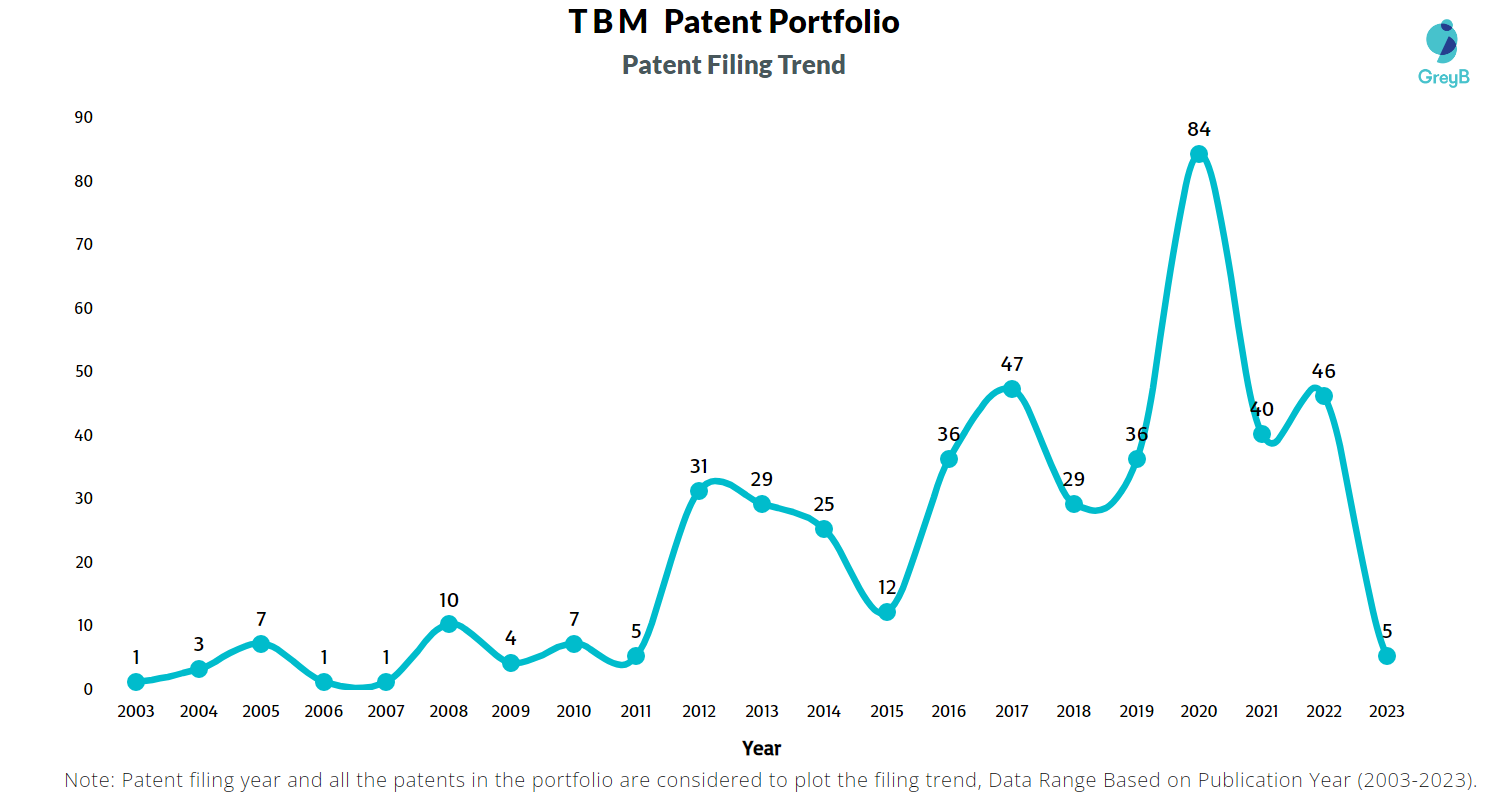 Are you wondering why there is a drop in patent filing for the last two years? It is because a patent application can take up to 18 months to get published. Certainly, it doesn’t suggest a decrease in the patent filing.
| Year of Patents Filing or Grant | TBM Applications Filed | TBM Patents Granted |
| 2023 | 5 | 37 |
| 2022 | 46 | 31 |
| 2021 | 40 | 13 |
| 2020 | 84 | 27 |
| 2019 | 36 | 21 |
| 2018 | 29 | 20 |
| 2017 | 47 | 7 |
| 2016 | 36 | 6 |
| 2015 | 12 | 10 |
| 2014 | 25 | 10 |
| 2013 | 29 | 7 |
| 2012 | 31 | 9 |
How many TBM patents are Alive/Dead?
How Many Patents did TBM File in Different Countries?
Countries in which TBM Filed Patents
| Country | Patents |
| Japan | 128 |
| Korea (South) | 77 |
| United States Of America | 34 |
| Europe | 29 |
| China | 29 |
| India | 24 |
| Viet Nam | 11 |
| Germany | 11 |
| Taiwan | 9 |
| Austria | 7 |
| Philippines | 7 |
| Saudi Arabia | 5 |
| Indonesia | 4 |
| Russia | 4 |
| Norway | 3 |
| Denmark | 3 |
| Spain | 2 |
| Canada | 2 |
| Poland | 2 |
| Hungary | 2 |
| Portugal | 2 |
| Brazil | 2 |
| Malaysia | 1 |
| Turkey | 1 |
| Hong Kong (S.A.R.) | 1 |
| United Arab Emirates | 1 |
| Malta | 1 |
| South Africa | 1 |
| Egypt | 1 |
| Mongolia | 1 |
| Kenya | 1 |
| Slovakia | 1 |
| Morocco | 1 |
Where are Research Centers of TBM Patents Located?
10 Best TBM Patents
WO2014109267A1 is the most popular patent in the TBM portfolio. It has received 54 citations so far from companies like Yupo Corporation, Canon Finetech Nisca and Anhui Jiayang New Material Technology.
Below is the list of 10 most cited patents of TBM:
| Publication Number | Citation Count |
| WO2014109267A1 | 54 |
| US20170328649A1 | 37 |
| WO2012165311A1 | 23 |
| JP2018048229A | 18 |
| JP4153192B2 | 16 |
| JP4435926B2 | 13 |
| WO2016051612A1 | 11 |
| US8131267B2 | 10 |
| JP2020158560A | 10 |
| JP2020066721A | 10 |
How many inventions of other companies were rejected due to TBM patents?
The statistics below share strategic R&D insights. It tells the companies that were trying to protect inventions similar to TBM invention. They couldn’t because TBM had protected those before them.
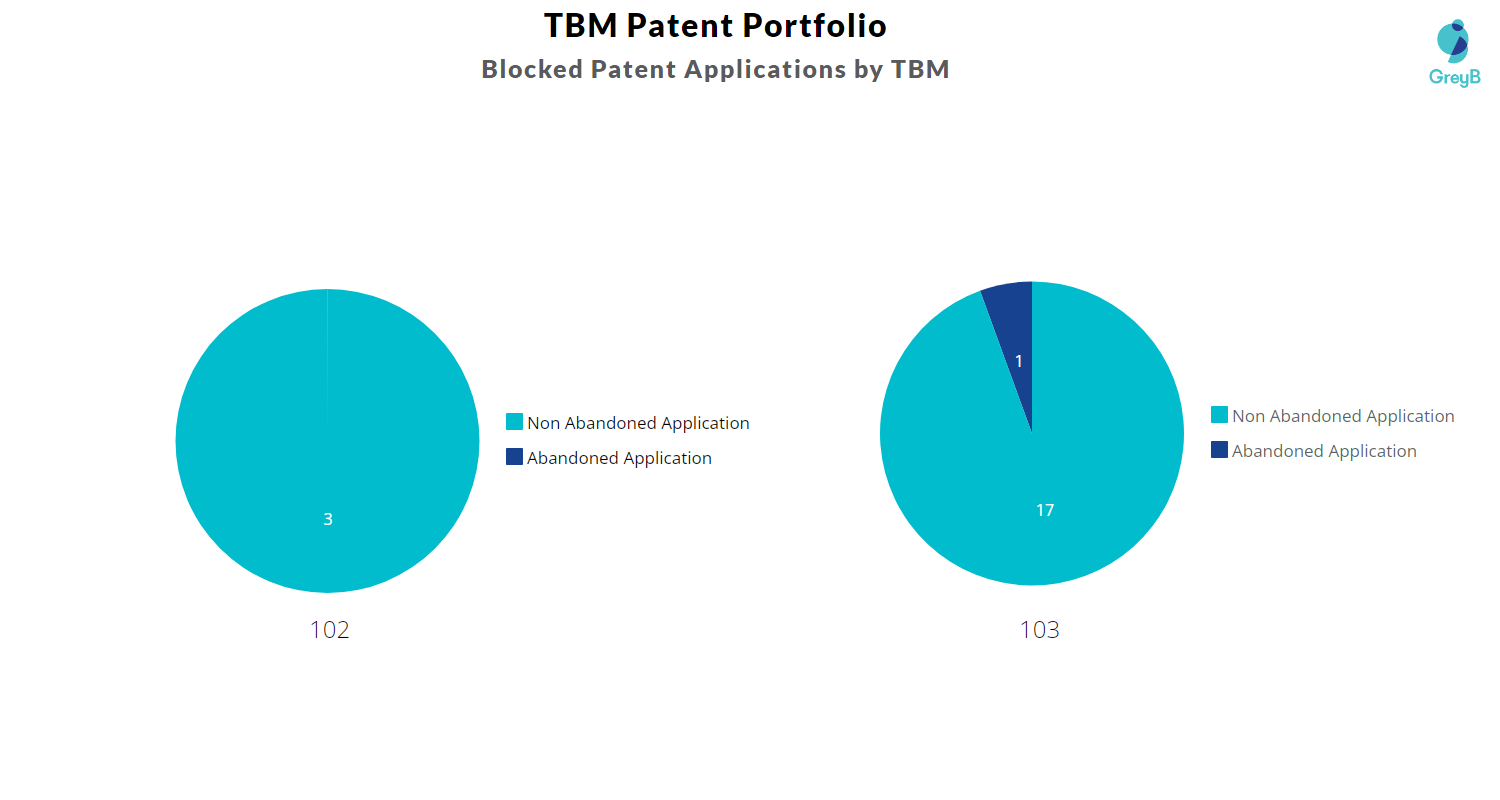
Examiners at the USPTO referred 4 TBM patents in 45 rejections (35 USC § 102 or 35 USC § 103 types).
The top citing companies in the TBM patent portfolio are Apple, Google and Amazon Technologies.
List of the Companies whose Patents were rejected citing TBM –
| Company | Number of Patent Applications that faced Rejection Citing TBM Patents | Number of Rejections (102 & 103) |
| Apple | 2 | 10 |
| 2 | 3 | |
| Amazon Technologies | 1 | 3 |
| Novamont | 1 | 2 |
| Microsoft Technology | 1 | 1 |
| Canon Finetech | 1 | 1 |
| Sensory Incorporated | 1 | 1 |
| Centurylink Intellectual Property | 1 | 3 |
| Medigram | 1 | 2 |
| Crexendo | 1 | 4 |
Count of 102 and 103 Type Rejections based on TBM Patents
Top TBM Patents used in Rejecting Most Patent Applications
| Patent Number | Count of Rejected Applications |
| US8131267B2 | 10 |
| US9008628B2 | 6 |
| US9290613B2 | 3 |
| US10669387B2 | 1 |
What Percentage of TBM US Patent Applications were Granted?
TBM (Excluding its subsidiaries) has filed 25 patent applications at USPTO so far (Excluding Design and PCT applications). Out of these 6 have been granted leading to a grant rate of 60.0%. Below are the key stats of TBM patent prosecution at the USPTO. 
Which Law Firms Filed Most US Patents for TBM?
| Law Firm | Total Applications | Success Rate |
| Cantor Colburn | 24 | 60.00% |
| Perilla Knox & Hildebrandt | 1 | 0% |
What are TBM key innovation segments?
What Technologies are Covered by TBM?
The chart below distributes patents filed by TBM in different countries on the basis of the technology protected in patents. It also represents the markets where TBM thinks it’s important to protect particular technology inventions.
R&D Focus: How has TBM search focus changed over the years?
EXCLUSIVE INSIGHTS COMING SOON!
Interested in knowing about the areas of innovation that are being protected by TBM?

