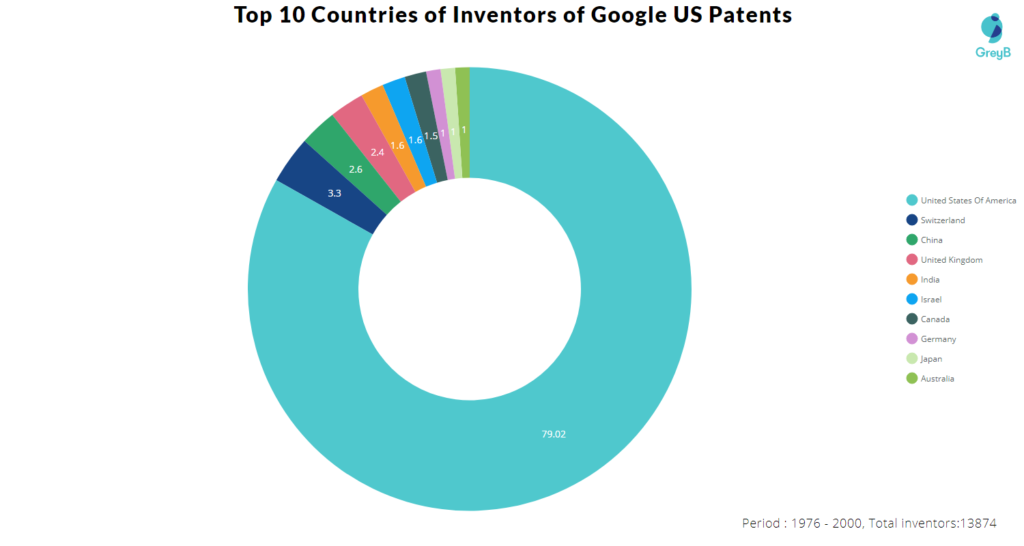
13874 inventors at Google filed 23574 US patents between 1976 and 2020. These Google inventors belong to 55 different countries.
The donut chart below shares the percentage contribution of inventors from the top ten countries in Google US patent filing.

Countries of Inventors of Google US Patents
| Country | Inventor | Patent | % of Inventors |
| United States Of America | 10963 | 72623 | 79.02 |
| Switzerland | 465 | 2071 | 3.35 |
| China | 366 | 2047 | 2.64 |
| United Kingdom | 336 | 1786 | 2.42 |
| India | 226 | 795 | 1.63 |
| Israel | 222 | 1117 | 1.60 |
| Canada | 215 | 1463 | 1.55 |
| Germany | 133 | 410 | 0.96 |
| Japan | 125 | 602 | 0.90 |
| Australia | 124 | 413 | 0.89 |
| Korea (South) | 89 | 1198 | 0.64 |
| France | 89 | 284 | 0.64 |
| Taiwan | 85 | 510 | 0.61 |
| Sweden | 69 | 245 | 0.50 |
| Poland | 44 | 139 | 0.32 |
| Italy | 44 | 76 | 0.32 |
| Ireland | 38 | 135 | 0.27 |
| Russian Federation | 35 | 81 | 0.25 |
| Brazil | 31 | 74 | 0.22 |
| Singapore | 23 | 77 | 0.17 |
| Denmark | 20 | 101 | 0.14 |
| Finland | 16 | 257 | 0.12 |
| Netherlands | 15 | 115 | 0.11 |
| Spain | 12 | 22 | 0.09 |
| New Zealand | 10 | 21 | 0.07 |
| Hong Kong (S.A.R.) | 7 | 35 | 0.05 |
| Norway | 7 | 20 | 0.05 |
| Belgium | 7 | 15 | 0.05 |
| Argentina | 6 | 9 | 0.04 |
| Austria | 5 | 12 | 0.04 |
| Iceland | 4 | 41 | 0.03 |
| Romania | 4 | 5 | 0.03 |
| Ukraine | 4 | 4 | 0.03 |
| Greece | 3 | 31 | 0.02 |
| Portugal | 3 | 5 | 0.02 |
| Malaysia | 3 | 3 | 0.02 |
| United Arab Emirates | 2 | 8 | 0.01 |
| Bulgaria | 2 | 6 | 0.01 |
| Slovakia | 2 | 4 | 0.01 |
| Mexico | 2 | 4 | 0.01 |
| Turkey | 2 | 3 | 0.01 |
| Colombia | 2 | 2 | 0.01 |
| Luxembourg | 1 | 15 | 0.01 |
| Egypt | 1 | 6 | 0.01 |
| South Africa | 1 | 4 | 0.01 |
| Iran | 1 | 4 | 0.01 |
| Belize | 1 | 2 | 0.01 |
| Peru | 1 | 2 | 0.01 |
| Hungary | 1 | 1 | 0.01 |
| Senegal | 1 | 1 | 0.01 |
| Czech Republic | 1 | 1 | 0.01 |
| Chile | 1 | 1 | 0.01 |
| Togo | 1 | 1 | 0.01 |
| Qatar | 1 | 1 | 0.01 |
| Thailand | 1 | 1 | 0.01 |
