A total of approximately 7.3 Lakh patents were published in the US in the year 2024 (01 January 2024 – 31 December 2024) out of which around 3.51 Lakh patents were granted, according to findings by Insights;Gate.
Click here to know about the US Patent Trend & Stats in 2022
Click here to know about the US Patent Trend & Stats in 2023
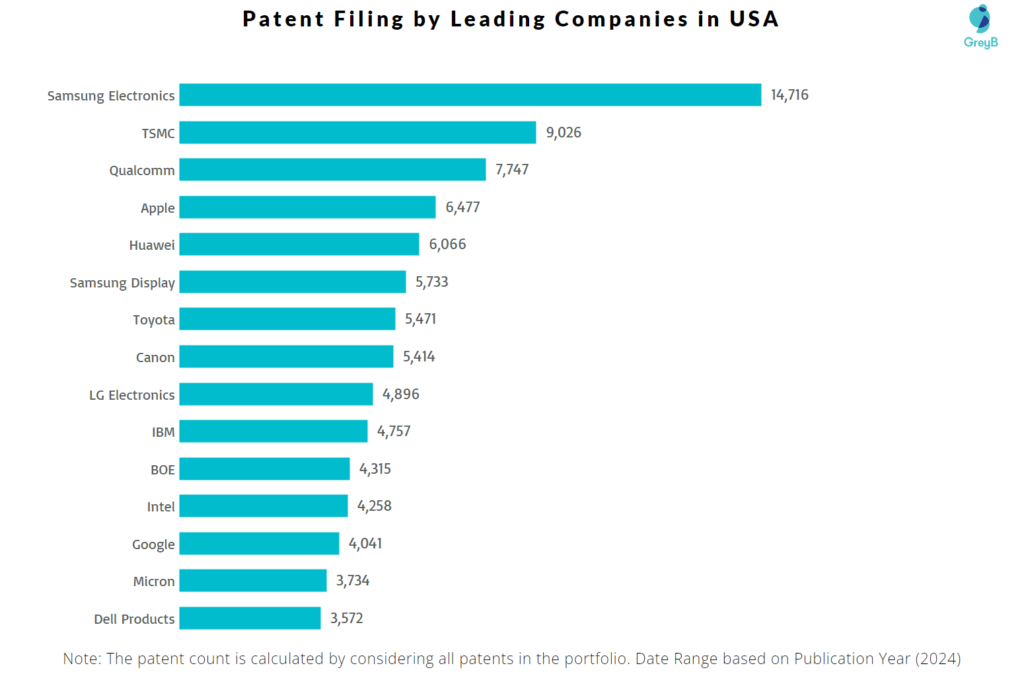
Leading the way is Samsung Electronics with 14,716 US published patents in 2024. Taiwan Semiconductor Manufacturing Company (TSMC) was 2nd, at 9026.
Other top 10 U.S. patentees include: Qualcomm, Apple and Huawei among others.
On a country-by-country basis, U.S. companies filed the most patents, followed by companies based in Japan, China, and South Korea.
How Many Patents were Published and Granted in the US Every Month in 2024?
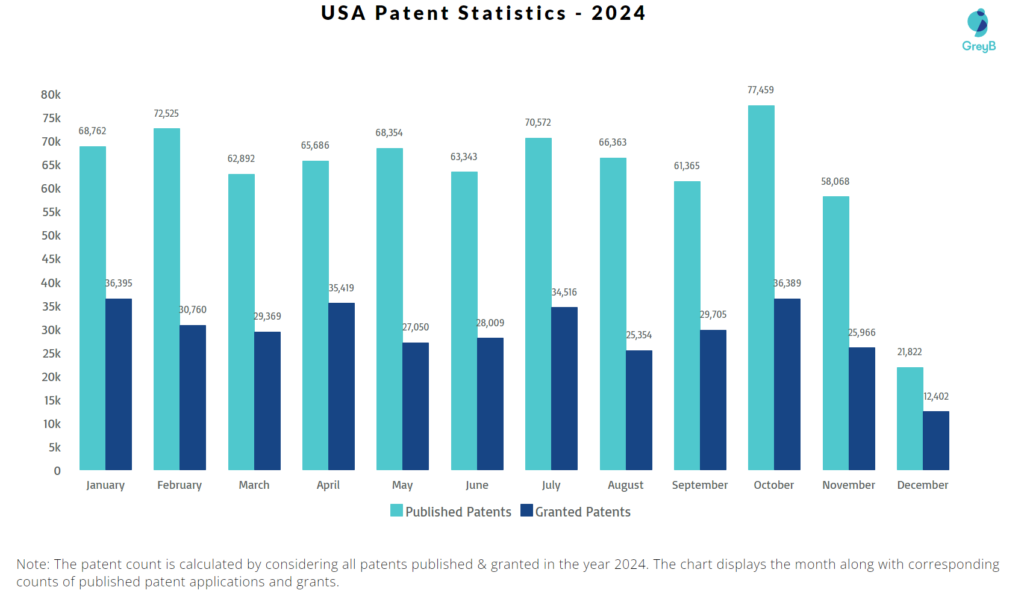
We’re examining total published patent application records for comparison because the publication timeline of up to 18 months can cause confusion when solely considering the patent count of the most recent year.
| Month | Published Patent Count | Granted Patent Count |
| January | 68762 | 36395 |
| February | 72525 | 30760 |
| March | 62892 | 29369 |
| April | 65686 | 35419 |
| May | 68354 | 27050 |
| June | 63343 | 28009 |
| July | 70572 | 34516 |
| August | 66363 | 25354 |
| September | 61365 | 29705 |
| October | 77459 | 36389 |
| November | 58068 | 25966 |
| December | 21822 | 12402 |
Which countries contribute the most to innovations in the US?
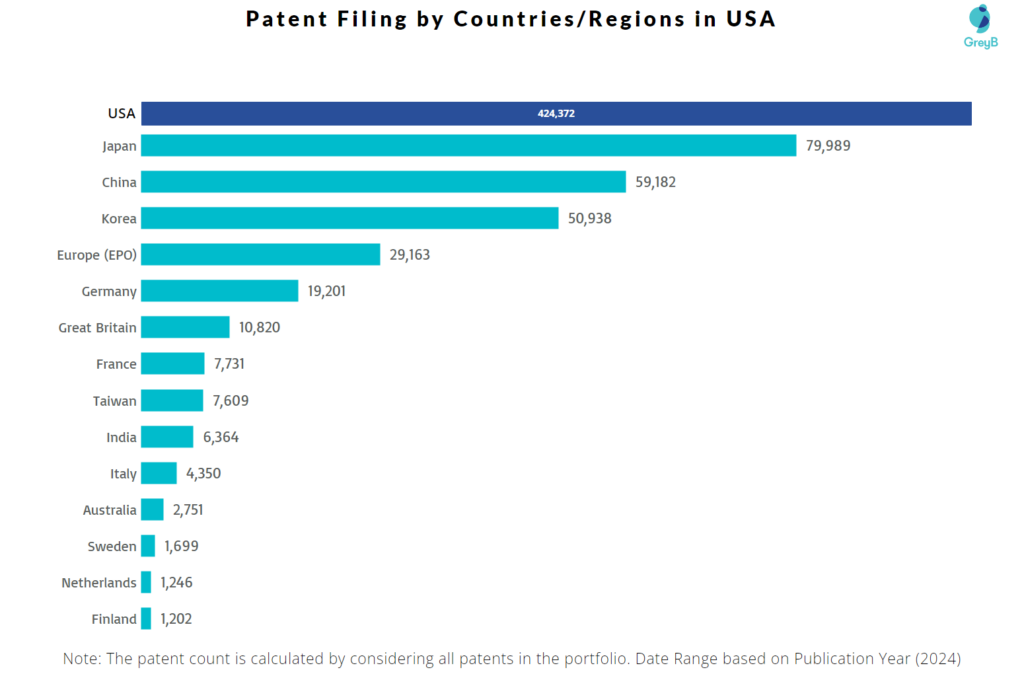
This chart talks about the primary sources or locations where a significant number of innovations in the United States originate. It’s inquiring about the main regions responsible for generating the most innovations within the country.
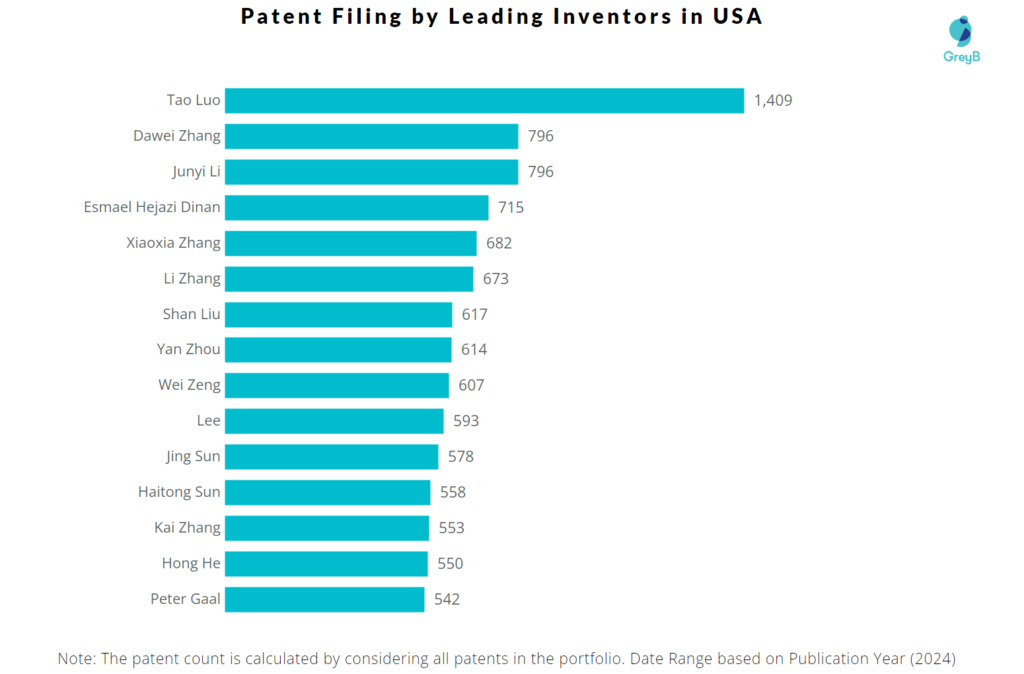
Top patent filers and innovators in the US in 2024
Top Companies
Top Inventors
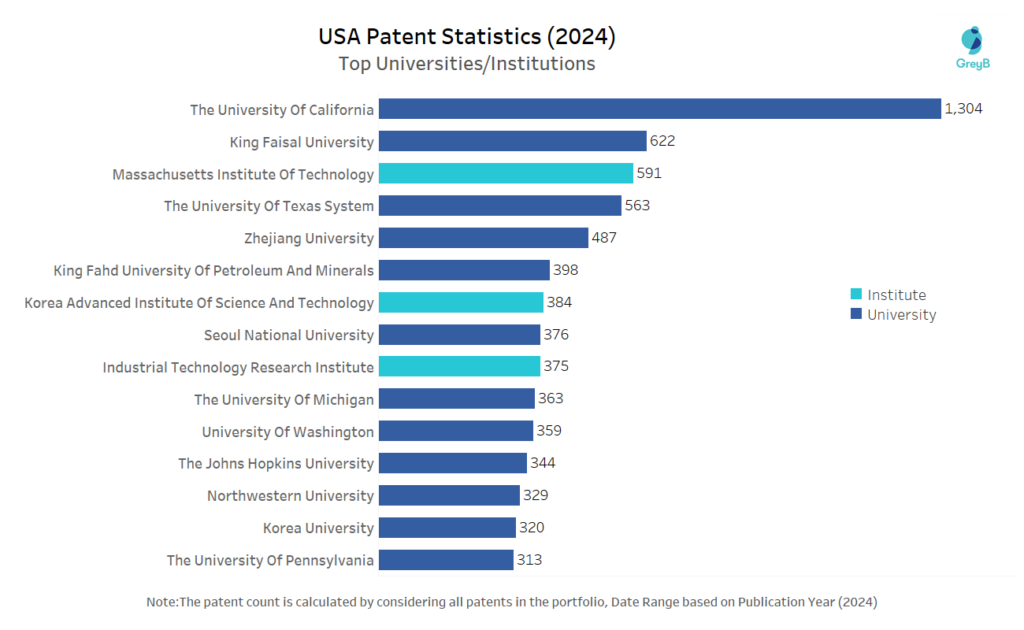
Top Universities/Institutions
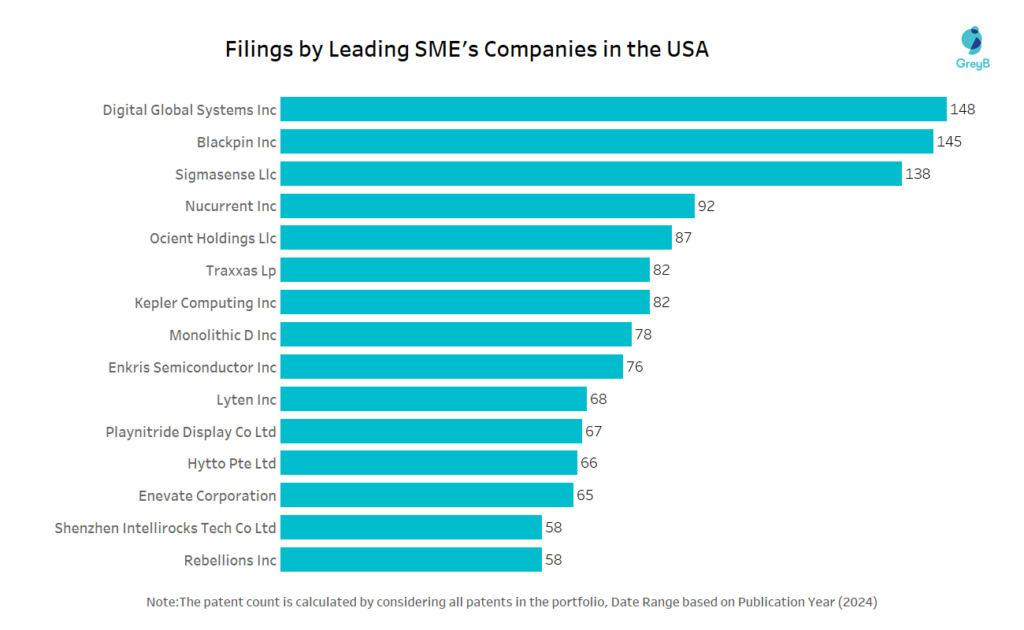
Leading SME’s Companies in the USA
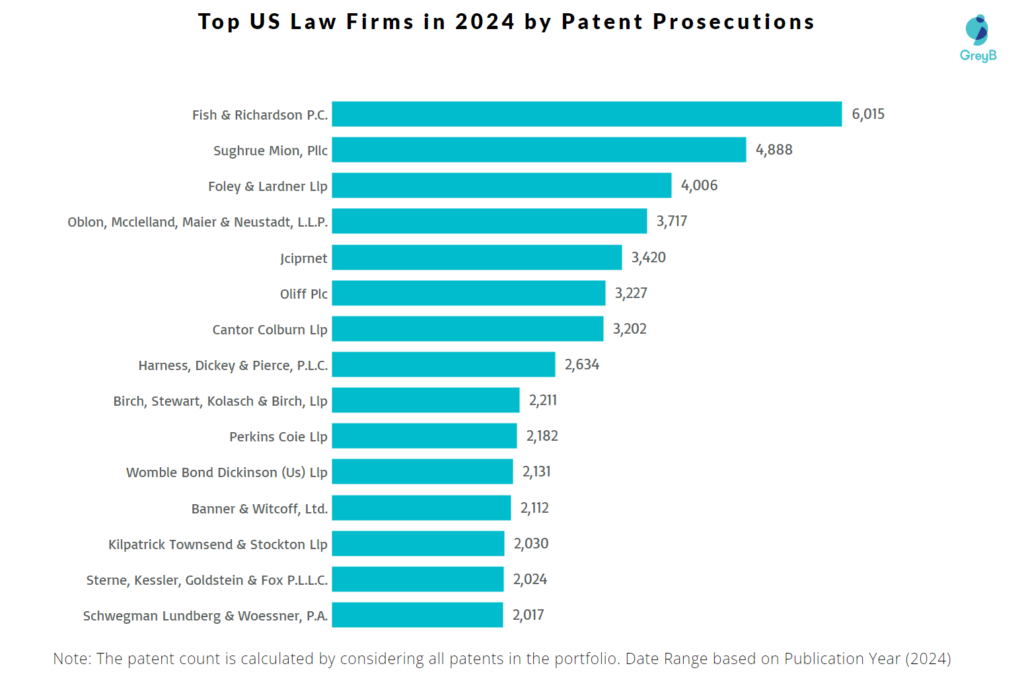
Law firms with the most patent prosecutions in the US in 2024
Key Female Inventors from the USA
| Inventors | Patents | Associated Company |
| Xiaoxia Zhang | 539 | Qualcomm |
| Jelena Damnjanovic | 185 | Qualcomm |
| Jing Lei | 104 | Qualcomm |
| Marta Karczewicz | 101 | Qualcomm |
| Molly Anderson | 63 | Apple |
| Janet A Stern-Berkowitz | 62 | InterDigital |
| Celia Nicole Mourkogiannis | 50 | Snap |
| Amrita Mathuriya | 48 | Kepler Computing/ Stealth Startup |
| Diana Maamari | 47 | Qualcomm |
| Elena Alshina | 45 | Huawei |
| Lin Ni Lisa Cheng | 43 | JPMorgan Chase |
| Junli Wang | 43 | IBM |
| Sorour Falahati | 43 | Ericsson |
| Johanna M Swan | 42 | Intel |
| Shawna M Liff | 41 | Intel |
| Catalina Mihaela Mladin | 40 | Convida Wireless/ InterDigital |
| Fatma Arzum Simsek-Ege | 39 | Micron Technology |
| Christie Marie Heikkinen | 37 | Snap |
| Olufunmilola Omolade Awoniyi-Oteri | 36 | Qualcomm |
| Clara Geneviève Marine Courtaigne | 35 | Siblings/ Apple |
| Lakshmi R Iyer | 33 | Apple |
| Reshma Lal | 33 | Advanced Micro Devices |
| Nazanin Rastegardoost | 32 | Ofinno Technologies |
| Jean Luo | 32 | SISTERS |
| Lopamudra Kundu | 23 | O-Ran Alliance/ Nvidia |
Top technology-focused area of published patents in 2024
Top 10 Technology Areas covered in US for the year 2024 include:
- Display device
- Electrode
- Semiconductor
- Battery cell
- Electrical battery
- Si substrate
- Hemt circuits
- Electrically conductive
- Electronic equipment
- Server
Top 10 Application Areas covered by patents filed in US in the year 2024 is:
- Electric digital data processing
- Digital transmission
- Semiconductor devices
- Computer peripheral equipment
- Image data processing
- Pharmaceutical active ingredients
- Computing models
- Solid-state devices
- Data processing applications
- Scientific instruments

