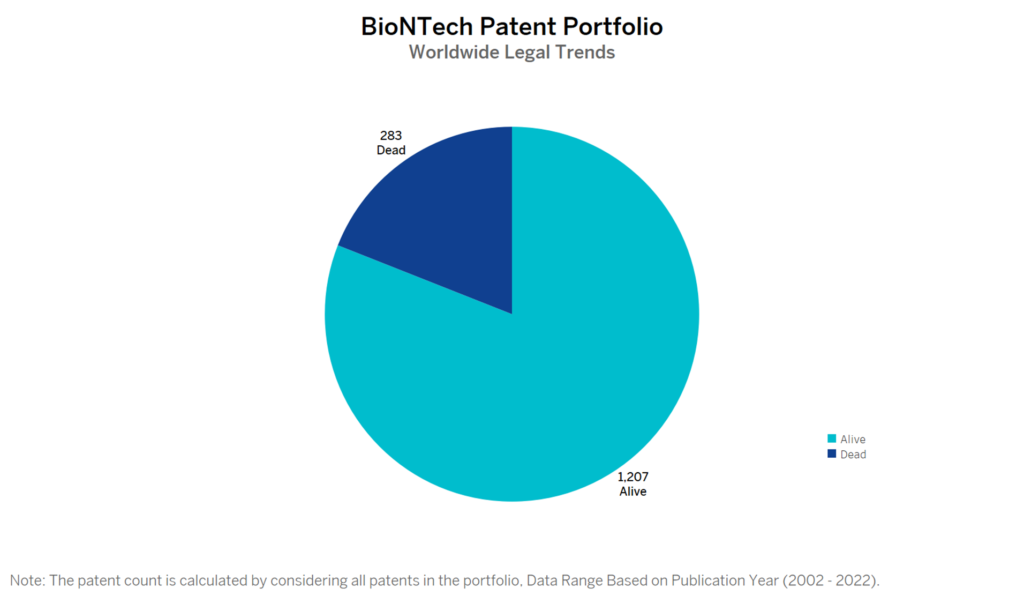
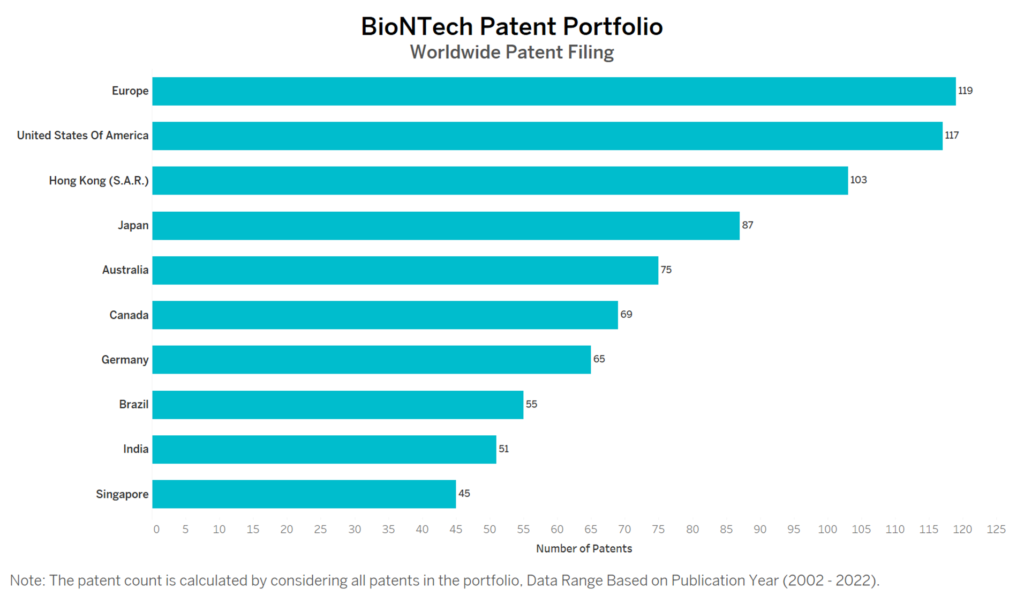
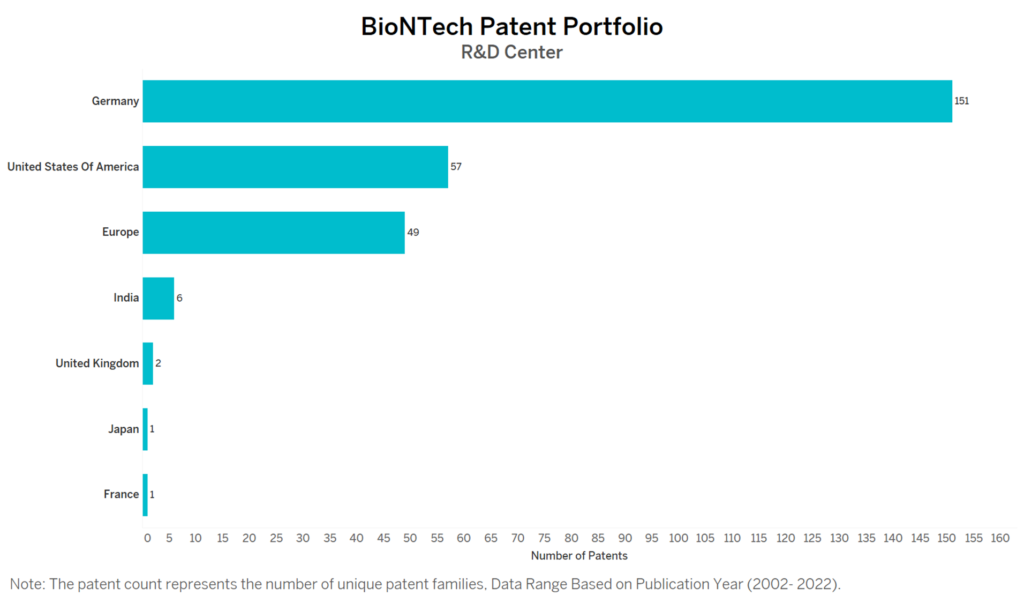
BioNTech has a total of 1490 patents globally, out of which 605 have been granted. Of these 1490 patents, more than 81% patents are active. European Countries is where BioNTech has filed the maximum number of patents, followed by the United States of America and Hong Kong, it has generated an annual revenue of $22.45 billion in the year 2021. Parallelly, China seems to be the main focused R&D centre of BioNTech.
BioNTech was founded in the year 2008 by Uğur Şahin, Christoph Huber and Özlem Türeci. The firm is a Mainz-based German biotechnology company that develops and manufactures active immunotherapies for patient-specific illness treatment. As of May 2022, BioNTech has a market cap of $39.82 Billion.
Do read about some of the most popular patents of BioNTech which have been covered by us in this article and also you can find BioNTech patents information, the worldwide patent filing activity and its patent filing trend over the years, and many other stats over BioNTech patent portfolio.
How many patents does BioNTech have?
BioNTech has a total of 1490 patents globally. These patents belong to 267 unique patent families. Out of 1490 patents, 1207 patents are active.
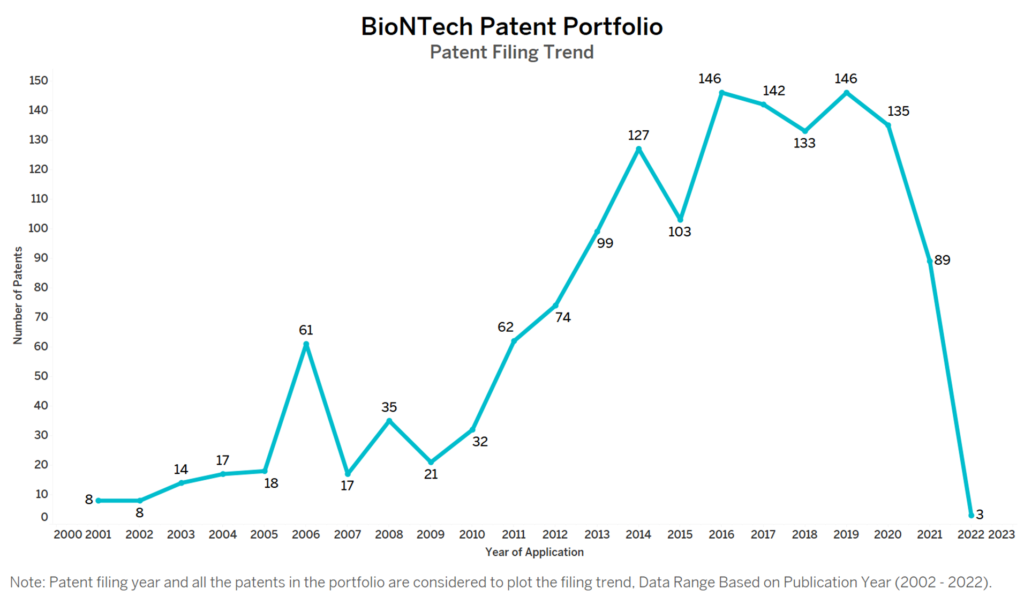
How Many Patents did BioNTech File Every Year?

Are you wondering why there is a drop in patent filing for the last two years? It is because a patent application can take up to 18 months to get published. Certainly, it doesn’t suggest a decrease in the patent filing.
| Year of Patents Filing or Grant | BioNTech Applications Filed | BioNTech Patents Granted |
| 2011 | 62 | 15 |
| 2012 | 74 | 19 |
| 2013 | 99 | 30 |
| 2014 | 127 | 27 |
| 2015 | 103 | 57 |
| 2016 | 146 | 36 |
| 2017 | 142 | 57 |
| 2018 | 133 | 48 |
| 2019 | 146 | 84 |
| 2020 | 135 | 80 |
| 2021 | 89 | 109 |
| 2022 | 3 | 23 |
How many BioNTech patents are Alive/Dead?

How Many Patents did BioNTech File in Different Countries?

Countries in which BioNTech Filed Patents
| Country | Patents |
| Europe | 119 |
| United States Of America | 117 |
| Hong Kong (S.A.R.) | 103 |
| Japan | 87 |
| Australia | 75 |
| Canada | 69 |
| Germany | 65 |
| Brazil | 55 |
| India | 51 |
| Singapore | 45 |
| Mexico | 41 |
| Spain | 39 |
| Korea (South) | 33 |
| Israel | 32 |
| Russia | 31 |
| China | 31 |
| Portugal | 29 |
| Denmark | 29 |
| New Zealand | 28 |
| Slovenia | 27 |
| Poland | 26 |
| Taiwan | 18 |
| Argentina | 18 |
| Hungary | 17 |
| Croatia | 16 |
| Serbia | 15 |
| South Africa | 14 |
| Albania | 13 |
| Lithuania | 11 |
| Cyprus | 8 |
| Malaysia | 6 |
| Viet Nam | 5 |
| Philippines | 5 |
| Montenegro | 5 |
| Turkey | 4 |
| Eurasia | 4 |
| Uruguay | 3 |
| Former Yugoslav Republic of Macedonia | 3 |
| Indonesia | 3 |
| United Kingdom | 2 |
| Cuba | 2 |
| Bolivia | 2 |
| Colombia | 1 |
| Ukraine | 1 |
| Peru | 1 |
| Pakistan | 1 |
| Morocco | 1 |
| Republic of Moldova | 1 |
| Chile | 1 |
| Norway | 1 |
| Costa Rica | 1 |
| Austria | 1 |
| Macao | 1 |
Where are Research Centres of BioNTech Patents Located?

10 Best BioNTech Patents
US20110065103A1 is the most popular patent in the BioNTech portfolio. It has received 175 citations so far from companies like Moderna, Factor Bioscience, and Cellscript.
Below is the list of 10 most cited patents of BioNTech:
| Publication Number | Citation Count |
| US20110065103A1 | 175 |
| WO2008098796A1 | 167 |
| WO2013143555A1 | 136 |
| WO2011015347A1 | 136 |
| EP2314308A1 | 114 |
| US7371404B2 | 113 |
| WO2012038055A1 | 110 |
| EP2072618A1 | 103 |
| WO2014071963A1 | 99 |
| WO2013087083A1 | 93 |
EXCLUSIVE INSIGHTS COMING SOON!
What are BioNTech’s key innovation segments?
