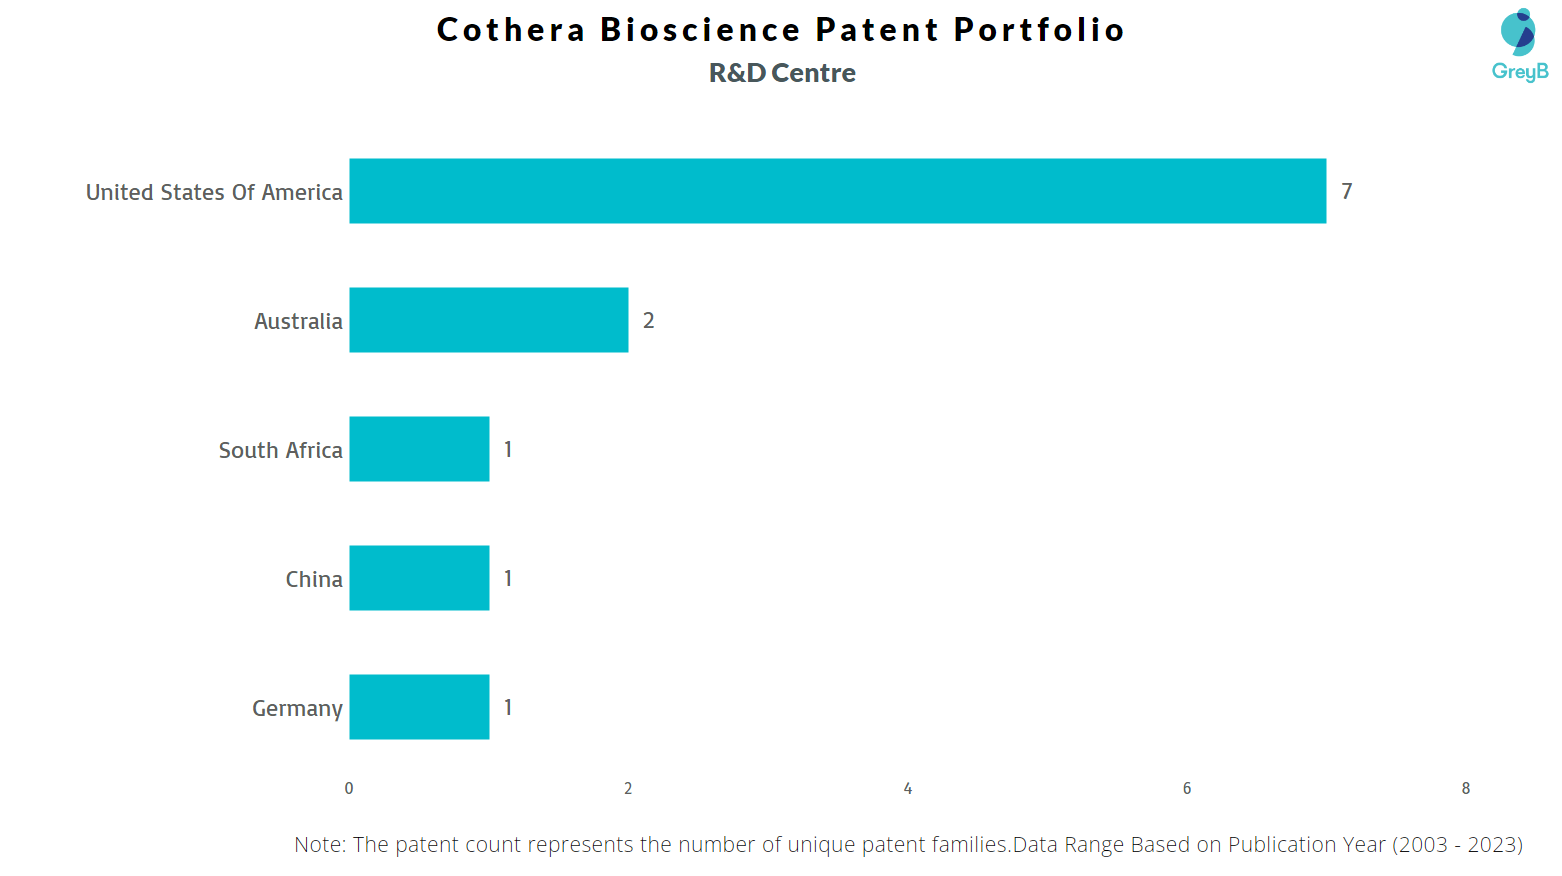
Cothera Bioscience has a total of 66 patents globally, out of which 12 have been granted. Of these 66 patents, more than 77% patents are active. The United States of America is where Cothera Bioscience has filed the maximum number of patents, followed by Europe and Australia. Parallelly, United States of America seems to be the main focused R&D centre and also China is the origin country of Cothera Bioscience.
Cothera Bioscience was founded in 2018. Calithera Biosciences manufactures pharmaceuticals. For the treatment of cancer, the company is committed to finding and creating new small molecule medications that target tumour metabolism and immunology.
Do read about some of the most popular patents of Cothera Bioscience which have been covered by us in this article and also you can find Cothera Bioscience patents information, the worldwide patent filing activity and its patent filing trend over the years, and many other stats over Cothera Bioscience patent portfolio.
How many patents does Cothera Bioscience have?
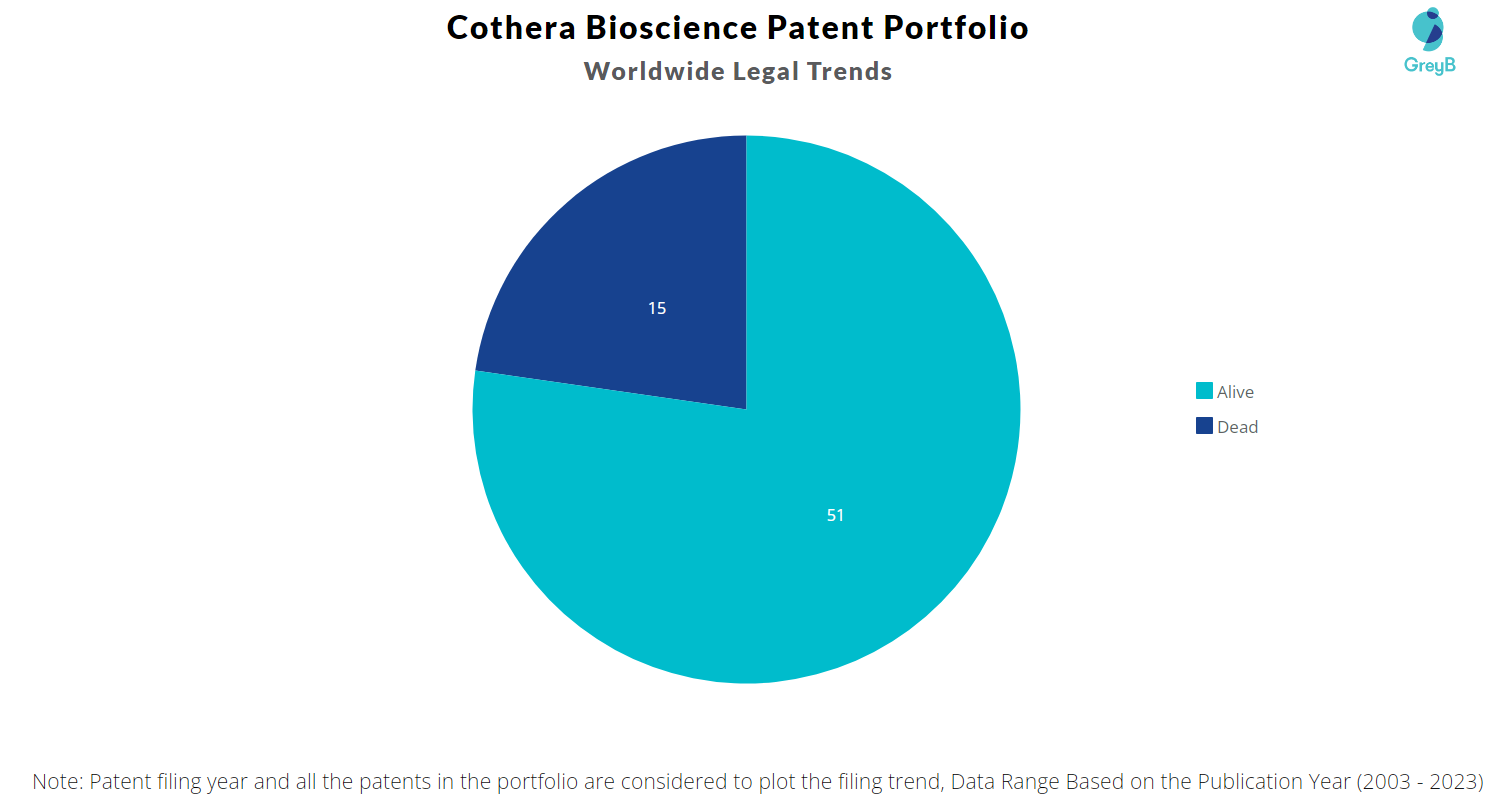
Cothera Bioscience has a total of 66 patents globally. These patents belong to 12 unique patent families. Out of 66 patents, 51 patents are active.
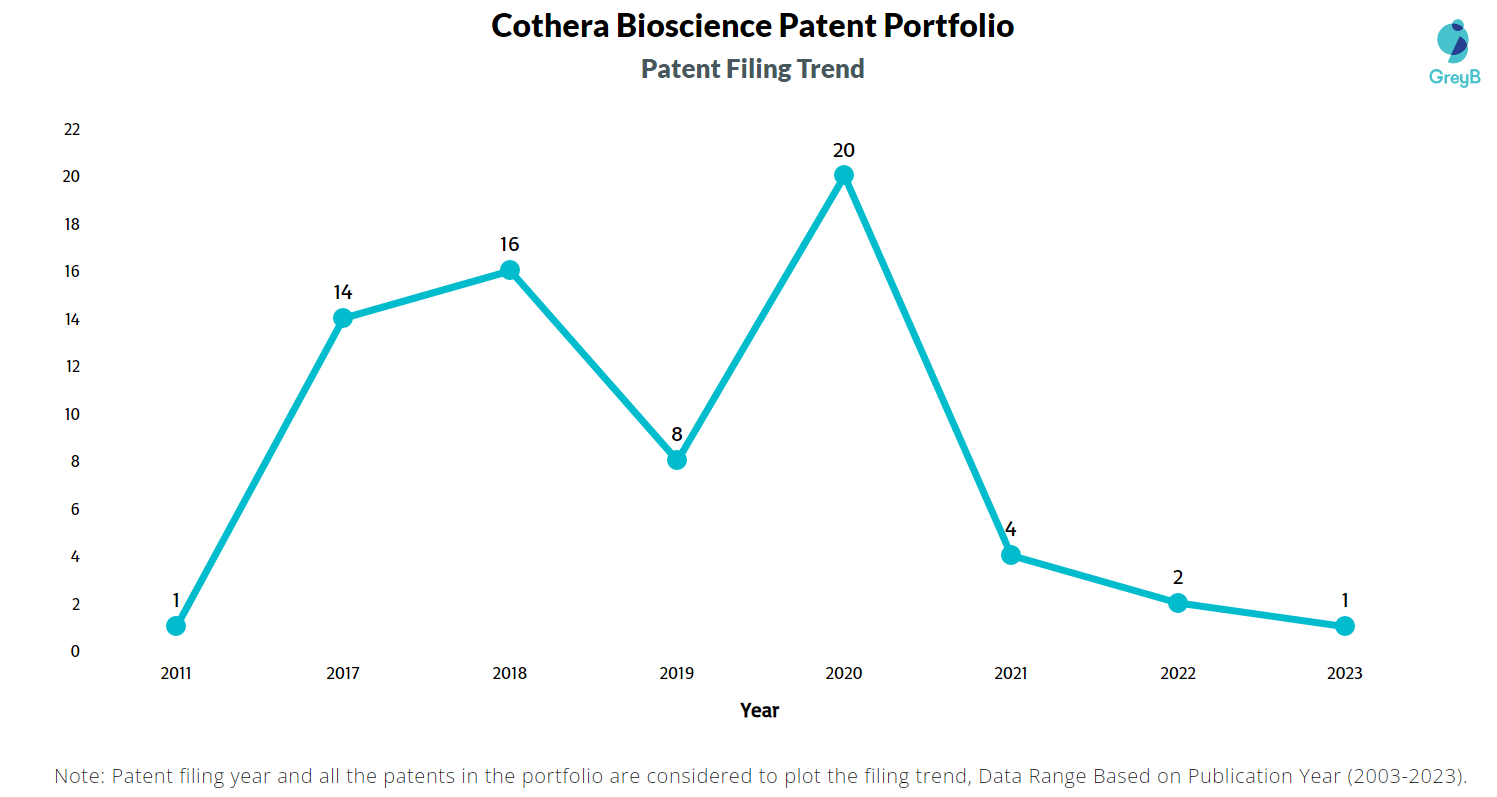
How Many Patents did Cothera Bioscience File Every Year?
Are you wondering why there is a drop in patent filing for the last two years? It is because a patent application can take up to 18 months to get published. Certainly, it doesn’t suggest a decrease in the patent filing.
Year of Patents Filing or Grant
Cothera Bioscience Applications Filed
Cothera Bioscience Patents Granted
2023
1
3
2022
2
5
2021
4
2
2020
20
1
2019
8
–
2018
16
–
2017
14
–
2015
–
1
2011
1
–
How many Cothera Bioscience patents are Alive/Dead?
Worldwide Patents
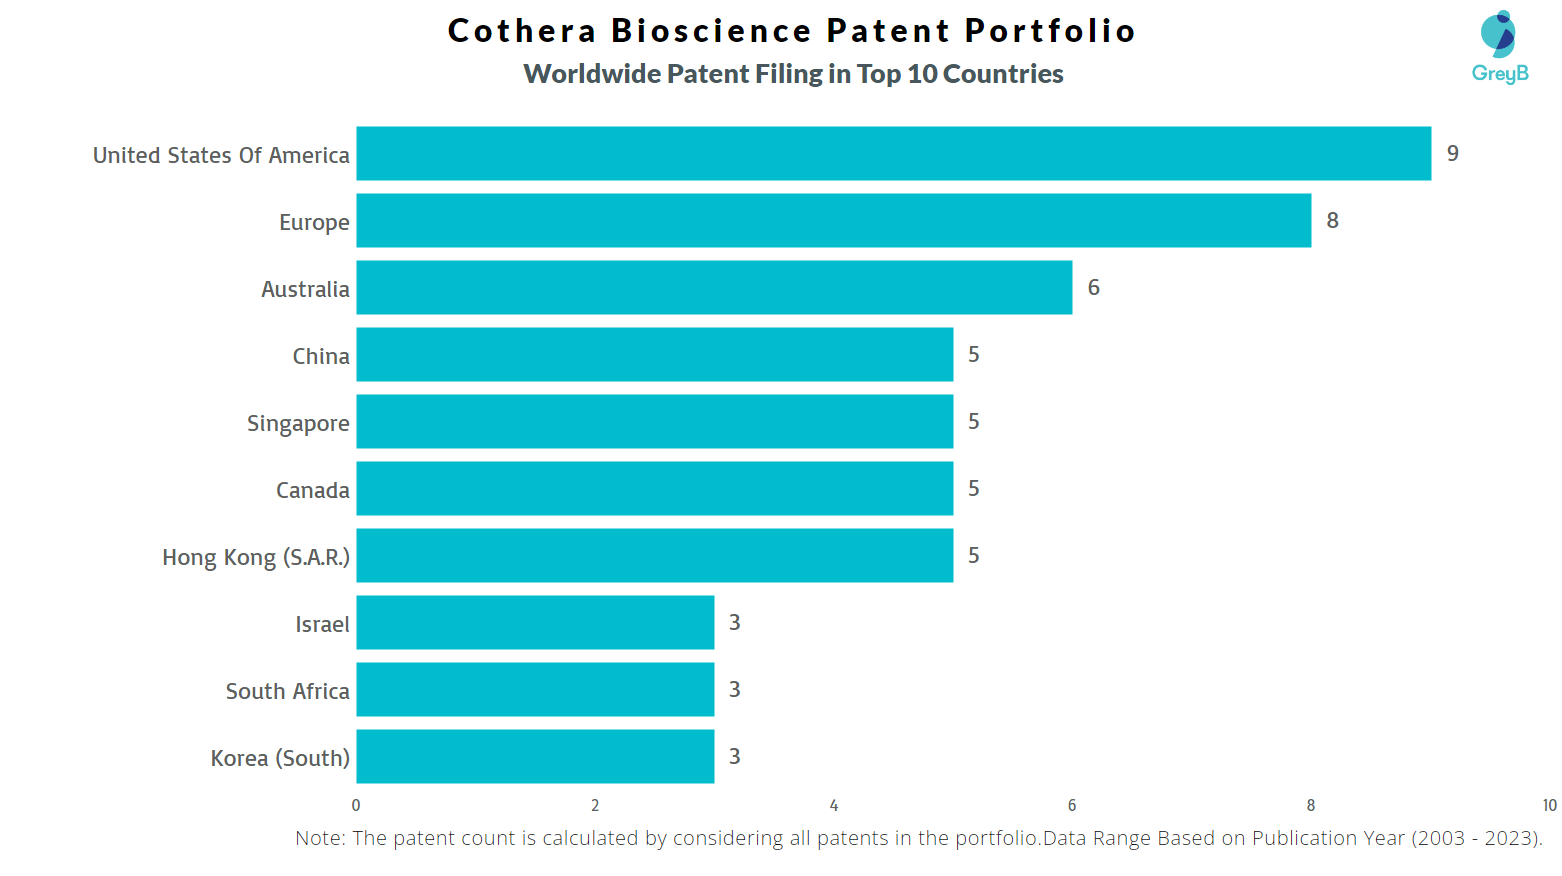
How Many Patents did Cothera Bioscience File in Different Countries?
Countries in which Cothera Bioscience Filed Patents
Country
Patent
United States Of America
9
Europe
8
Australia
6
China
5
Singapore
5
Canada
5
Hong Kong (S.A.R.)
5
Israel
3
South Africa
3
Korea (South)
3
India
1
Taiwan
1
Germany
1
Austria
1
Brazil
1
Spain
1
Russia
1
New Zealand
1
Where are Research Centers of Cothera Bioscience Patents Located?
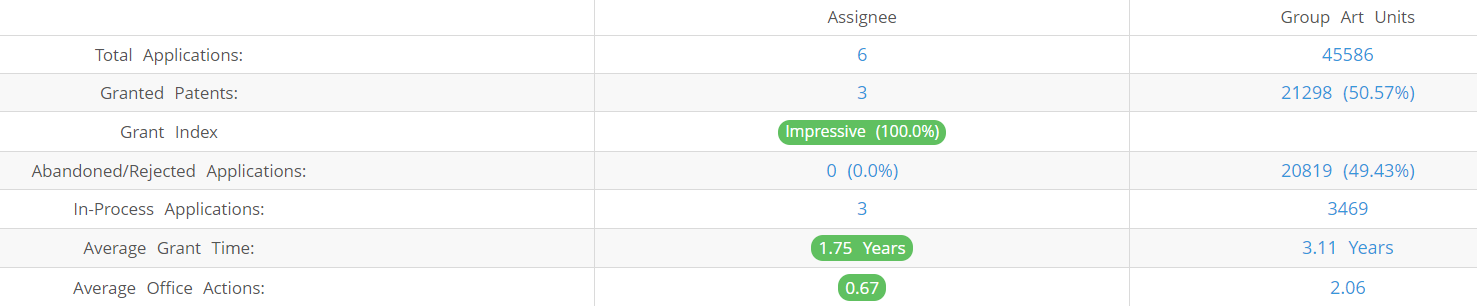
What Percentage of Cothera Bioscience US Patent Applications Were Granted?
Cothera Bioscience (Excluding its subsidiaries) has filed 6 patent applications at USPTO so far (Excluding Design and PCT applications). Out of these 3 have been granted leading to a grant rate of 100%.
Below are the key stats of Cothera Bioscience patent prosecution at the USPTO.
Which Law Firms Filed Most US Patents for Cothera Bioscience?
Law Firm
Total Applications
Success Rate
Sterne Kessler Goldstein & Fox
3
100.00%
Baker Botts Llp
1
100.00%
Morrison & Foerster Llp
1
0%
Wilson Sonsini Goodrich & Rosati
1
100.00%
What are Cothera Bioscience key innovation segments?
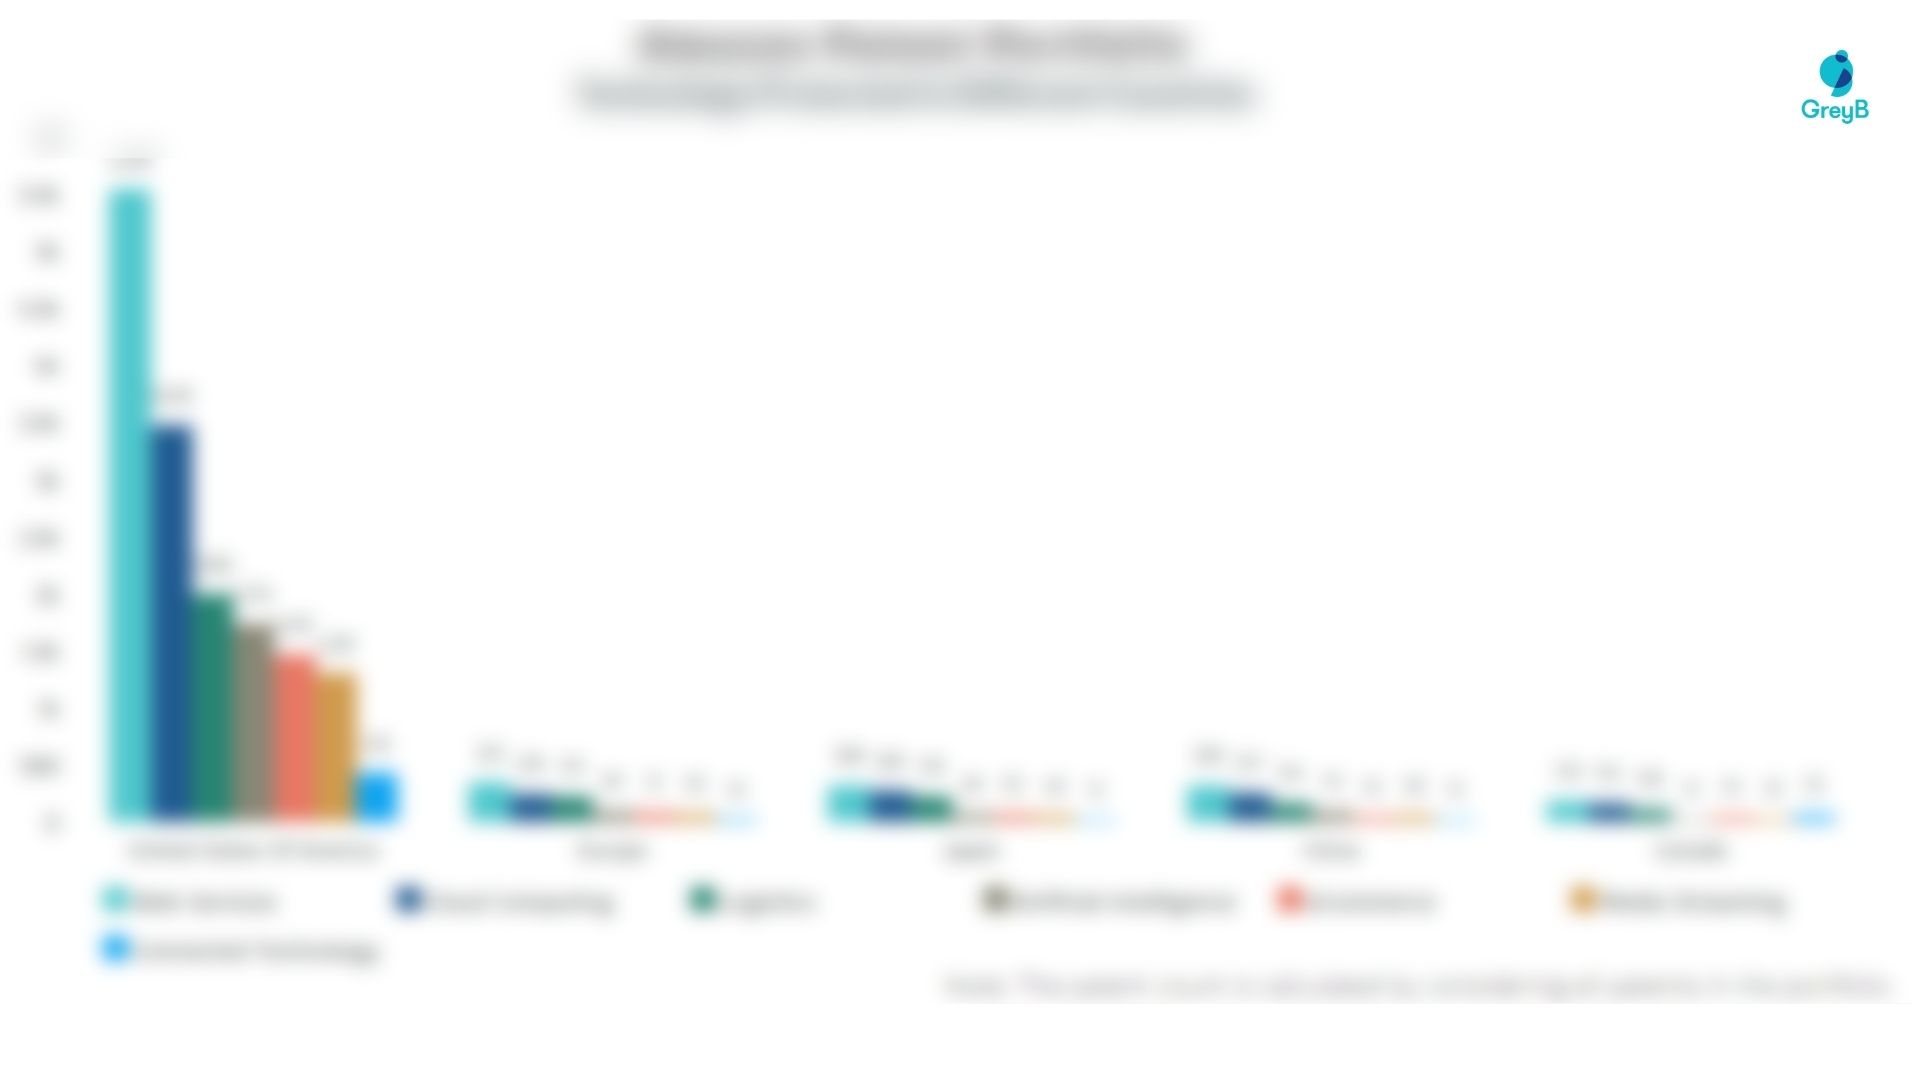
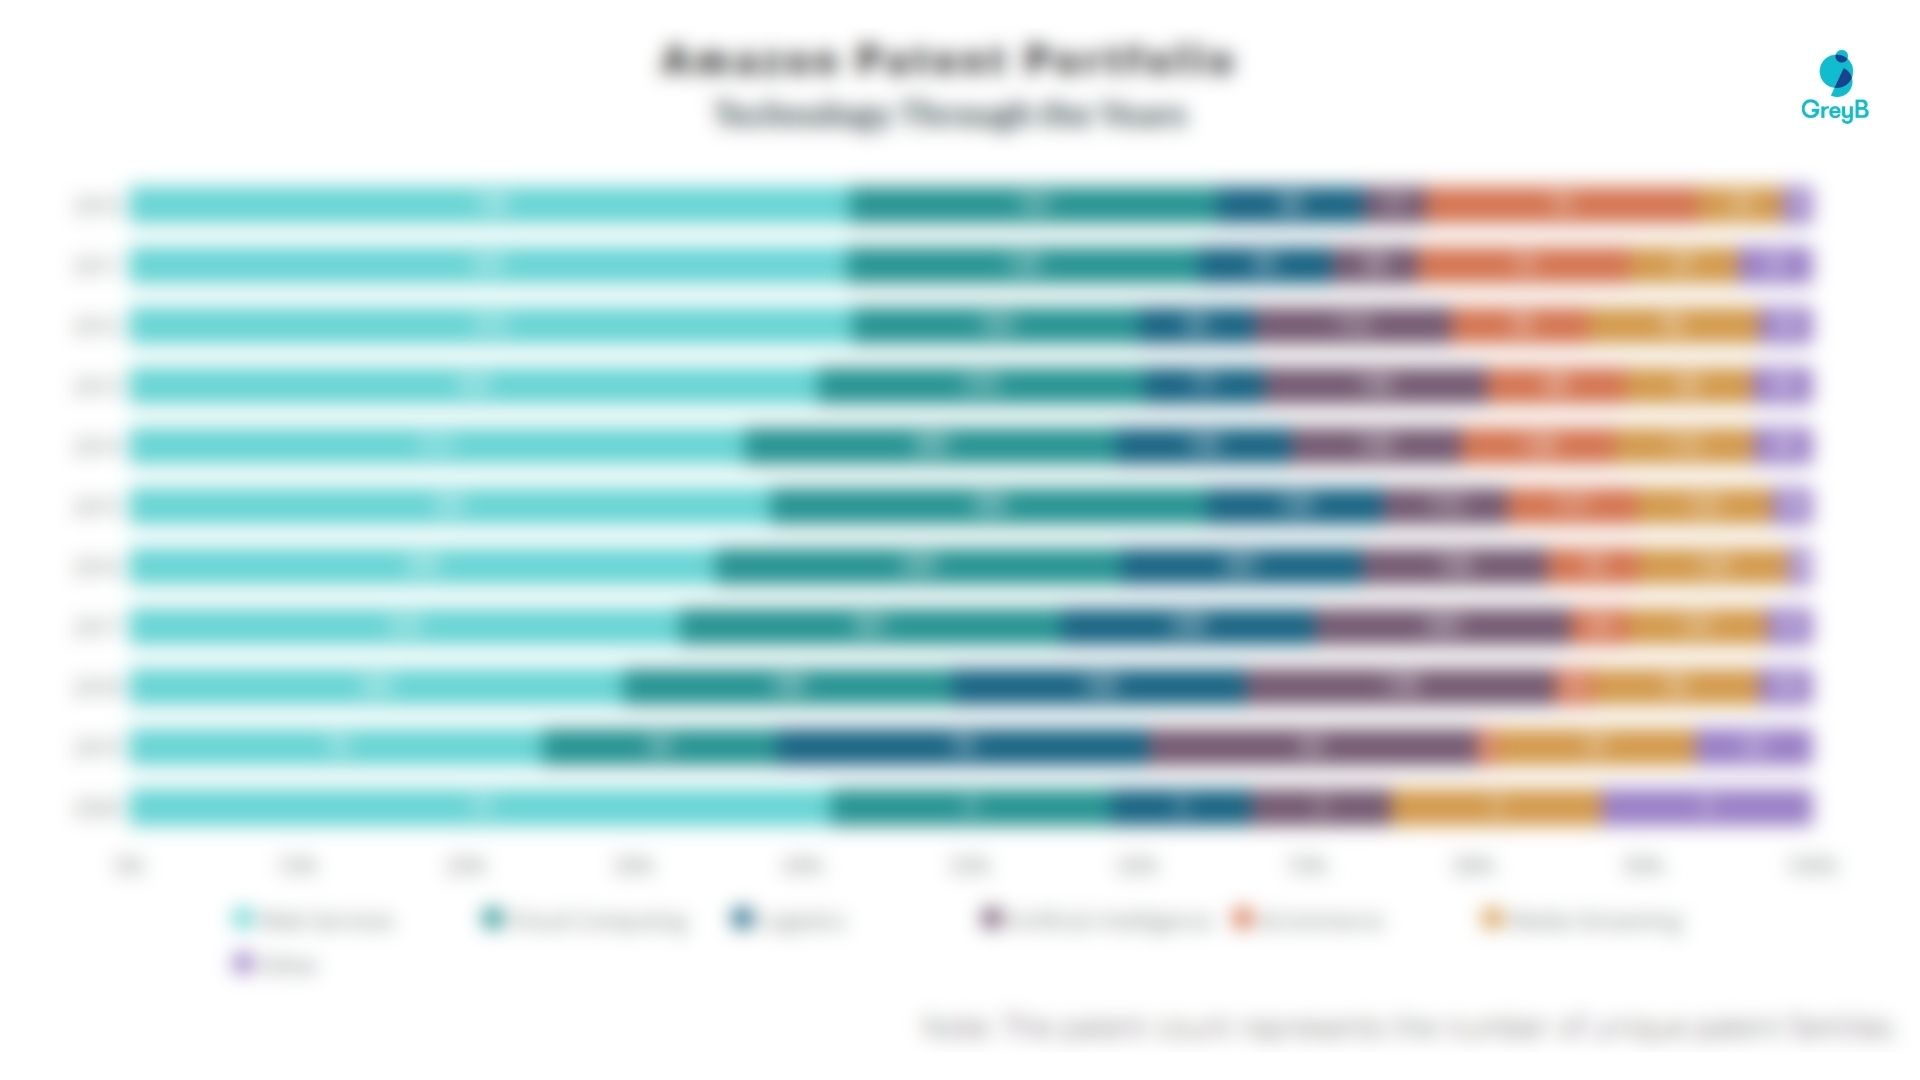
What Technologies are Covered by Cothera Bioscience?
The chart below distributes patents filed by Cothera Bioscience in different countries on the basis of the technology protected in patents. It also represents the markets where Cothera Bioscience thinks it’s important to protect particular technology inventions.
R&D Focus: How has Cothera Bioscience search focus changed over the years?
EXCLUSIVE INSIGHTS COMING SOON!
Interested in knowing about the areas of innovation that are being protected by Cothera Bioscience ?
Visionnav Robotics has a total of 363 patents globally, out of which 227 have been granted. Of these 363 patents, 96% patents are active. China is where Visionnav Robotics has…
Nanofiber Quantum Technologies has a total of 14 patents globally, out of which 2 have been granted. Of these 14 patents, all the patents are active. The United States of…
Figure AI has a total of 59 patents globally, out of which 19 have been granted. Of these 59 patents, all the patents are active. The United States of America…
 Are you wondering why there is a drop in patent filing for the last two years? It is because a patent application can take up to 18 months to get published. Certainly, it doesn’t suggest a decrease in the patent filing.