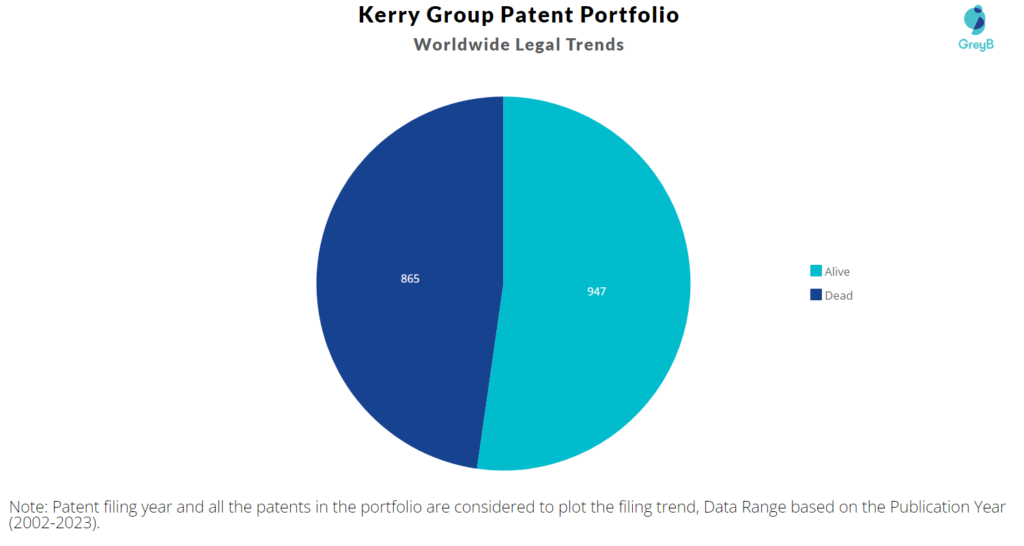
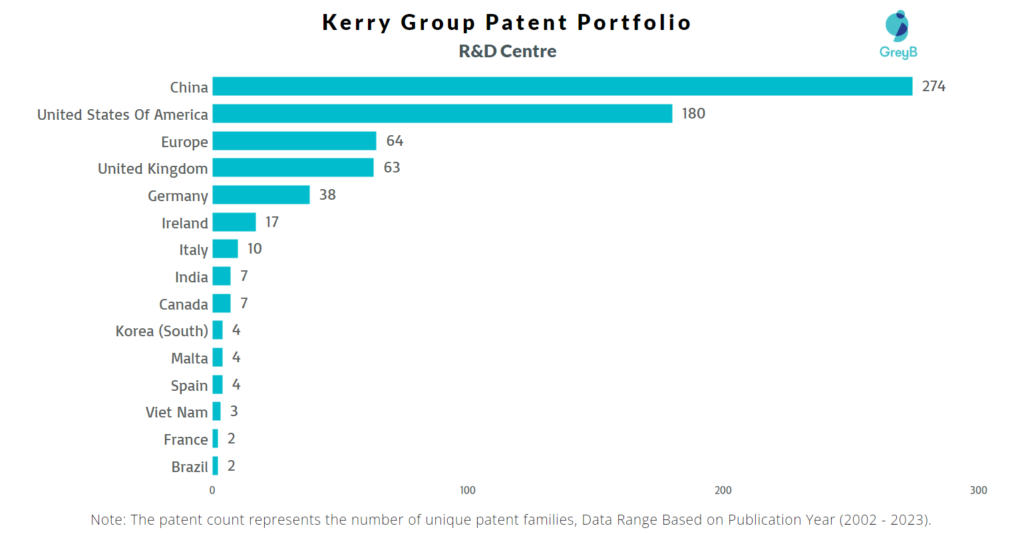
Kerry Group has a total of 1812 patents globally, out of which 871 have been granted. Of these 1812 patents, more than 52% patents are active. China is where Kerry Group has filed the maximum number of patents, followed by United States of America and European Countries, it has generated an annual revenue of $8.69 billion in the year 2021. Parallelly, China seems to be the main focused R&D centre of Kerry Group.
Kerry Group was founded in the year 1972. Company is a public food company headquartered in Ireland. As of February 2023, Kerry Group has a market cap of $16.98 Billion.
Do read about some of the most popular patents of Kerry Group which have been covered by us in this article and also you can find Kerry Group patents information, the worldwide patent filing activity and its patent filing trend over the years, and many other stats over Kerry Group patent portfolio.
How many patents does the CEO of Kerry Group have?
The CEO, Edmond Scanlon, has 0 patents.
How many patents does Kerry Group have?
Kerry Group has a total of 1812 patents globally. These patents belong to 700 unique patent families. Out of 1812 patents, 947 patents are active.

Get Ahead in the Future of Food Innovation
Read The ReportHow Many Patents did Kerry Group File Every Year?
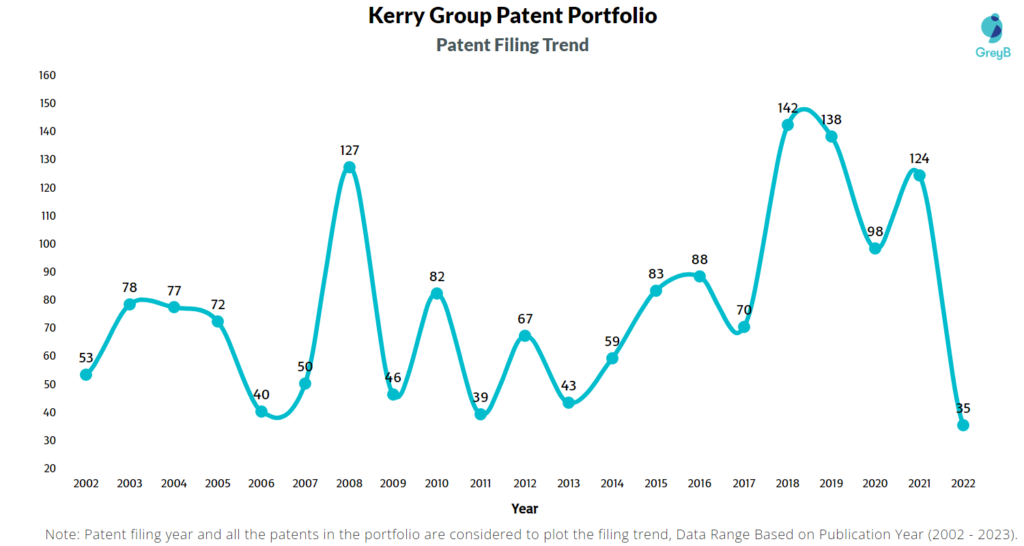
Are you wondering why there is a drop in patent filing for the last two years? It is because a patent application can take up to 18 months to get published. Certainly, it doesn’t suggest a decrease in the patent filing.
| Year of Patents Filing or Grant | Kerry Group Applications Filed | Kerry Group Patents Granted |
| 2022 | 35 | 56 |
| 2021 | 124 | 102 |
| 2020 | 98 | 66 |
| 2019 | 138 | 57 |
| 2018 | 142 | 45 |
| 2017 | 70 | 57 |
| 2016 | 88 | 39 |
| 2015 | 83 | 37 |
| 2014 | 59 | 43 |
| 2013 | 43 | 57 |
| 2012 | 67 | 34 |
| 2011 | 39 | 23 |
How many Kerry Group patents are Alive/Dead?
How Many Patents did Kerry Group File in Different Countries?
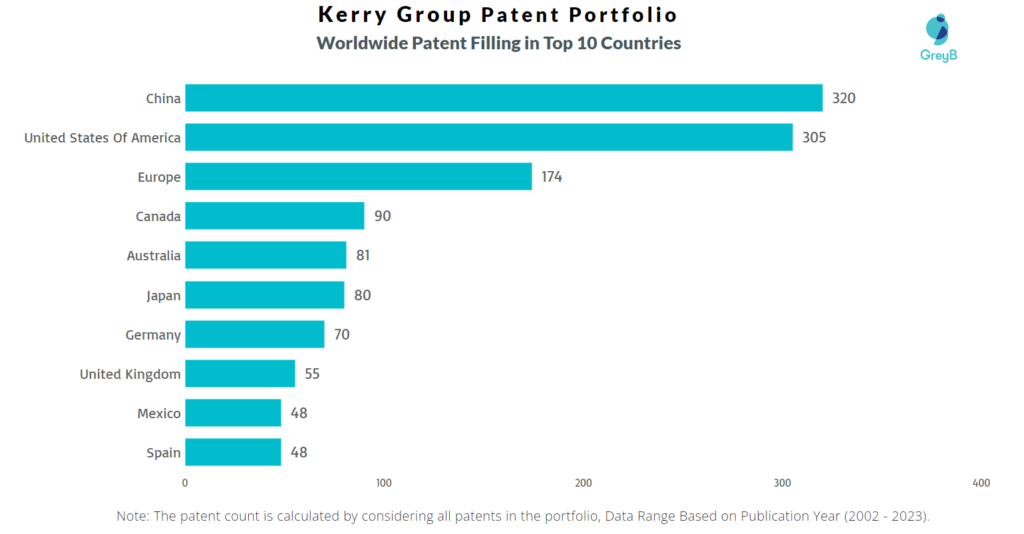
Countries in which Kerry Group Filed Patents
| Country | Patents |
| China | 320 |
| United States Of America | 305 |
| Europe | 174 |
| Canada | 90 |
| Australia | 81 |
| Japan | 80 |
| Germany | 70 |
| United Kingdom | 55 |
| Mexico | 48 |
| Spain | 48 |
| Brazil | 37 |
| Hong Kong (S.A.R.) | 34 |
| Austria | 32 |
| India | 26 |
| Korea (South) | 26 |
| Denmark | 25 |
| Ireland | 19 |
| Poland | 16 |
| Portugal | 16 |
| Norway | 13 |
| South Africa | 11 |
| New Zealand | 11 |
| Russia | 9 |
| Singapore | 8 |
| Argentina | 8 |
| Hungary | 8 |
| Croatia | 7 |
| Taiwan | 7 |
| Indonesia | 7 |
| Cyprus | 6 |
Where are Research Centres of Kerry Group Patents Located?
10 Best Kerry Group Patents
US6461607B1 is the most popular patent in the Kerry Group portfolio. It has received 251 citations so far from companies like Bioneer Corporation, Affinium Pharmaceuticals, and Flora Technology.
Below is the list of 10 most cited patents of Kerry Group:
| Publication Number | Citation Count |
| US6461607B1 | 251 |
| US6849256B1 | 146 |
| US6531126B2 | 116 |
| US7094932B2 | 102 |
| US7374753B1 | 96 |
| US6793167B2 | 94 |
| WO2004043213A1 | 92 |
| US6905692B2 | 88 |
| US6645506B1 | 88 |
| US6336603B1 | 88 |

Get Ahead in the Future of Food Innovation
Read The ReportWhat are Kerry Group key innovation segments?
