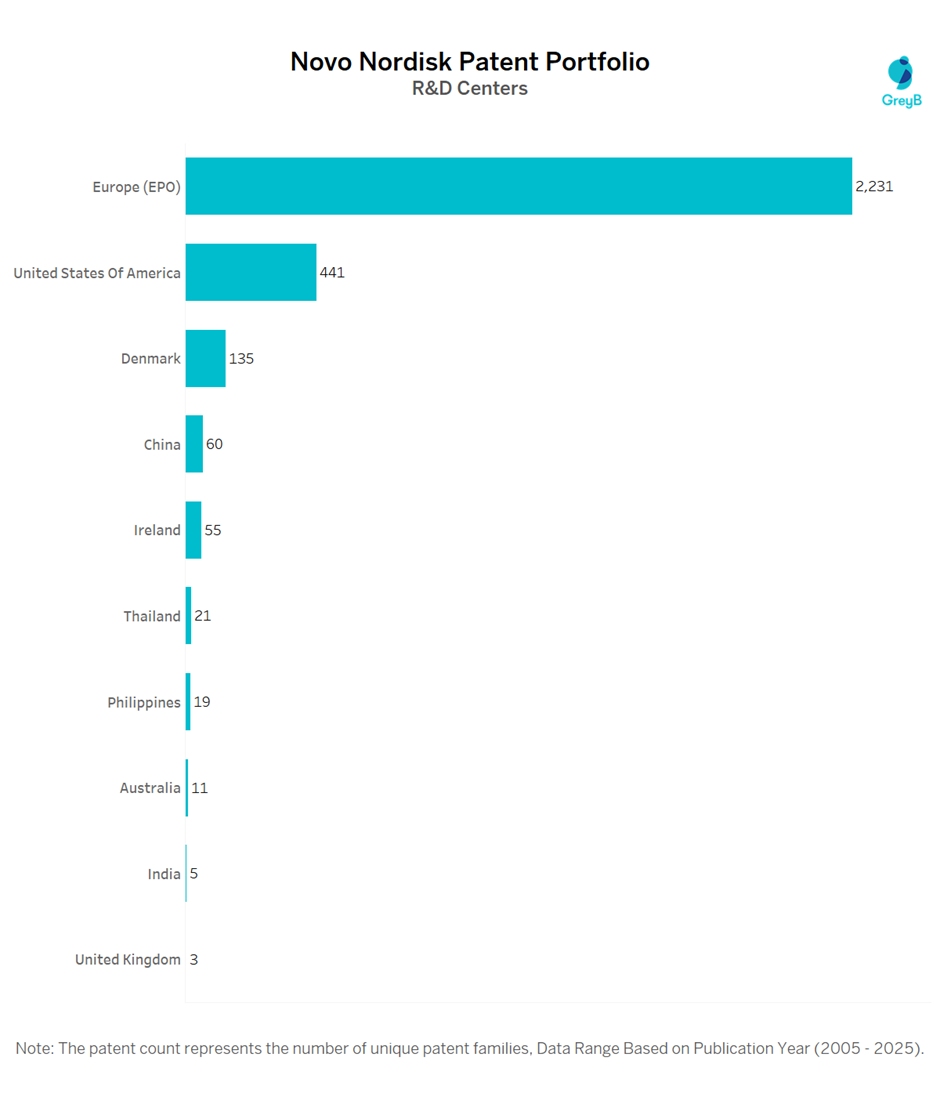
Novo Nordisk has a total of 9089 patents globally, out of which 3631 have been granted. Of these 9089 patents, more than 42.25% patents are active. Novo Nordisk has filed the maximum number of patents in the United States of America, followed by Europe (EPO) and China, making these regions its major innovation hubs. In line with this, Europe (EPO) also serves as Novo Nordisk’s primary R&D focus area. The company is headquartered in Bagsværd, Denmark, with key R&D facilities in China, Denmark, India, the United Kingdom, and the United States.
Novo Nordisk, established in 1923, is a leading global pharmaceutical company with a strong focus on innovative research and development. The company specializes in the discovery, development, manufacturing, and commercialization of biologic medicines and advanced healthcare solutions.
Its diverse portfolio spans key therapeutic areas, including diabetes care, obesity management, cardiovascular diseases, and rare diseases such as hemophilia and growth disorders. With a heritage of more than a century and a deep commitment to scientific innovation, Novo Nordisk plays a vital role in improving patient outcomes and expanding access to high-quality, life-changing treatments worldwide.
Do read about some of the most popular patents of Novo Nordisk which have been covered by us in this article and also you can find Novo Nordisk patents information, the worldwide patent filing activity and its patent filing trend over the years, and many other stats over Novo Nordisk patent portfolio.
How many patents does Novo Nordisk have?
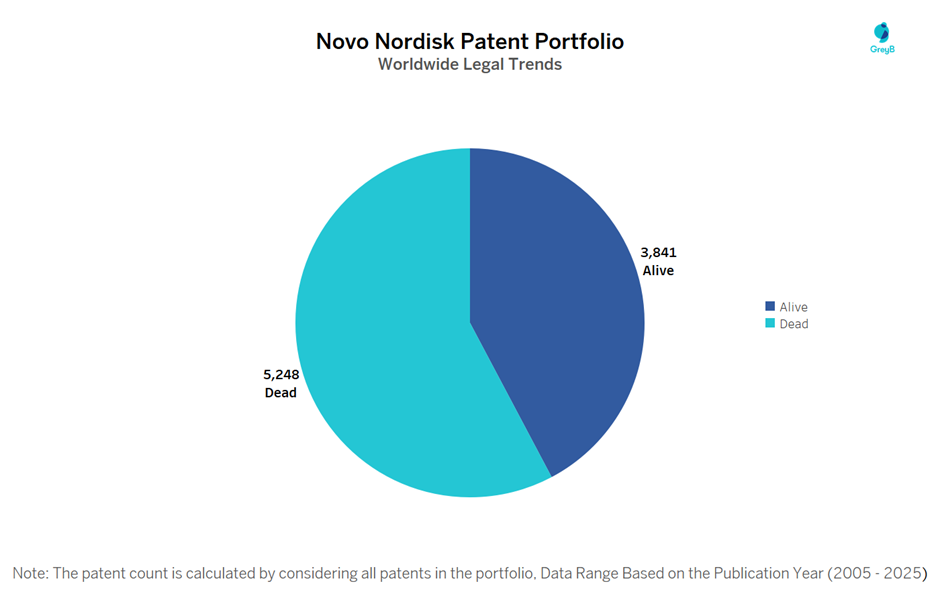
Novo Nordisk has a total of 9089 patents globally. These patents belong to 2998 unique patent families. Out of 9089 patents, 3841patents are active.
Take a look over the full story behind Novo Nordisk lost patents – expired patents, legal battles, and product drops – click here and explore the insights.
How Many Patents did Novo Nordisk File Every Year?
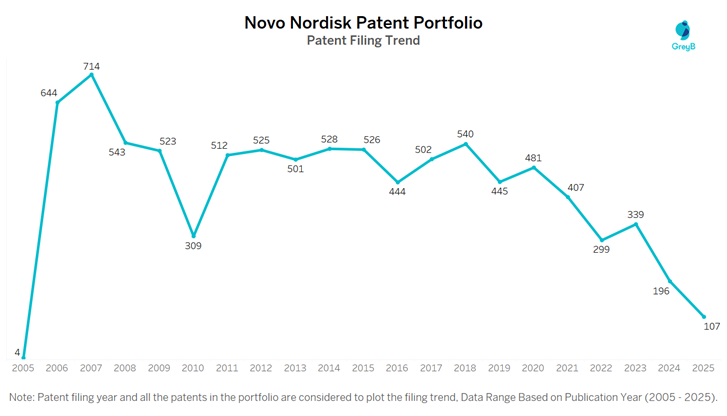
Are you wondering why there is a drop in patent filing for the last two years? It is because a patent application can take up to 18 months to get published. Certainly, it doesn’t suggest a decrease in the patent filing.
| Year of Patents Filing or Grant | Novo Nordisk Applications Filed | Novo Nordisk Patents Granted |
| 2025 | 107 | 164 |
| 2024 | 196 | 213 |
| 2023 | 339 | 204 |
| 2022 | 299 | 207 |
| 2021 | 407 | 243 |
| 2020 | 481 | 348 |
| 2019 | 445 | 283 |
| 2018 | 540 | 269 |
| 2017 | 502 | 243 |
| 2016 | 444 | 210 |
How many Novo Nordisk patents are Alive/Dead?
Worldwide Patents
How Many Patents did Novo Nordisk File in Different Countries?
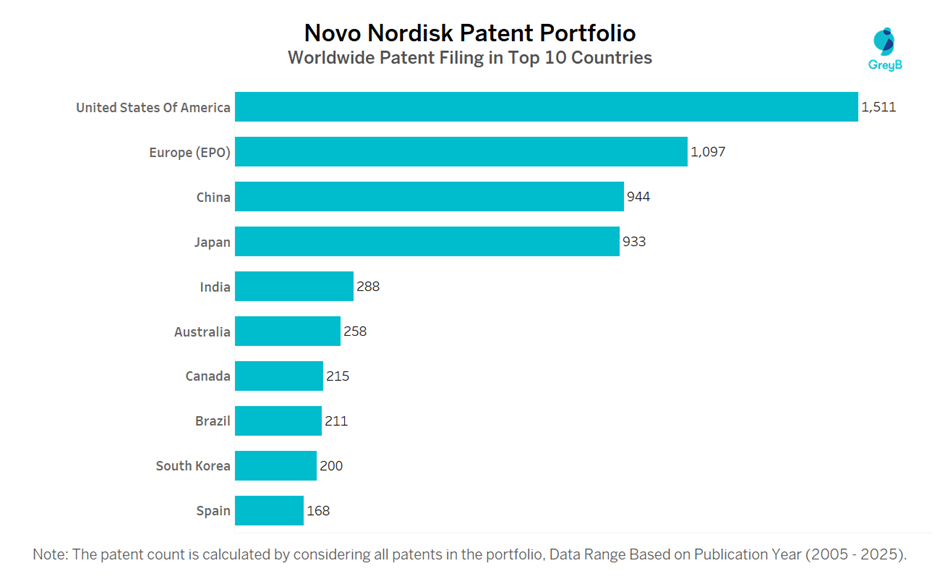
Top Countries in which Novo Nordisk Filed Patents
| Country | Patent |
| United States Of America | 1511 |
| Europe (EPO) | 1097 |
| China | 944 |
| Japan | 933 |
| India | 288 |
| Australia | 258 |
| Canada | 215 |
| Brazil | 211 |
| South Korea | 200 |
| Spain | 168 |
| Russia | 156 |
| Mexico | 145 |
| Israel | 141 |
| Taiwan | 131 |
| South Africa | 123 |
| Poland | 92 |
| Denmark | 82 |
| Tunisia | 82 |
| Turkey | 75 |
| Morocco | 73 |
| Malaysia | 73 |
| Hong Kong (S.A.R.) | 60 |
| Argentina | 59 |
| Indonesia | 56 |
| Hungary | 55 |
| Ireland | 55 |
| Singapore | 50 |
| Portugal | 48 |
| Philippines | 44 |
| Colombia | 44 |
| Viet Nam | 42 |
| Austria | 40 |
| Serbia | 39 |
| Croatia | 38 |
| Saudi Arabia | 34 |
| Eurasia | 33 |
| Bulgaria | 29 |
| Slovenia | 27 |
| Germany | 27 |
| Thailand | 25 |
| Chile | 19 |
| Norway | 18 |
| Romania | 14 |
| New Zealand | 8 |
| Iran | 8 |
| Netherlands | 5 |
| Latvia | 5 |
| Lithuania | 5 |
| France | 3 |
| Gulf Cooperation Council | 2 |
| Africa | 2 |
| Costa Rica | 2 |
| Finland | 2 |
| Luxembourg | 1 |
| Switzerland | 1 |
| Ukraine | 1 |
Where are Research Centres of Novo Nordisk Patents Located?
10 Best Novo Nordisk Patents
US8574199B2 is the most popular patent in the Novo Nordisk portfolio. It has received 1168 citations so far from companies like Companies, Ethicon Endo-Surgery, Llc, Cilag Gmbh International and Sanofi-Aventis Deutschland GmbH.
Below is the list of 10 most cited patents of Novo Nordisk:
| Publication Number | Citation Count |
| US8574199B2 | 1168 |
| US20090182127A1 | 694 |
| US20070179352A1 | 543 |
| US20060253296A1 | 362 |
| US20070049873A1 | 359 |
| US20090247931A1 | 296 |
| US20060069382A1 | 279 |
| WO2006040329A1 | 266 |
| US20100063438A1 | 242 |
| US20080215006A1 | 215 |
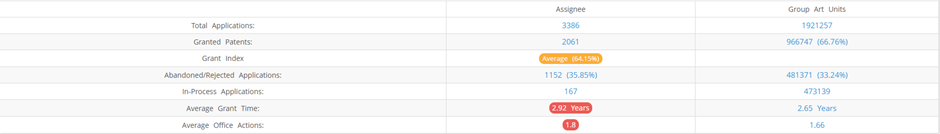
What Percentage of Novo Nordisk US Patent Applications Were Granted?
Novo Nordisk (Excluding its subsidiaries) has filed 3386 patent applications at USPTO so far (Excluding Design and PCT applications). Out of these 2061 have been granted leading to a grant rate of 64.15%.
Below are the key stats of Novo Nordisk patent prosecution at the USPTO.
Which Law Firms are managing US Patents for Novo Nordisk?
| Law Firm | Total Applications | Success Rate |
| Novo Nordisk (Inhouse Ip Deptt) | 1836 | 76.80% |
| Novozymes North America Inc | 868 | 75.75% |
| Blank Rome Llp | 172 | 81.33% |
| Leydig Voit & Mayer Ltd | 85 | 48.24% |
| High Point Pharmaceuticals Llc | 67 | 58.21% |
| Gordon W Hueschen | 49 | 97.96% |
| Epa Bozicevic Field & Francis Llp | 34 | 70.59% |
| Reza Green | 24 | 37.50% |
| Fidelman & Wolffe | 23 | 79.13% |
| Darby & Darby | 21 | 91.67% |
EXCLUSIVE INSIGHTS COMING SOON!