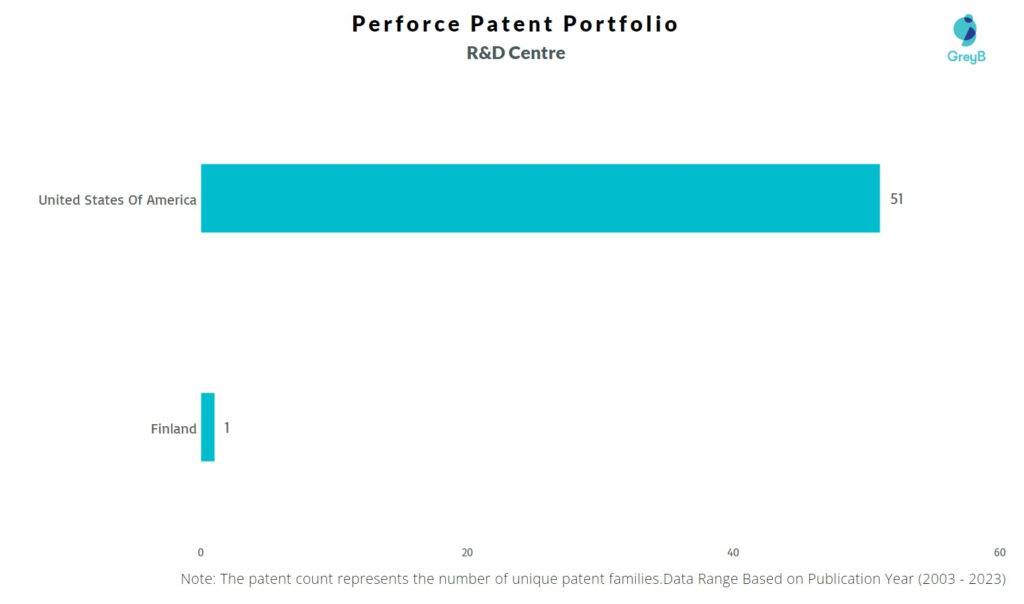
Perforce has a total of 110 patents globally, out of which 66 have been granted. Of these 110 patents, more than 35% patents are active. United States of America is where Perforce has filed the maximum number of patents, followed by Europe and Canada. Parallelly, United States of America seems to be the main focused R&D centre and also is the origin country of Perforce.
Perforce was founded in the year 1995. The Company provides information technology services. The Company offers version control, social coding, document collaboration, and development analytics solutions.
Do read about some of the most popular patents of Perforce which have been covered by us in this article and also you can find Perforce patents information, the worldwide patent filing activity and its patent filing trend over the years, and many other stats over Perforce patent portfolio.
How many patents does the founder and the CEO of Perforce have?
The founder Christopher Seiwald has 0 patent and CEO Mark Edward Ties has 0 patent.
How many patents does Perforce have?
Perforce has a total of 110 patents globally. These patents belong to 52 unique patent families. Out of 110 patents, 39 patents are active.
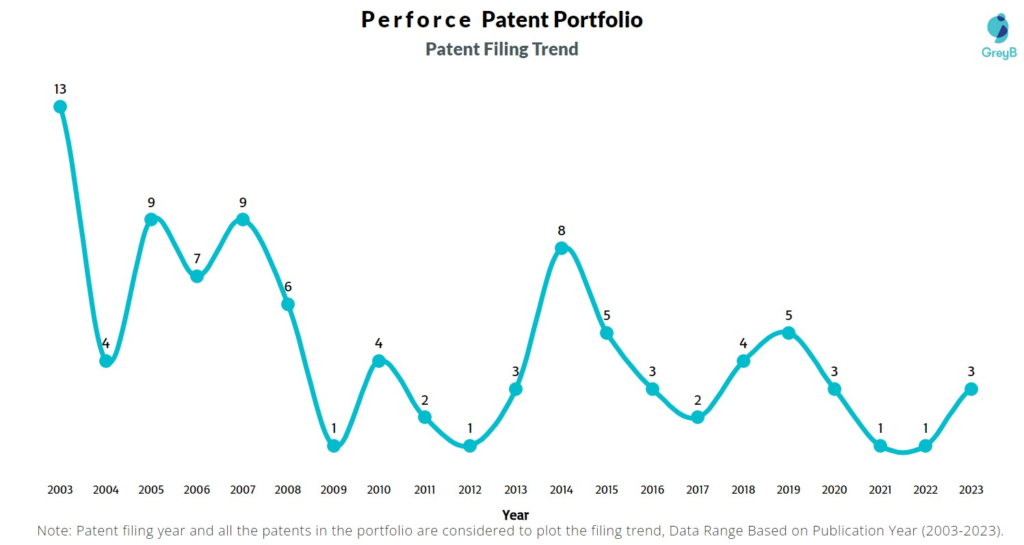
How Many Patents did Perforce File Every Year?

Are you wondering why there is a drop in patent filing for the last two years? It is because a patent application can take up to 18 months to get published. Certainly, it doesn’t suggest a decrease in the patent filing.
| Year of Patents Filing or Grant | Perforce Applications Filed | Perforce Patents Granted |
| 2023 | 3 | 3 |
| 2022 | 1 | 1 |
| 2021 | 1 | 2 |
| 2020 | 3 | 2 |
| 2019 | 5 | 9 |
| 2018 | 4 | – |
| 2017 | 2 | 3 |
| 2016 | 3 | 3 |
| 2015 | 5 | 3 |
| 2014 | 8 | 5 |
| 2013 | 3 | 4 |
| 2012 | 1 | 5 |
How many Perforce patents are Alive/Dead?

How Many Patents did Perforce File in Different Countries?

Countries in which Perforce Filed Patents
| Country | Patents |
| United States Of America | 76 |
| Europe | 8 |
| Canada | 4 |
| Australia | 3 |
| Japan | 3 |
| Germany | 1 |
| Israel | 1 |
Where are Research Centres of Perforce Patents Located?

10 Best Perforce Patents
US6901403B1 is the most popular patent in the Perforce portfolio. It has received 491 citations so far from companies like IBM, Bea Systems and Microsoft Corp.
Below is the list of 10 most cited patents of Perforce:
| Publication Number | Citation Count |
| US6901403B1 | 491 |
| US7349980B1 | 179 |
| US7149734B2 | 166 |
| US7322024B2 | 160 |
| US7853643B1 | 117 |
| US7546284B1 | 90 |
| US20070281734A1 | 77 |
| US20190080289A1 | 55 |
| US7788403B2 | 51 |
| US8412813B2 | 48 |
How many inventions of other companies were rejected due to Perforce patents?
The statistics below share strategic R&D insights. It tells the companies that were trying to protect inventions similar to Perforce invention. They couldn’t because Perforce had protected those before them.
Examiners at the USPTO referred 51 Perforce patents in 392 rejections (35 USC § 102 or 35 USC § 103 types).
The top citing companies in the Perforce patent portfolio are IBM, Oracle International Corporation and Sap Se.
List of the Companies whose Patents were rejected citing Perforce –
| Company | Number of Patent Applications that faced Rejection Citing Perforce Patents | Number of Rejections (102 & 103) |
| IBM | 29 | 65 |
| Oracle International Corporation | 8 | 27 |
| Sap Se | 6 | 15 |
| Microsoft Technology | 6 | 16 |
| Red Hat | 4 | 14 |
| Ca Inc | 4 | 6 |
| 4 | 4 | |
| Goldman Sachs | 3 | 5 |
| Blackberry Limited | 3 | 7 |
| Ecoatm | 2 | 10 |
Count of 102 and 103 Type Rejections based on Perforce Patents

Top Perforce Patents used in Rejecting Most Patent Applications
| Patent Number | Count of Rejected Applications |
| US10521612B2 | 14 |
| US7895563B2 | 10 |
| US8707287B2 | 10 |
| US7149734B2 | 10 |
| US7853643B1 | 9 |
| US6901403B1 | 9 |
| US20070281734A1 | 8 |
| US7788403B2 | 6 |
| US8255485B2 | 6 |
| US8539455B2 | 6 |
| US8412813B2 | 6 |
| US7296061B2 | 6 |
| US7349980B1 | 6 |
| US7322024B2 | 5 |
| US8498982B1 | 5 |
What Percentage of Perforce US Patent Applications were Granted?
Perforce (Excluding its subsidiaries) has filed 46 patent applications at USPTO so far (Excluding Design and PCT applications). Out of these 40 have been granted leading to a grant rate of 86.96%.
Below are the key stats of Perforce patent prosecution at the USPTO.

Which Law Firms Filed Most US Patents for Perforce?
| Law Firm | Total Applications | Success Rate |
| Fredrikson & Byron P A | 32 | 93.75% |
| Nixon Peabody Llp | 7 | 42.86% |
| Baker Botts Llp | 3 | 100.00% |
| Shumaker & Sieffert P A | 3 | 100.00% |
| Sheppard Mullin Richter & Hampton Llp | 1 | 100.00% |
What are Perforce key innovation segments?
What Technologies are Covered by Perforce?

The chart below distributes patents filed by Perforce
