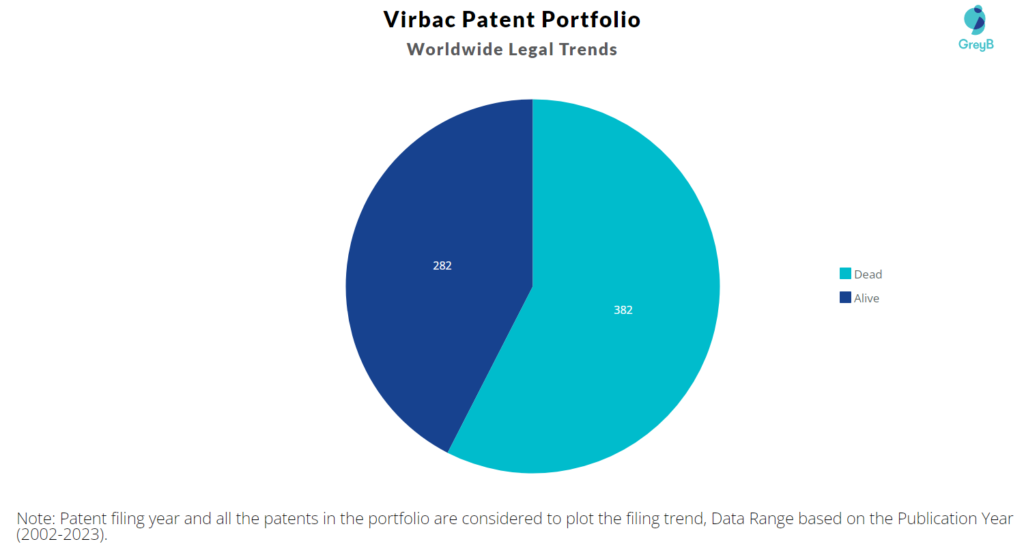
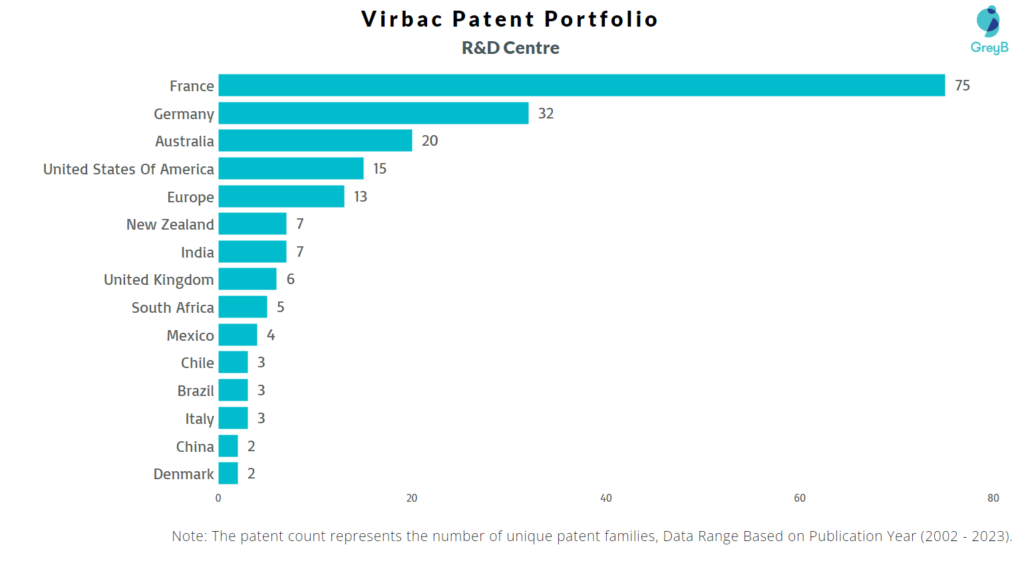
Virbac has a total of 664 patents globally, out of which 377 have been granted. Of these 664 patents, more than 42% patents are active. The United States of America is where Virbac has filed the maximum number of patents, followed by Europe and Australia. Parallelly, France seems to be the main focused R&D centre and also is the origin country of Virbac.
Virbac was founded in the year 1968. Healthcare services are offered by Virbac. The business produces vaccines, worm treatments, and antibiotics for veterinary usage. As of April 2023, the market cap of Virbac is $2.6 Billion.
Do read about some of the most popular patents of Virbac which have been covered by us in this article and also you can find Virbac patents information, the worldwide patent filing activity and its patent filing trend over the years, and many other stats over Virbac patent portfolio.
How many patents does the founder and the CEO of Virbac have?
The founder Pierre-Richard Dick have 2 patents and CEO Sebastien Huron have 10 patents.
How many patents does Virbac have?
Virbac has a total of 664 patents globally. These patents belong to 207 unique patent families. Out of 664 patents, 282 patents are active.
How Many Patents did Virbac File Every Year?
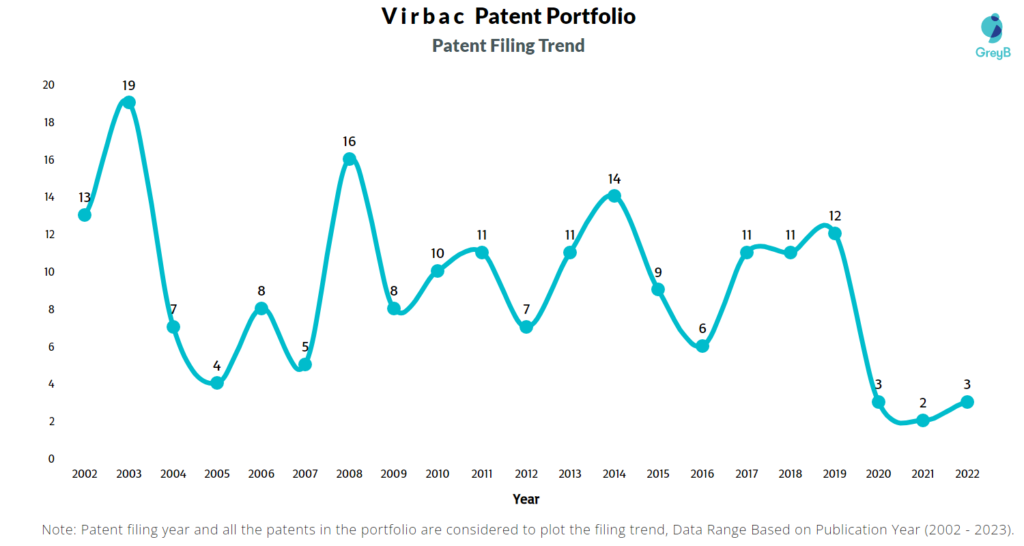
Are you wondering why there is a drop in patent filing for the last two years? It is because a patent application can take up to 18 months to get published. Certainly, it doesn’t suggest a decrease in the patent filing.
| Year of Patents Filing or Grant | Virbac Applications Filed | Virbac Patents Granted |
| 2023 | – | 2 |
| 2022 | 3 | 7 |
| 2021 | 2 | 20 |
| 2020 | 3 | 25 |
| 2019 | 12 | 34 |
| 2018 | 11 | 25 |
| 2017 | 11 | 25 |
| 2016 | 6 | 15 |
| 2015 | 9 | 21 |
| 2014 | 14 | 12 |
| 2013 | 11 | 11 |
| 2012 | 7 | 26 |
| 2011 | 11 | 15 |
How many Virbac patents are Alive/Dead?
How Many Patents did Virbac File in Different Countries?
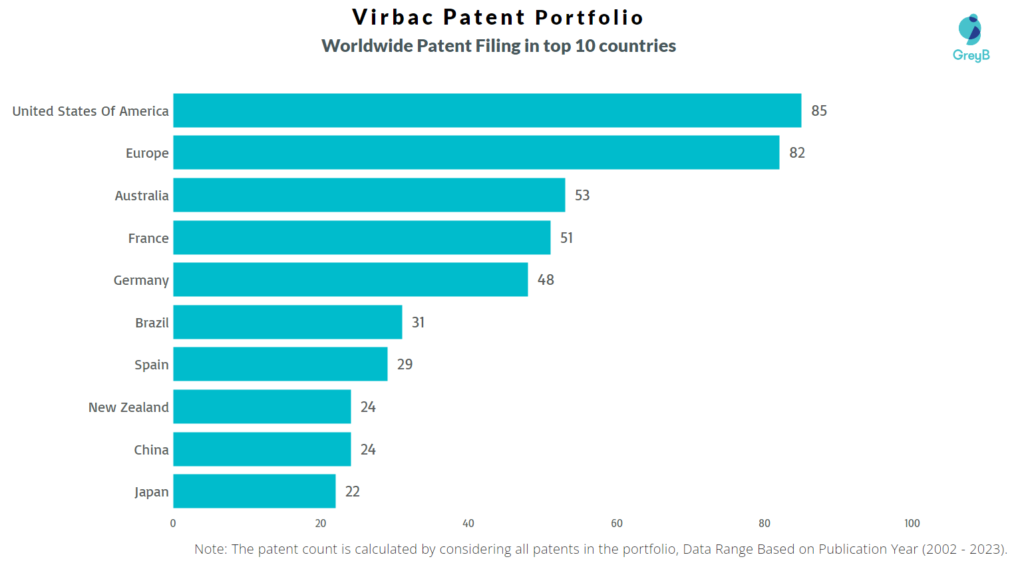
Countries in which Virbac Filed Patents
| Country | Patent |
| United States Of America | 85 |
| Europe | 82 |
| Australia | 53 |
| France | 51 |
| Germany | 48 |
| Brazil | 31 |
| Spain | 29 |
| New Zealand | 24 |
| China | 24 |
| Japan | 22 |
| India | 17 |
| Canada | 16 |
| South Africa | 15 |
| Mexico | 15 |
| Austria | 14 |
| United Kingdom | 8 |
| Denmark | 7 |
| Chile | 7 |
| Colombia | 6 |
| Slovenia | 5 |
| Portugal | 4 |
| Italy | 4 |
| Norway | 4 |
| Argentina | 3 |
| Taiwan | 2 |
| Morocco | 2 |
| Hong Kong (S.A.R.) | 2 |
| Africa | 2 |
| Ecuador | 1 |
| Uruguay | 1 |
| Tunisia | 1 |
| Panama | 1 |
Where are Research Centres of Virbac Patents Located?
10 Best Virbac Patents
EP1331222A1 is the most popular patent in the Virbac portfolio. It has received 44 citations so far from companies like Basf, Makhteshim Chemical Works and Shanghai Tahoe Chemical.
Below is the list of 10 most cited patents of Virbac:
| Publication Number | Citation Count |
| EP1331222A1 | 44 |
| US6337318B1 | 42 |
| WO2005123120A1 | 42 |
| WO2003022242A1 | 41 |
| US6500446B1 | 38 |
| US6653288B1 | 34 |
| WO2003002102A1 | 29 |
| US20040234572A1 | 22 |
| US6913761B1 | 18 |
| US7396820B2 | 17 |
How many inventions of other companies were rejected due to Virbac patents?
The statistics below share strategic R&D insights. It tells the companies that were trying to protect inventions similar to Virbac invention. They couldn’t because Virbac had protected those before them.
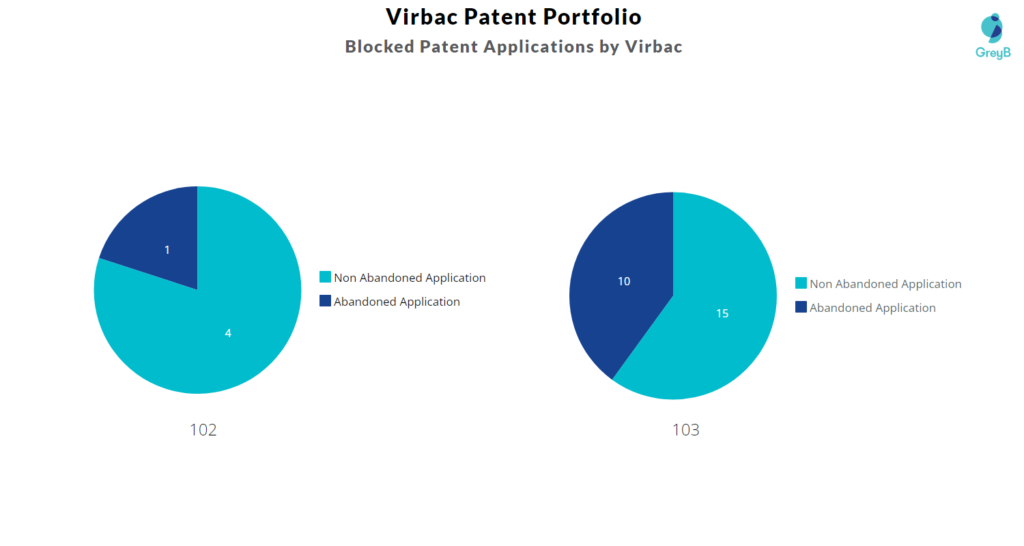
Examiners at the USPTO referred 17 Virbac patents in 59 rejections (35 USC § 102 or 35 USC § 103 types).
The top citing companies in the Virbac patent portfolio are Wenzhou Yuxiang Pet Product, Medtronic and The Broad Institute.
List of the Companies whose Patents were rejected citing Virbac –
| Company | Number of Patent Applications that faced Rejection Citing Virbac Patents | Number of Rejections (102 & 103) |
| Wenzhou Yuxiang Pet Product | 3 | 6 |
| Medtronic | 3 | 6 |
| The Broad Institute | 1 | 2 |
| Miv Therapeutics | 1 | 1 |
| Warsaw Orthopedic | 1 | 2 |
| Biowish Technologies | 1 | 1 |
| Pola Pharma | 1 | 1 |
| Blueberry Therapeutics | 1 | 1 |
| University Of Texas System | 1 | 4 |
| Chesapeake Therapeutics | 1 | 1 |
Count of 102 and 103 Type Rejections based on Virbac Patents
Top Virbac Patents used in Rejecting Most Patent Applications
| Patent Number | Count of Rejected Applications |
| US20050063907A1 | 5 |
| US9681642B2 | 3 |
| US9259448B2 | 3 |
| US20080200427A1 | 2 |
| US6500446B1 | 2 |
| US20060068039A1 | 1 |
| US20150335620A1 | 1 |
| US20040247634A1 | 1 |
| US6337318B1 | 1 |
| US8197839B2 | 1 |
| US9974736B2 | 1 |
| US9260231B2 | 1 |
| US20030124567A1 | 1 |
| US9750797B2 | 1 |
| US6890955B2 | 1 |
What Percentage of Virbac US Patent Applications were Granted?
Virbac (Excluding its subsidiaries) has filed 11 patent applications at USPTO so far (Excluding Design and PCT applications). Out of these 6 have been granted leading to a grant rate of 54.55%.
Below are the key stats of Virbac patent prosecution at the USPTO.

Which Law Firms Filed Most US Patents for Virbac?
| Law Firm | Total Applications | Success Rate |
| Nicolas E Seckel | 5 | 80.00% |
| Whda Llp | 3 | 0.00% |
| Alston & Bird | 1 | 100.00% |
| Morgan Lewis & Bockius | 1 | 0.00% |
| Volpe Koenig | 1 | 100.00% |
