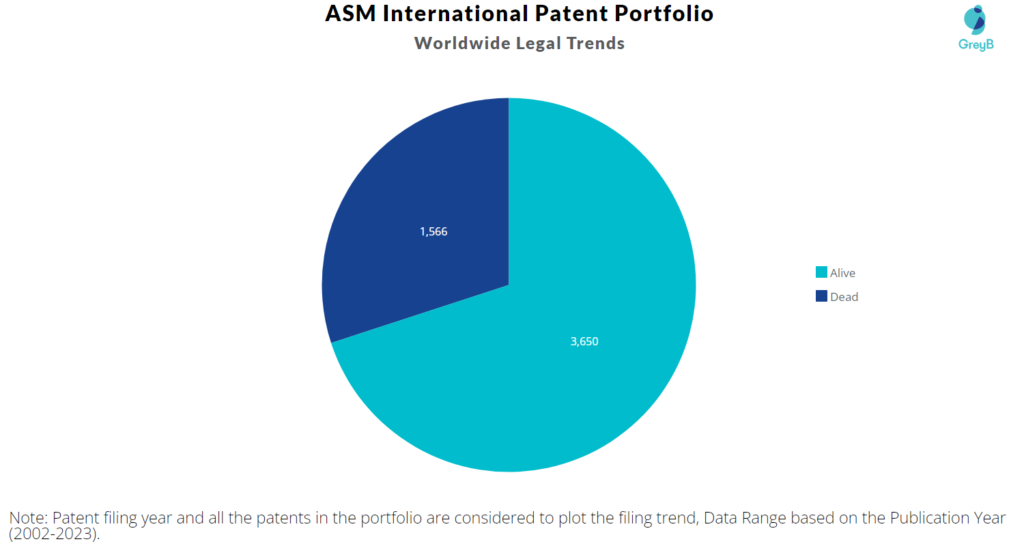
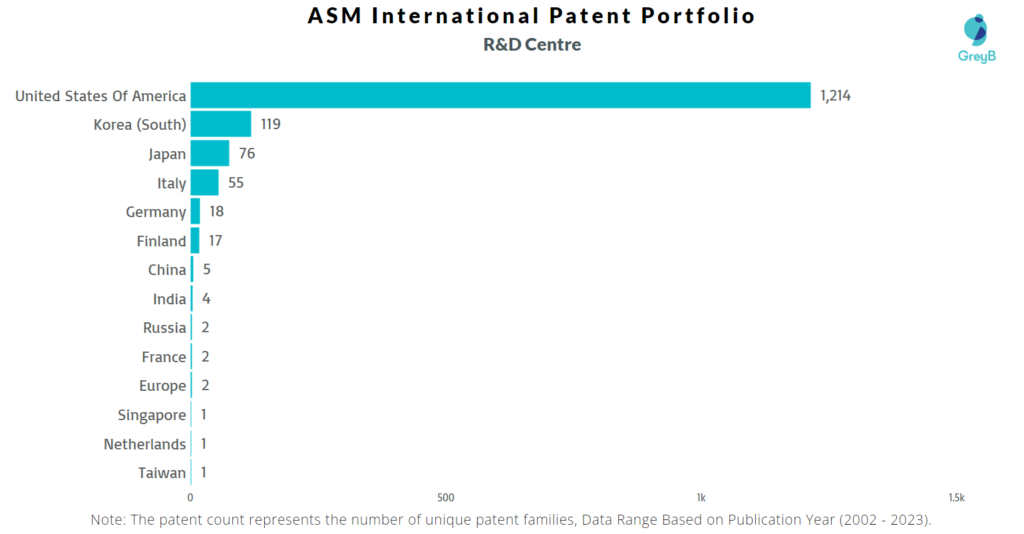
ASM International has a total of 5216 patents globally, out of which 2609 have been granted. Of these 5216 patents, more than 69% patents are active. The United States of America is where ASM International has filed the maximum number of patents, followed by Korea (South) and Taiwan. Parallelly, the United States of America seems to be the main focused R&D centre and the Netherlands is the origin country of ASM International.
ASM International was founded in the year 1969. The Company develops, manufactures, markets and services machines used to produce semiconductors. The Company manufactures machines that process silicon wafers and assemble and package semiconductors. As of February 2023, the market cap of ASM International is $15.73 Billion.
Do read about some of the most popular patents of ASM International which have been covered by us in this article and also you can find ASM International patents information, the worldwide patent filing activity and its patent filing trend over the years, and many other stats over ASM International patent portfolio.
How many patents does the founder and the CEO of ASM International have?
The founder Arthur Del Prado has 0 patent and CEO Charles Dean Del Prado has 0 patent.
How many patents does ASM International have?
ASM International has a total of 5216 patents globally. These patents belong to 1517 unique patent families. Out of 5216 patents, 3650 patents are active.
How Many Patents did ASM International File Every Year?
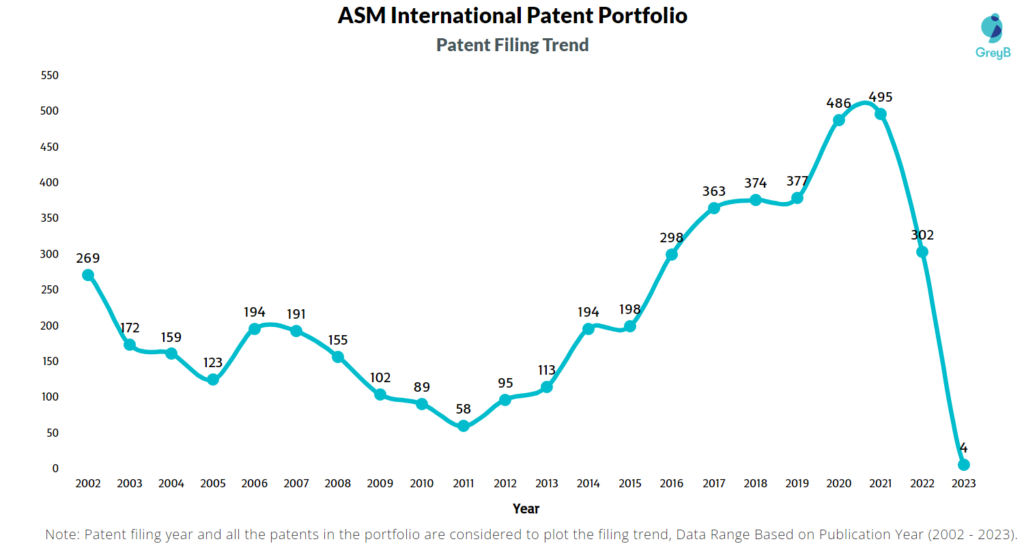
Are you wondering why there is a drop in patent filing for the last two years? It is because a patent application can take up to 18 months to get published. Certainly, it doesn’t suggest a decrease in the patent filing.
| Year of Patents Filing or Grant | ASM International Applications Filed | ASM International Patents Granted |
| 2023 | 4 | 34 |
| 2022 | 302 | 338 |
| 2021 | 495 | 259 |
| 2020 | 486 | 255 |
| 2019 | 377 | 222 |
| 2018 | 374 | 140 |
| 2017 | 363 | 132 |
| 2016 | 298 | 118 |
| 2015 | 198 | 106 |
| 2014 | 194 | 93 |
| 2013 | 113 | 72 |
| 2012 | 95 | 72 |
| 2011 | 58 | 76 |
How many ASM International patents are Alive/Dead?
How Many Patents did ASM International File in Different Countries?
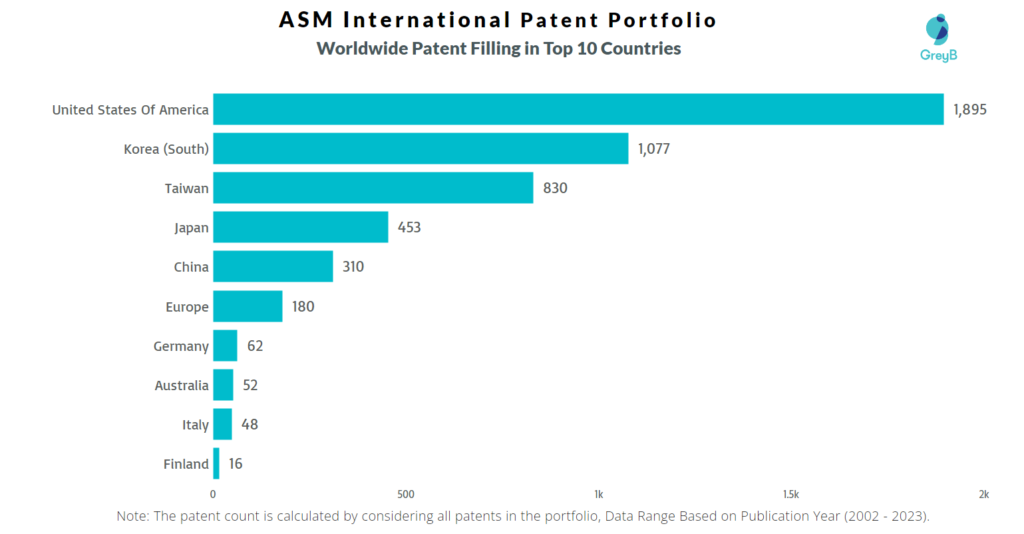
Countries in which ASM International Filed Patents
| Country | Patents |
| United States Of America | 1895 |
| Korea (South) | 1077 |
| Taiwan | 830 |
| Japan | 453 |
| China | 310 |
| Europe | 180 |
| Germany | 62 |
| Australia | 52 |
| Italy | 48 |
| Finland | 16 |
| India | 14 |
| Singapore | 12 |
| Austria | 11 |
| Russia | 7 |
| Spain | 5 |
| France | 2 |
| Denmark | 2 |
| Hong Kong (S.A.R.) | 2 |
| Netherlands | 2 |
| Portugal | 2 |
| Sweden | 1 |
| United Kingdom | 1 |
| Poland | 1 |
Where are Research Centres of ASM International Patents Located?
10 Best ASM International Patents
US6388393B1 is the most popular patent in the ASM International portfolio. It has received 1001 citations so far from companies like Honeywell, Innosys and Cree.
Below is the list of 10 most cited patents of ASM International:
| Publication Number | Citation Count |
| US6511539B1 | 1001 |
| US6383955B1 | 662 |
| US9017481B1 | 514 |
| US6352945B1 | 510 |
| US6455445B2 | 433 |
| US6435798B1 | 417 |
| US6410463B1 | 404 |
| US7297641B2 | 390 |
| US7601223B2 | 388 |
| US7122085B2 | 386 |
How many inventions of other companies were rejected due to ASM International patents?
The statistics below share strategic R&D insights. It tells the companies that were trying to protect inventions similar to ASM International invention. They couldn’t because ASM International had protected those before them.
Examiners at the USPTO referred 622 ASM International patents in 3746 rejections (35 USC § 102 or 35 USC § 103 types).
The top citing companies in the ASM International patent portfolio are Applied Materials, Tokyo Electron and Tsmc.
List of the Companies whose Patents were rejected citing ASM International –
| Company | Number of Patent Applications that faced Rejection Citing ASM International Patents | Number of Rejections (102 & 103) |
| Applied Materials | 260 | 632 |
| Tokyo Electron | 175 | 360 |
| Tsmc | 127 | 330 |
| Lam Research | 65 | 166 |
| Kokusai Electric | 50 | 125 |
| IBM | 45 | 113 |
| Samsung | 43 | 134 |
| Globalfoundries | 29 | 69 |
| Novellus Systems | 28 | 66 |
| Micron Technology | 25 | 71 |
Count of 102 and 103 Type Rejections based on ASM International Patents
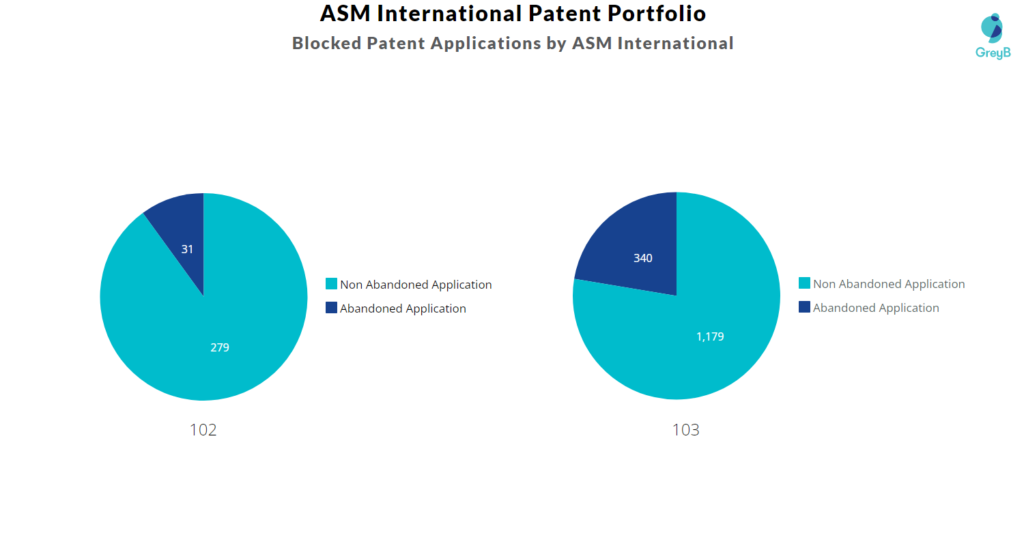
Top ASM International Patents used in Rejecting Most Patent Applications
| Patent Number | Count of Rejected Applications |
| US7759199B2 | 36 |
| US20070218702A1 | 34 |
| US8367528B2 | 31 |
| US20070215036A1 | 20 |
| US8647722B2 | 17 |
| US6899145B2 | 15 |
| US7718004B2 | 13 |
| US7601223B2 | 13 |
| US8293658B2 | 12 |
| US8440048B2 | 12 |
| US10047435B2 | 12 |
| US8278176B2 | 11 |
| US7476618B2 | 11 |
| US7712435B2 | 11 |
| US7816236B2 | 11 |
What Percentage of ASM International US Patent Applications were Granted?
ASM International (Excluding its subsidiaries) has filed 332 patent applications at USPTO so far (Excluding Design and PCT applications). Out of these 295 have been granted leading to a grant rate of 90.49%.
Below are the key stats of ASM International patent prosecution at the USPTO.

Which Law Firms Filed Most US Patents for ASM International?
| Law Firm | Total Applications | Success Rate |
| Knobbe Martens Olson & Bear | 268 | 91.63% |
| Preti Flaherty Beliveau & Pachios | 37 | 78.38% |
| Knobbe Martens Olson & Bear | 4 | 100.00% |
| Squire Sanders & Dempsey | 3 | 100.00% |
| Tucker Ellis | 3 | 100.00% |
| Knobbe Martens Olson & Bear | 2 | 100.00% |
| Linda E Alcorn | 2 | 100.00% |
| Nixon & Vanderhye | 2 | 100.00% |
| Snell & Wilmer Asm Ip Holding | 2 | 100.00% |
| Adeel S Akhtar | 1 | 0% |
