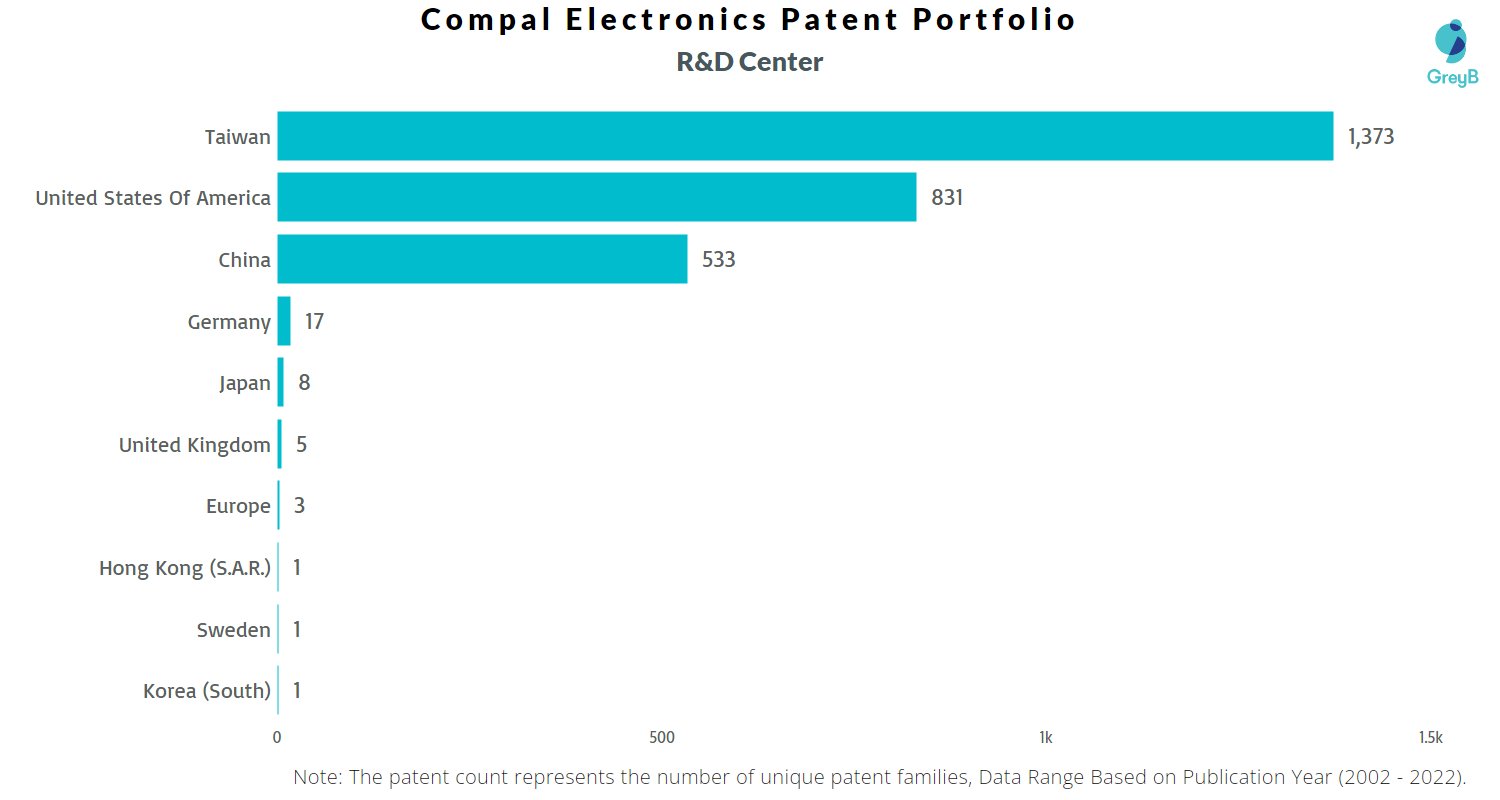
Compal Electronics has a total of 4957 patents globally, out of which 2773 have been granted. Of these 4957 patents, more than 46% patents are active. Taiwan is where Compal Electronics has filed the maximum number of patents, followed by China and USA. Parallelly, USA seems to be the main focused R&D center and is also the origin country of Compal Electronics.
Compal Electronics was founded in 1984. Compal Electronics Inc. manufactures and markets notebook computers and color monitors. The Company also produces liquid crystal displays and other computer-related products. Compal Electronics exports its products to the United States, Europe, and Asia. As of April 2022, Compal Electronics has a market cap of $109.8 Billion.
Read about some of the most popular patents of Compal Electronics which have been covered by us in this article and also you can find Compal Electronics patents information, the worldwide patent filing activity and its patent filing trend over the years, and many other stats over Compal Electronics patent portfolio.
How many patents does the CEO of Compal Electronics have?
The CEO, Martin Wong has 0 patents.
How many patents does Compal Electronics have?
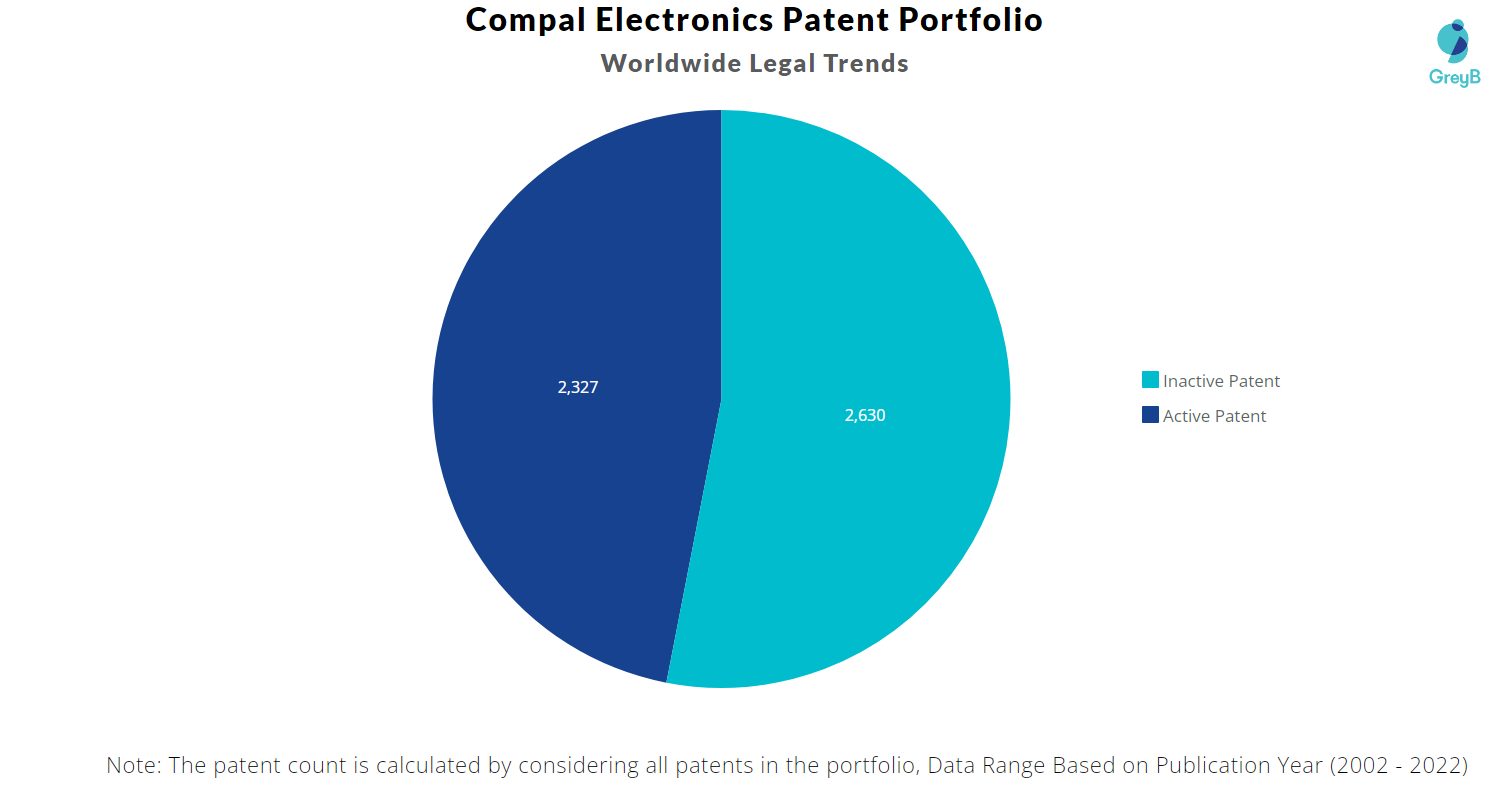
Compal Electronics has a total of 4957 patents globally. These patents belong to 2773 unique patent families. Out of 4957 patents, 2327 patents are active.
How Many Patents did Compal Electronics File Every Year?
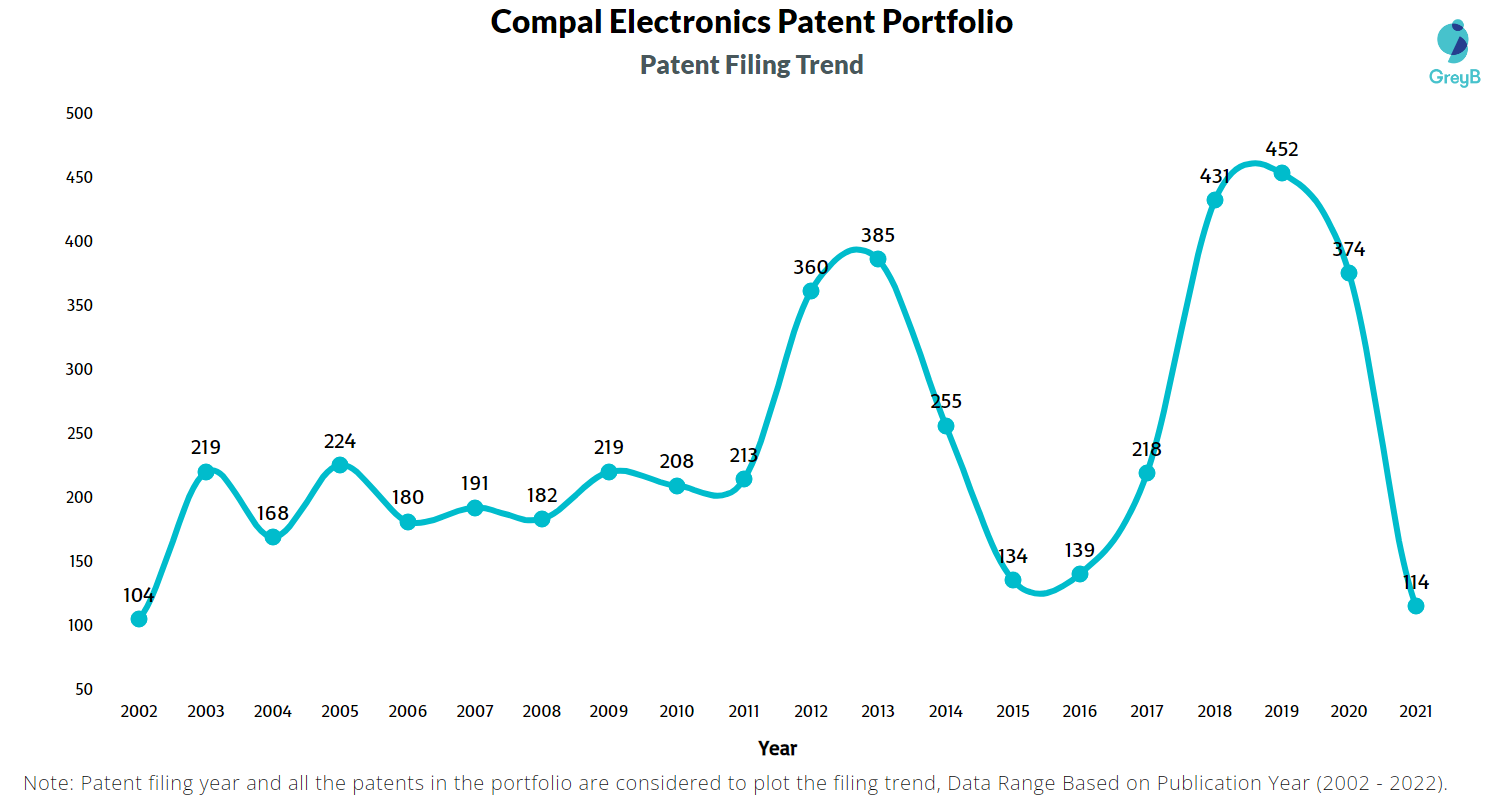
Are you wondering why there is a drop in patent filing for the last two years? It is because a patent application can take up to 18 months to get published. Certainly, it doesn’t suggest a decrease in the patent filing.
| Year of Patents Filing or Grant | Compal Electronics Applications Filed | Compal Electronics Patents Granted |
| 2011 | 213 | 91 |
| 2012 | 360 | 140 |
| 2013 | 385 | 128 |
| 2014 | 255 | 134 |
| 2015 | 134 | 191 |
| 2016 | 139 | 193 |
| 2017 | 218 | 131 |
| 2018 | 431 | 136 |
| 2019 | 452 | 288 |
| 2020 | 374 | 347 |
| 2021 | 114 | 327 |
| 2022 | – | 103 |
How many Compal Electronics patents are Alive/Dead?
Worldwide Patents
How Many Patents did Compal Electronics File in Different Countries?

Countries in which Compal Electronics Filed Patents
| Country | Patents |
| Taiwan | 2072 |
| China | 1398 |
| United States Of America | 1267 |
| Germany | 100 |
| Korea (South) | 55 |
| Japan | 36 |
| United Kingdom | 17 |
| Europe | 6 |
| France | 4 |
| Sweden | 1 |
| Hong Kong (S.A.R.) | 1 |
Where are Research Centers of Compal Electronics Patents Located?
10 Best Compal Electronics Patents
US6567102B2 is the most popular patent in the Compal Electronics portfolio. It has received 278 citations so far from companies like Apple, Samsung and Microsoft.
Below is the list of 10 most cited patents of Compal Electronics:
| Publication Number | Citation Count |
| US6567102B2 | 278 |
| US6574739B1 | 243 |
| US6366440B1 | 217 |
| US6712321B1 | 188 |
| US20120087078A1 | 161 |
| US20100214239A1 | 149 |
| US6570583B1 | 146 |
| US6700775B1 | 141 |
| USD671938S1 | 138 |
| USD507003S1 | 138 |
Which Companies are using Compal Electronics Patents to Advance their Research?
If patents or patents from a particular technology area of a company receive a lot of citations, it implies that the technology is being followed and incrementally innovated by the citing companies. It also indicates that citing companies are working on similar and closely related technologies.
The top citing companies in the Compal Electronics patent portfolio are Samsung, Hon Hai Precision Industry and Wistron.
List of the top forward citing Companies –
| Company | Number of Patents |
| Samsung Electronics | 57 |
| Hon Hai Precision Industry Co Ltd | 38 |
| Wistron | 27 |
| Apple | 25 |
| Hong Fu Jin Precision Industry (Shenzhen) Co Ltd | 21 |
| Microsoft | 16 |
| Intel | 15 |
| Boe Technology Group Co | 14 |
| LG Electronics | 13 |
| Hewlett-Packard | 12 |
Count of 102 and 103 Type Rejections based on Compal Electronics Patents

Top Compal Electronics Patents used in Rejecting Most Patent Applications
| Patent Number | Count of Rejected Applications |
| US6567102B2 | 22 |
| US20120087078A1 | 16 |
| US20100073303A1 | 13 |
| US20130016046A1 | 12 |
| US6831631B2 | 11 |
| US20120306788A1 | 11 |
| US6574739B1 | 10 |
| US7804492B2 | 10 |
| US20030184529A1 | 9 |
| US7426112B2 | 9 |
| US20100169813A1 | 9 |
| US6517129B1 | 9 |
| US20140189584A1 | 8 |
| US7345874B2 | 7 |
| US8377540B2 | 7 |
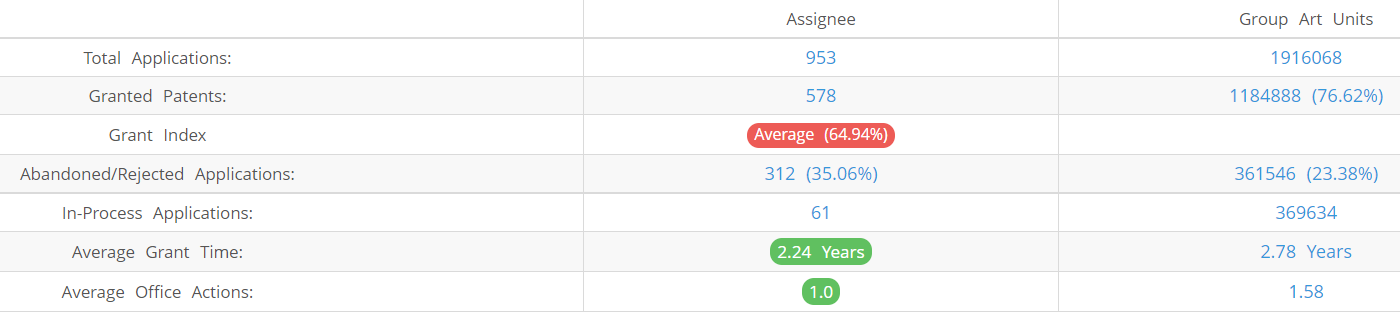
What Percentage of Compal Electronics US Patent Applications were Granted?
Compal Electronics (Excluding its subsidiaries) has filed 953 patent applications at USPTO so far (Excluding Design and PCT applications). Out of these 578 have been granted leading to a grant rate of 64.94%.
Below are the key stats of Compal Electronics patent prosecution at the USPTO.
Which Law Firms Filed Most US Patents for Compal Electronics?
| Law Firm | Total Applications | Success Rate |
| Jciprnet | 601 | 66.54% |
| North America Intellectual Property Corporation | 63 | 58.73% |
| Bacon & Thomas Pllc | 46 | 67.39% |
| James Lynn O Sullivan | 36 | 41.67% |
| Pillsbury Winthrop Shaw Pittman Llp | 23 | 100.00% |
| Yuan Te Fu | 20 | 78.95% |
| Evan R Witt | 18 | 87.50% |
| Sinorica Llc | 16 | 62.50% |
| Mcclure Qualey & Rodack Llp | 15 | 53.33% |
| Muncy Geissler Olds & Lowe PC | 14 | 21.43% |
EXCLUSIVE INSIGHTS COMING SOON!
What are Compal Electronics’ key innovation segments?