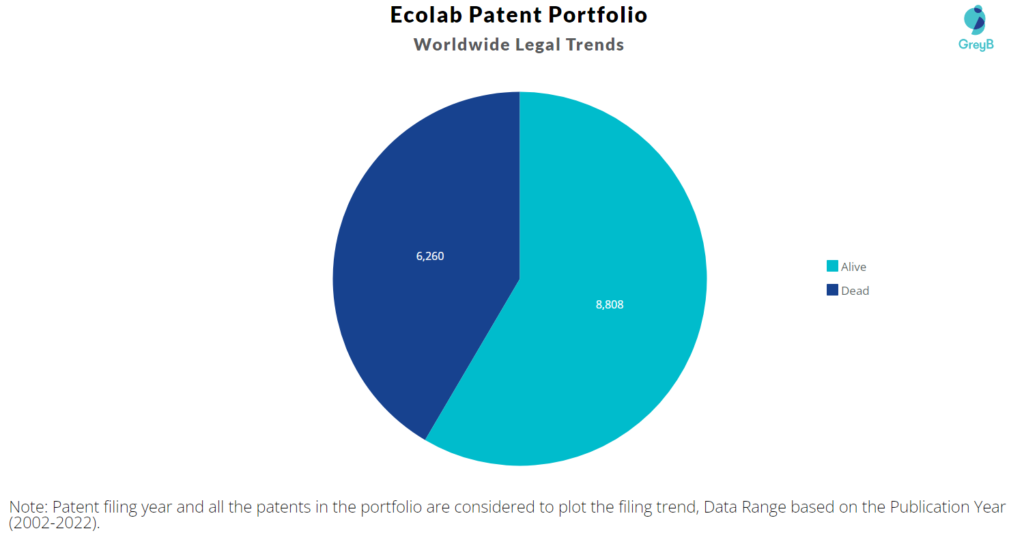
Ecolab has a total of 15068 patents globally, out of which 9168 have been granted. Of these 15068 patents, more than 58% patents are active. The United States of America is where Ecolab has filed the maximum number of patents, followed by Europe and Japan. Parallelly, the United States of America seems to be the main focused R&D centre and also is the origin country of Ecolab.
Ecolab was founded in the year 1923 by Merritt J. Osborn. Ecolab is a global provider of water, hygiene and infection prevention solutions for customers in food, healthcare, hospitality, industrial and oil and gas markets. The Company’s services included food & safety, sanitation, optimization of water and energy use, and improvement of operational efficiency and sustainability. As of December 2022, the market cap of Ecolab is $ 40.68 Billion.
Do read about some of the most popular patents of Ecolab which have been covered by us in this article and also you can find Ecolab patents information, the worldwide patent filing activity and its patent filing trend over the years, and many other stats over Ecolab patent portfolio.
How many patents does the founder and CEO of Ecolab have?
The founder Merritt J. Osborn has 0 patent and CEO Christophe Beck has 0 patent.
How many patents does Ecolab have?
Ecolab has a total of 15068 patents globally. These patents belong to 4014 unique patent families. Out of 15068 patents, 8808 patents are active.
How Many Patents did Ecolab File Every Year?
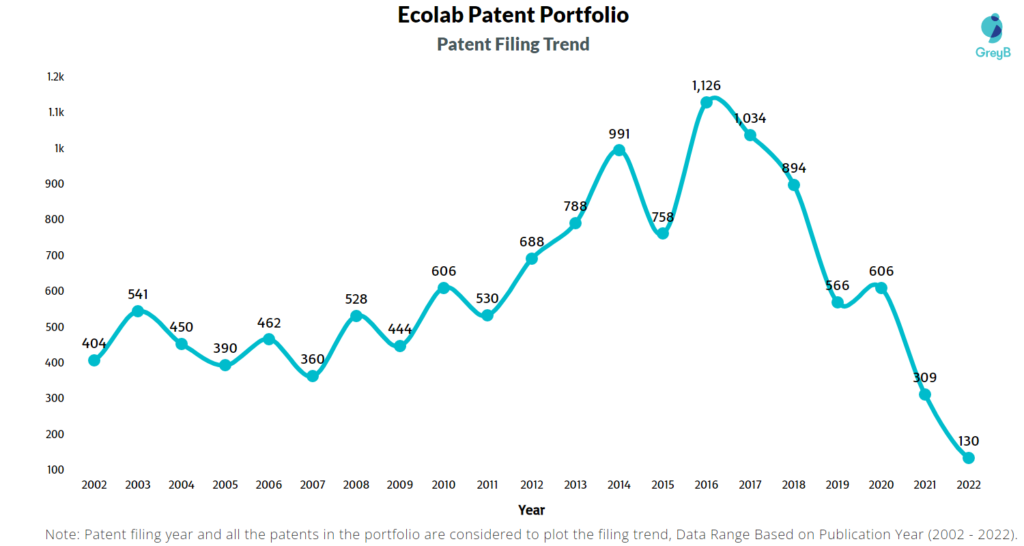
Are you wondering why there is a drop in patent filing for the last two years? It is because a patent application can take up to 18 months to get published. Certainly, it doesn’t suggest a decrease in the patent filing.
| Year of Patents Filing or Grant | Ecolab Applications Filed | Ecolab Patents Granted |
| 2022 | 130 | 687 |
| 2021 | 309 | 786 |
| 2020 | 606 | 813 |
| 2019 | 566 | 746 |
| 2018 | 894 | 679 |
| 2017 | 1034 | 563 |
| 2016 | 1126 | 399 |
| 2015 | 758 | 327 |
| 2014 | 991 | 328 |
| 2013 | 788 | 346 |
| 2012 | 688 | 377 |
| 2011 | 530 | 369 |
How many Ecolab patents are Alive/Dead?
How Many Patents did Ecolab File in Different Countries?
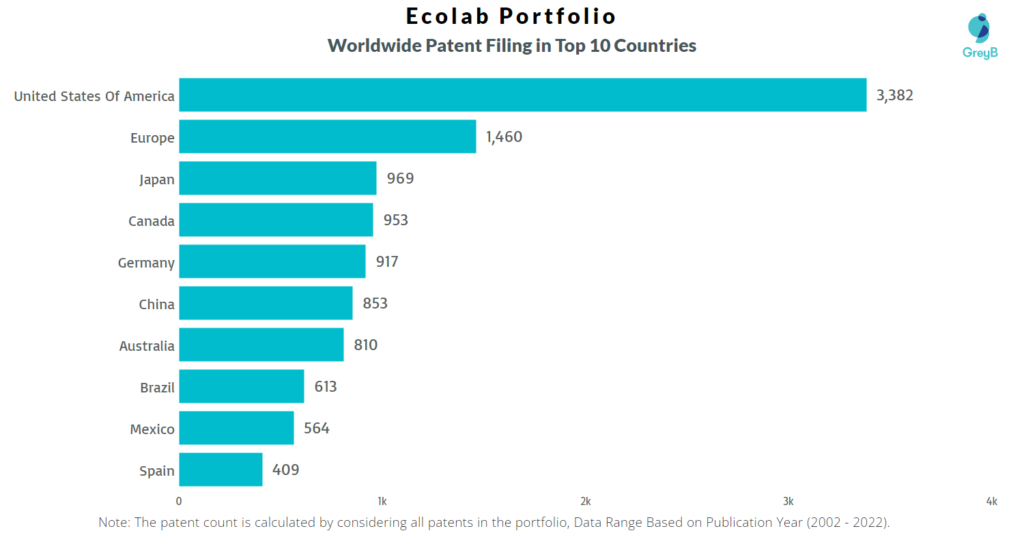
Countries in which Ecolab Filed Patents
| Country | Patents |
| United States Of America | 3382 |
| Europe | 1460 |
| Japan | 969 |
| Canada | 953 |
| Germany | 917 |
| China | 853 |
| Australia | 810 |
| Brazil | 613 |
| Mexico | 564 |
| Spain | 409 |
| India | 231 |
| Korea (South) | 228 |
| Austria | 224 |
| New Zealand | 137 |
| Russia | 132 |
| Argentina | 121 |
| Poland | 120 |
| Indonesia | 112 |
| United Kingdom | 111 |
| Denmark | 110 |
| Singapore | 90 |
| Taiwan | 80 |
| Norway | 79 |
| Italy | 65 |
| Chile | 64 |
| Malaysia | 63 |
| Saudi Arabia | 63 |
| South Africa | 60 |
| France | 49 |
| Philippines | 41 |
| Colombia | 40 |
| Hong Kong (S.A.R.) | 32 |
| Portugal | 27 |
| Peru | 20 |
| Israel | 18 |
| Africa | 14 |
| Hungary | 13 |
| Viet Nam | 12 |
| Finland | 10 |
| Gulf Cooperation Council | 10 |
| Turkey | 9 |
| Morocco | 8 |
| Macao | 8 |
| Ecuador | 7 |
| Ukraine | 7 |
| Costa Rica | 7 |
| Dominican Republic | 7 |
| Kazakhstan | 6 |
| Uruguay | 6 |
| United Arab Emirates | 6 |
| Africa | 5 |
| Czech Republic | 5 |
| Eurasia | 5 |
| Egypt | 4 |
| Croatia | 4 |
| Panama | 4 |
| Nicaragua | 4 |
| Serbia | 3 |
| Brunei | 3 |
| Azerbaijan | 3 |
| Lithuania | 2 |
| Malta | 2 |
| Albania | 2 |
| Tunisia | 2 |
| El Salvador | 2 |
| Cyprus | 2 |
| Slovenia | 2 |
| Papua New Guinea | 2 |
| Switzerland | 1 |
| Guatemala | 1 |
| Former Yugoslav Republic of Macedonia | 1 |
| Romania | 1 |
| Netherlands | 1 |
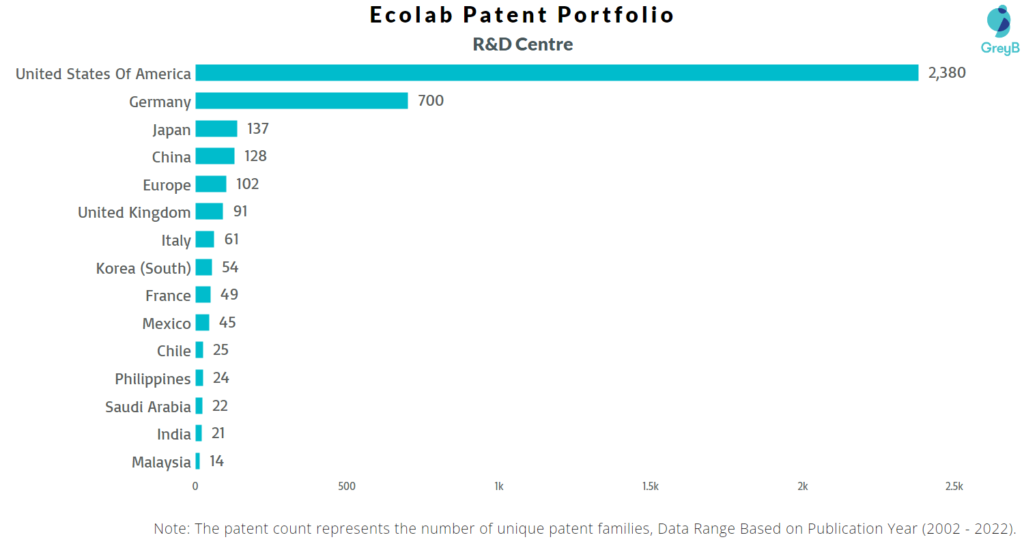
Where are the Research Centres of Ecolab Patents Located?
10 Best Ecolab Patents
US7285255B2 is the most popular patent in the Ecolab portfolio. It has received 450 citations so far from companies like Sony, Samsung, and Lexmark.
Below is the list of 10 most cited patents of Ecolab:
| Publication Number | Citation Count |
| US7285255B2 | 450 |
| US6545047B2 | 408 |
| US6426701B1 | 311 |
| US6454003B1 | 273 |
| US6391102B1 | 247 |
| US6703040B2 | 221 |
| US6627657B1 | 213 |
| US6514556B2 | 196 |
| US6693069B2 | 170 |
| US6572789B1 | 168 |
How many inventions of other companies were rejected due to Ecolab patents?
The statistics below share strategic R&D insights. It tells the companies that were trying to protect inventions similar to Ecolab invention. They couldn’t because Ecolab had protected those before them.
Examiners at the USPTO referred 1007 Ecolab patents in 4524 rejections (35 USC § 102 or 35 USC § 103 types).
The top citing companies in the Ecolab patent portfolio are Procter & Gamble, Basf, and Nalco Company.
List of the Companies whose Patents were rejected citing Ecolab –
| Company | Number of Patent Applications that faced Rejection Citing Ecolab Patents | Number of Rejections (102 & 103) |
| Procter & Gamble | 52 | 200 |
| Basf | 34 | 111 |
| Nalco Company | 21 | 97 |
| Kemira Oyj | 20 | 50 |
| Pnc Bank | 18 | 58 |
| Baker Hughes | 17 | 46 |
| Individual | 16 | 26 |
| Dow | 15 | 28 |
| Halliburton | 14 | 30 |
| Henkel | 14 | 28 |
Count of 102 and 103 Type Rejections based on Ecolab Patents
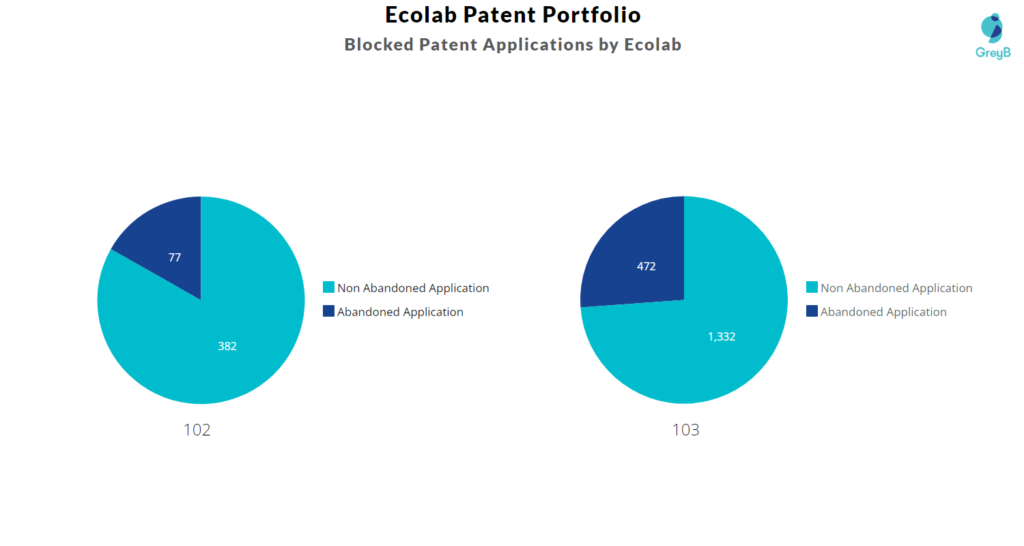
Top Ecolab Patents used in Rejecting Most Patent Applications
| Patent Number | Count of Rejected Applications |
| US7220358B2 | 13 |
| US8783511B2 | 12 |
| US7591099B2 | 12 |
| US7980023B2 | 12 |
| US6627657B1 | 11 |
| US7569532B2 | 11 |
| US6426701B1 | 11 |
| US9189818B2 | 10 |
| US8395515B2 | 10 |
| US9486007B2 | 9 |
| US8883012B2 | 9 |
| US6696067B2 | 9 |
| US8329630B2 | 8 |
| US8999175B2 | 8 |
| US7491366B2 | 8 |
What Percentage of Ecolab US Patent Applications were Granted?
Ecolab (Excluding its subsidiaries) has filed 3025 patent applications at USPTO so far (Excluding Design and PCT applications). Out of these 2266 have been granted leading to a grant rate of 83.03%.
Below are the key stats of Ecolab patent prosecution at the USPTO.

Which Law Firms Filed Most US Patents for Ecolab?
| Law Firm | Total Applications | Success Rate |
| Mckee Voorhees & Sease | 663 | 91.22% |
| Ecolab Usa | 611 | 78.40% |
| Barnes & Thornburg Ecolab | 207 | 89.20% |
| Merchant & Gould Ecolab | 195 | 91.53% |
| Nalco Company | 192 | 80.73% |
| Merchant & Gould | 172 | 77.91% |
| Leydig Voit & Mayer Ecolab Nalco | 145 | 75.71% |
| Shumaker & Sieffert | 135 | 83.19% |
| Ecolab Usa Inc Formerly With Iplm | 52 | 96.15% |
| Fredrikson & Byron | 45 | 84.21% |
