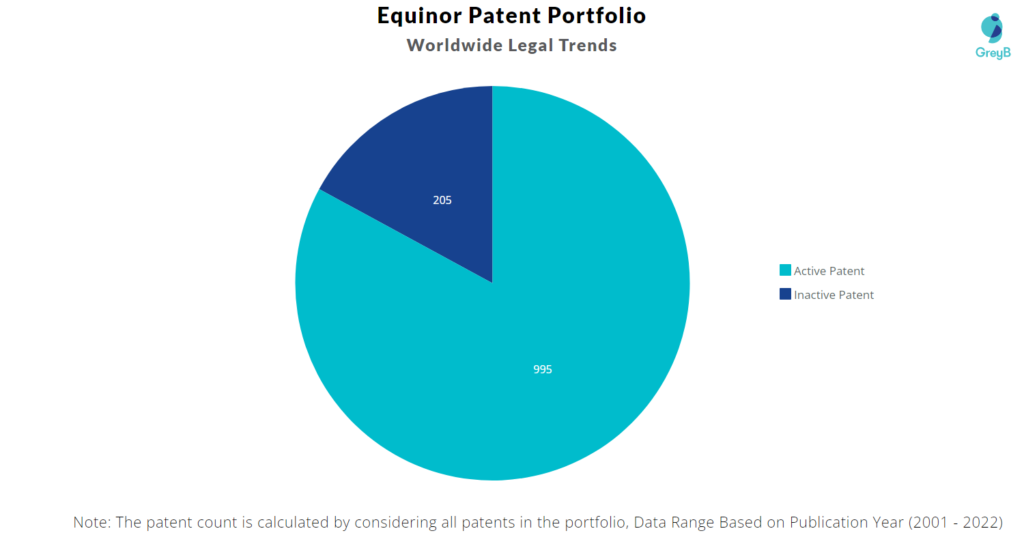
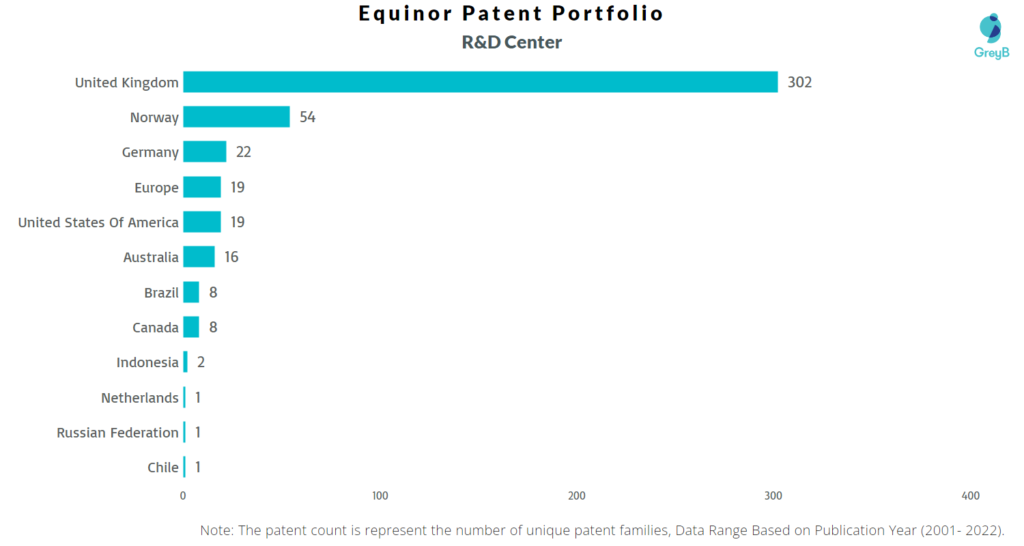
Equinor has a total of 1200 patents globally, out of which 468 have been granted. Of these 1200 patents, more than 82% patents are active. United Kingdom is where Equinor has filed the maximum number of patents, followed by Australia and USA. Parallelly, United Kingdom seems to be the main focused R&D center and Norway is the origin country of Equinor.
Equinor was founded in 1972 by Eldar Saetre. Equinor operates as an energy company. The Company develops oil, gas, wind, and solar energy projects, as well as focuses on offshore operations and exploration services. Equinor serves customers worldwide. As of February 2022, Equinor has a market cap of $97.21 Billion.
Do read about some of the most popular patents of Equinor which have been covered by us in this article and also you can find Equinor patents information, the worldwide patent filing activity and its patent filing trend over the years, and many other stats over Equinor patent portfolio.
How many patents does the CEO of Equinor have?
The CEO, Anders Opedal has 0 patents.
How many patents does Equinor have?
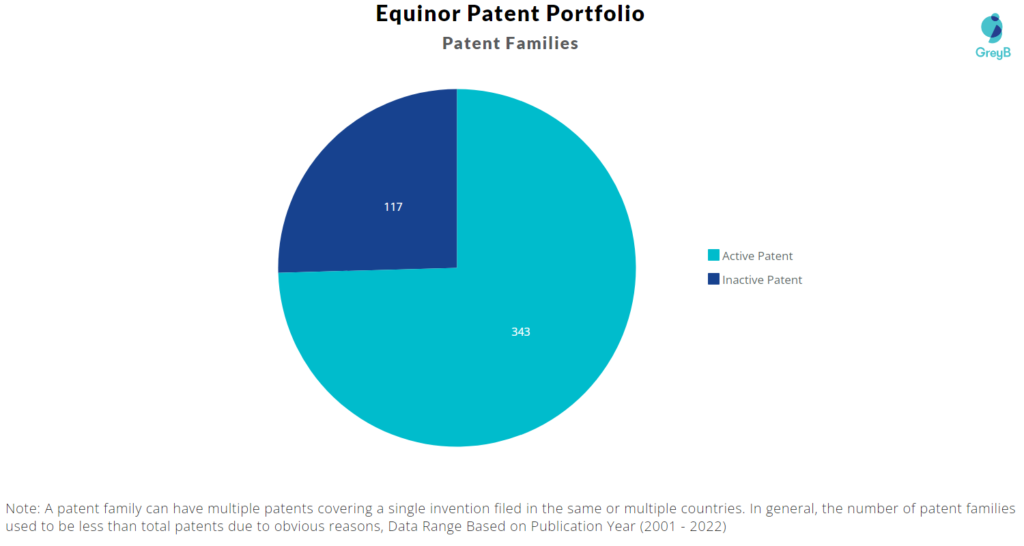
Equinor has a total of 1200 patents globally. These patents belong to 460 unique patent families. Out of 1200 patents, 995 patents are active.
How many Equinor patents are Alive/Dead?
Worldwide Patents
Patent Families
How Many Patents did Equinor File Every Year?
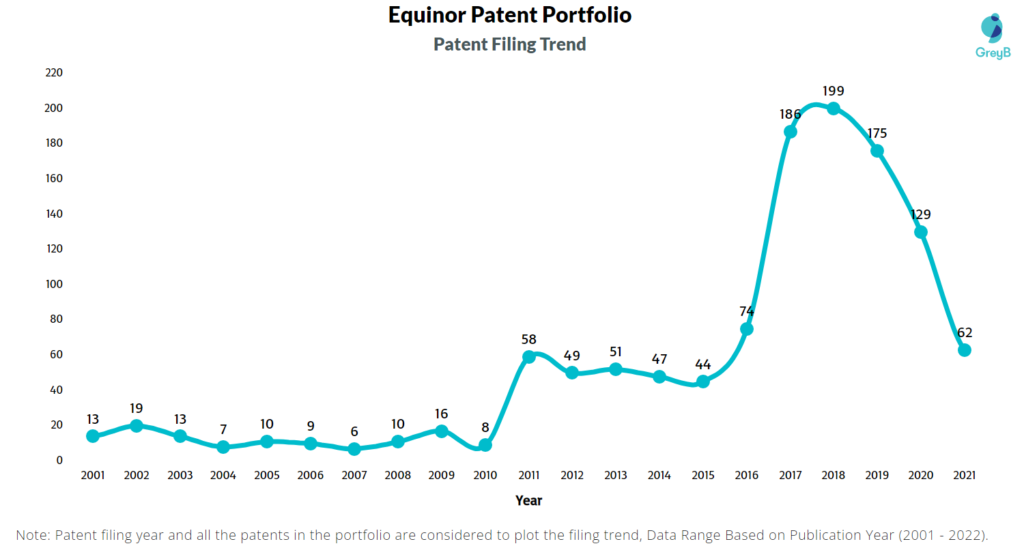
Are you wondering why there is a drop in patent filing for the last two years? It is because a patent application can take up to 18 months to get published. Certainly, it doesn’t suggest a decrease in the patent filing.
| Year of Patents Filing or Grant | Equinor Applications Filed | Equinor Patents Granted |
| 2011 | 58 | 12 |
| 2012 | 49 | 6 |
| 2013 | 51 | 7 |
| 2014 | 47 | 12 |
| 2015 | 44 | 9 |
| 2016 | 74 | 8 |
| 2017 | 186 | 12 |
| 2018 | 199 | 25 |
| 2019 | 175 | 51 |
| 2020 | 129 | 127 |
| 2021 | 62 | 143 |
| 2022 | – | 15 |
How Many Patents did Equinor File in Different Countries?
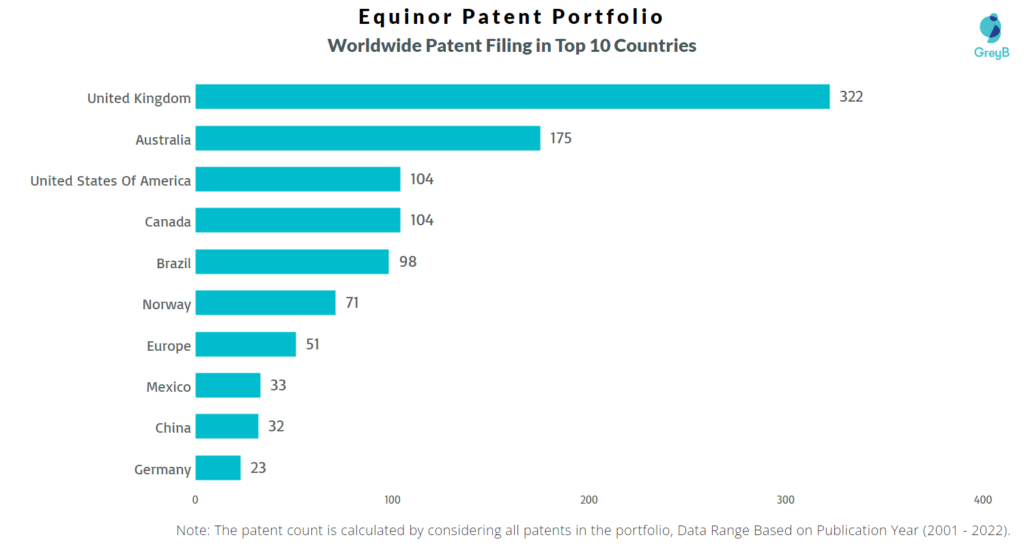
Countries in which Equinor Filed Patents
| Country | Patents |
| United Kingdom | 322 |
| Australia | 175 |
| United States Of America | 104 |
| Canada | 104 |
| Brazil | 98 |
| Norway | 71 |
| Europe | 51 |
| Mexico | 33 |
| China | 32 |
| Germany | 23 |
| Russian Federation | 16 |
| Eurasian Patent Organization | 9 |
| Denmark | 6 |
| Japan | 6 |
| Indonesia | 3 |
| Austria | 2 |
| Portugal | 2 |
| Spain | 2 |
| Chile | 1 |
| Peru | 1 |
| Saudi Arabia | 1 |
| United Arab Emirates | 1 |
Where are Research Centers of Equinor Patents Located?
What Percentage of Equinor US Patent Applications were Granted?
Equinor (Excluding its subsidiaries) has filed 84 patent applications at USPTO so far (Excluding Design and PCT applications). Out of these 48 have been granted leading to a grant rate of 96.0%.
Below are the key stats of Equinor patent prosecution at the USPTO.

Which Law Firms Filed Most US Patents for Equinor?
| Law Firm | Total Applications | Success Rate |
| Wenderoth Lind & Ponack | 27 | 100.00% |
| Birch Stewart Kolasch & Birch | 23 | 88.24% |
| Eversheds Sutherland | 15 | 100.00% |
| Banner & Witcoff Ltd | 10 | 100.00% |
| Fish & Richardson | 5 | 100.00% |
| Knobbe Martens Olson & Bear | 2 | 100.00% |
| Hershkovitz And Associates | 1 | 0% |
| Schlumberger Technology Corporation | 1 | 100.00% |
“Our strategy is backed up by clear actions to accelerate our transition while growing cash flow and returns. We are optimising our oil and gas portfolio to deliver even stronger cash flow and returns with reduced emissions from production, and we expect significant profitable growth within renewables and low carbon solutions. This is a strategy to create value as a leader in the energy transition”, says Anders Opedal, President and CEO of Equinor.
Equinor has set a clear ambition to become a net zero energy company by 2050, including emissions from production and final consumption. Today, Equinor also sets interim ambitions, aiming to reduce net carbon intensity with 20% by 2030 and 40% by 2035.
“This is a business strategy to ensure long-term competitiveness during a period with profound changes in the energy systems, as society moves towards net zero. We are building on our position as a global leader within carbon efficient production of oil and gas. We will continue to cut emissions, and in the longer term, Equinor expects to produce less oil and gas than today recognising reducing demand. Significant growth within renewables and low carbon solutions will increase the pace of change towards 2030 and 2035”, says Opedal.
Key highlights from the strategy update:
- Accelerating the transition and setting an ambition to reach a 40% reduction in net carbon intensity by 2035, on the way towards net zero by 2050.
- Stepping up investments in renewables and low carbon solutions to more than 50% of gross annual(1) investments by 2030.
- Growing cash flow and returns, expecting a free cash flow(2) of around USD 35 billion(3) before capital distribution in 2021 – 2026 and around 12%(3) return on average capital employed(2) in 2021 – 2030.
- Increasing the quarterly cash dividend to 18 cents per share and introducing new share buy-back programme.
EXCLUSIVE INSIGHTS COMING SOON!
What are Equinor‘s key innovation segments?
What Technologies are Covered by Equinor?

The chart below distributes patents filed by Equinor in different countries on the basis of the technology protected in patents. It also represents the markets where Equinor thinks it’s important to protect particular technology inventions.

R&D Focus: How Equinor search focus changed over the years?

EXCLUSIVE INSIGHTS COMING SOON!
Interested in knowing about the areas of innovation that are being protected by Equinor?
