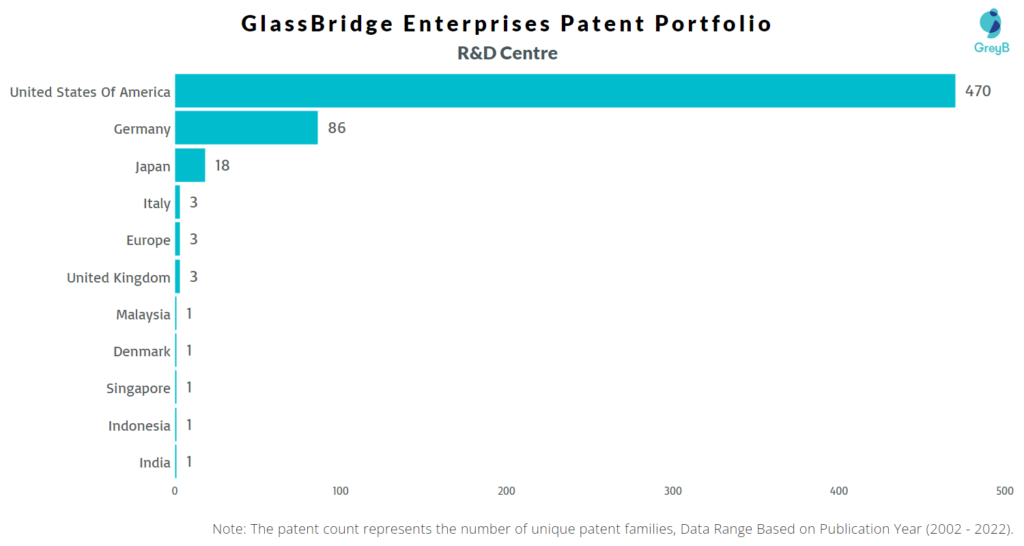
GlassBridge Enterprises has a total of 1097 patents globally, out of which 474 have been granted. Of these 1097 patents, more than 39% patents are active. The United States of America is where GlassBridge Enterprises has filed the maximum number of patents, followed by Japan and Germany. Parallelly, United States of America seems to be the main focused R&D centre and also is the origin country of GlassBridge Enterprises.
GlassBridge Enterprises was founded in 1996. GlassBridge Enterprises operates as a holding company. The Company, through its subsidiaries, explores a diverse range of new strategic asset management business opportunities for its portfolio. GlassBridge Enterprises offers its services in the United States. As of September 2022, GlassBridge Enterprises has a market cap of $880.95 thousand.
Do read about some of the most popular patents of GlassBridge Enterprises which have been covered by us in this article and also you can find GlassBridge Enterprises patents information, the worldwide patent filing activity and its patent filing trend over the years, and many other stats over GlassBridge Enterprises patent portfolio.
How many patents does the CEO of GlassBridge Enterprises have?
The CEO Daniel A. Strauss has 0 patents.
How many patents does GlassBridge Enterprises have?
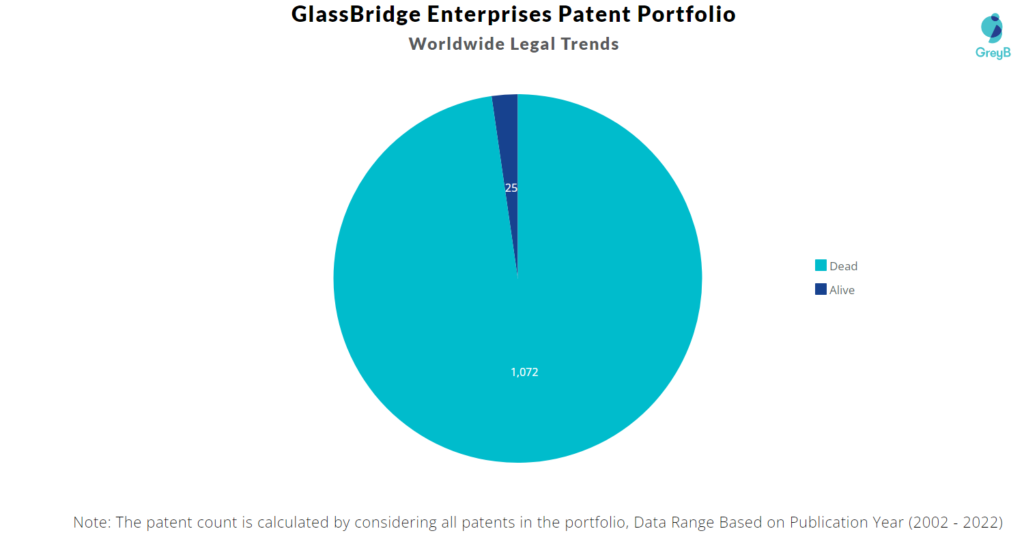
GlassBridge Enterprises has a total of 1097 patents globally. These patents belong to 589 unique patent families. Out of 1097 patents, 25 patents are active.
How Many Patents did GlassBridge Enterprises File Every Year?
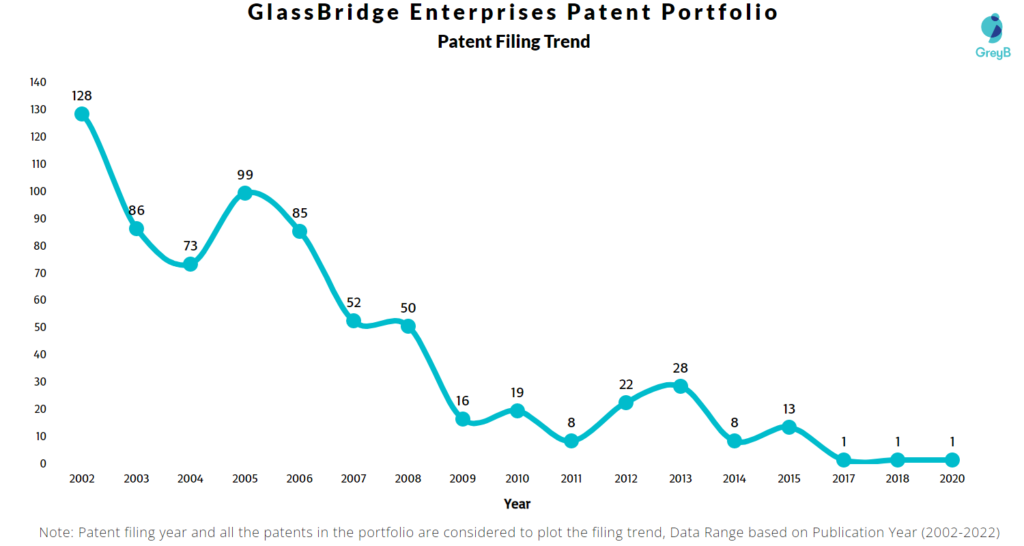
Are you wondering why there is a drop in patent filing for the last two years? It is because a patent application can take up to 18 months to get published. Certainly, it doesn’t suggest a decrease in the patent filing.
| Year of Patents Filing or Grant | GlassBridge Enterprises Applications Filed | GlassBridge Enterprises Patents Granted |
| 2011 | 8 | 12 |
| 2012 | 22 | 12 |
| 2013 | 28 | 12 |
| 2014 | 8 | 13 |
| 2015 | 13 | 11 |
| 2016 | – | 2 |
| 2017 | 1 | 1 |
| 2018 | 1 | – |
| 2020 | 1 | 1 |
How many GlassBridge Enterprises patents are Alive/Dead?
Worldwide Patents
How Many Patents did GlassBridge Enterprises File in Different Countries?
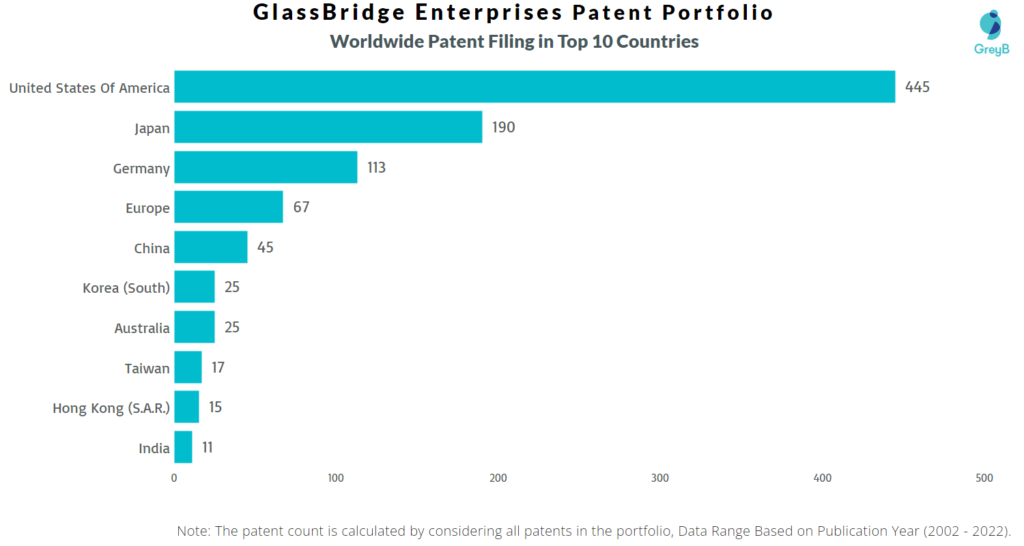
Countries in which GlassBridge Enterprises Filed Patents
| Country | Patents |
| United States Of America | 445 |
| Japan | 190 |
| Germany | 113 |
| Europe | 67 |
| China | 45 |
| Korea (South) | 25 |
| Australia | 25 |
| Taiwan | 17 |
| Hong Kong (S.A.R.) | 15 |
| India | 11 |
| Russia | 10 |
| Brazil | 9 |
| Canada | 7 |
| Austria | 6 |
| Singapore | 5 |
| United Kingdom | 4 |
| Italy | 4 |
| Mexico | 3 |
| Norway | 3 |
| Ukraine | 2 |
| Eurasia | 2 |
| Malaysia | 2 |
| Indonesia | 1 |
| Sweden | 1 |
| Spain | 1 |
| Denmark | 1 |
| Poland | 1 |
Where are Research Centers of GlassBridge Enterprises Patents Located?
10 Best GlassBridge Enterprises Patents
US20030018657A1 is the most popular patent in the GlassBridge Enterprises portfolio. It has received 293 citations so far from companies like Voom Technologies, IBM, and Microsoft Corporation.
Below is the list of 10 most cited patents of GlassBridge Enterprises:
| Publication Number | Citation Count |
| US20030018657A1 | 293 |
| US20130219164A1 | 284 |
| US20020133539A1 | 264 |
| US20090105548A1 | 250 |
| US6883718B1 | 217 |
| US20130174214A1 | 214 |
| US6908038B1 | 180 |
| US6738259B2 | 133 |
| USD522598S1 | 131 |
| USD556194S1 | 126 |
Which Companies are using GlassBridge Enterprises Patents to Advance their Research?
If patents or patents from a particular technology area of a company receive a lot of citations, it implies that the technology is being followed and incrementally innovated by the citing companies. It also indicates that citing companies are working on similar and closely related technologies.
The top citing companies in the GlassBridge Enterprises patent portfolio are General Electric, IBM and Samsung Electronics.
List of the top forward citing Companies –
| Company | Number of Patents |
| General Electric | 18 |
| IBM | 17 |
| Samsung Electronics | 14 |
| Intel | 13 |
| Texas Instruments | 11 |
| National Science Foundation | 11 |
| JP Morgan Chase Bank | 11 |
| Huawei | 10 |
| Apple | 9 |
| Infineon Technologies Austria | 9 |
Count of 102 and 103 Type Rejections based on GlassBridge Enterprises Patents
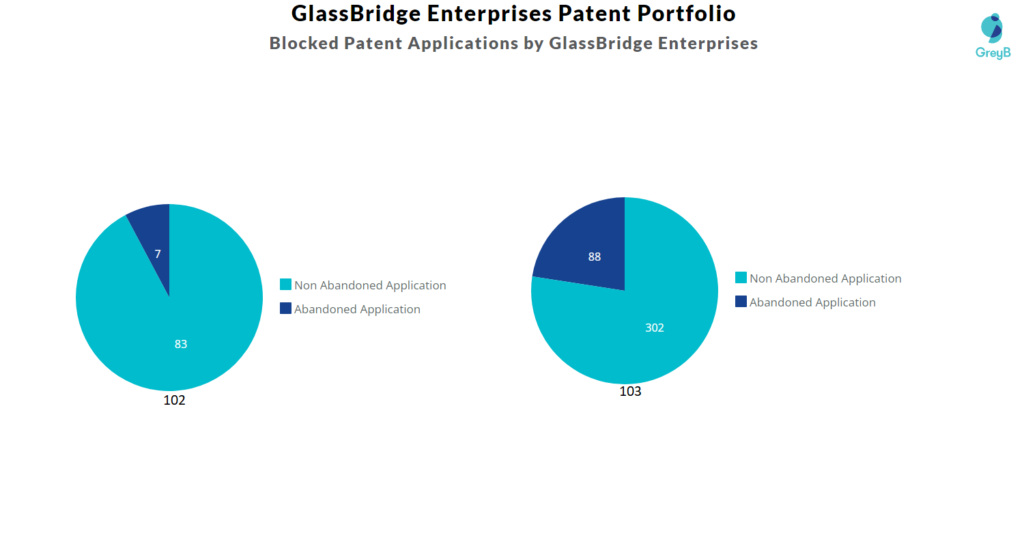
Top GlassBridge Enterprises Patents used in Rejecting Most Patent Applications
| Patent Number | Count of Rejected Applications |
| US7746041B2 | 19 |
| US7877621B2 | 18 |
| US7054513B2 | 17 |
| US20120265050A1 | 16 |
| US9262632B2 | 16 |
| US9071141B2 | 15 |
| US7071660B2 | 14 |
| US7518886B1 | 14 |
| US9418503B2 | 13 |
| US8862206B2 | 12 |
| US8257795B2 | 12 |
| US20070183920A1 | 11 |
| US20070022877A1 | 10 |
| US8350771B1 | 10 |
| US8784566B2 | 10 |
What Percentage of GlassBridge Enterprises US Patent Applications were Granted?
GlassBridge Enterprises (Excluding its subsidiaries) has filed 639 patent applications at USPTO so far (Excluding Design and PCT applications). Out of these 447 have been granted leading to a grant rate of 77.74%.
Below are the key stats of GlassBridge Enterprises patent prosecution at the USPTO.

Which Law Firms Filed Most US Patents for GlassBridge Enterprises?
| Law Firm | Total Applications | Success Rate |
| W&C Ip | 142 | 65.71% |
| GlassBridge Enterprises | 122 | 100.00% |
| Blank Rome Llp | 50 | 57.78% |
| New River Valley Intellectual | 37 | 0.00% |
| Thomas Horstemeyer Llp | 31 | 90.48% |
| Keith A Vogt Esq | 17 | 68.75% |
| Fish & Richardson P C Dc | 16 | 100.00% |
| Armstrong Teasdale Llp | 10 | 100.00% |
| Fish & Richardson | 10 | 80.00% |
| Anne M Rosenblum Esq | 8 | 66.67% |
EXCLUSIVE INSIGHTS COMING SOON!
