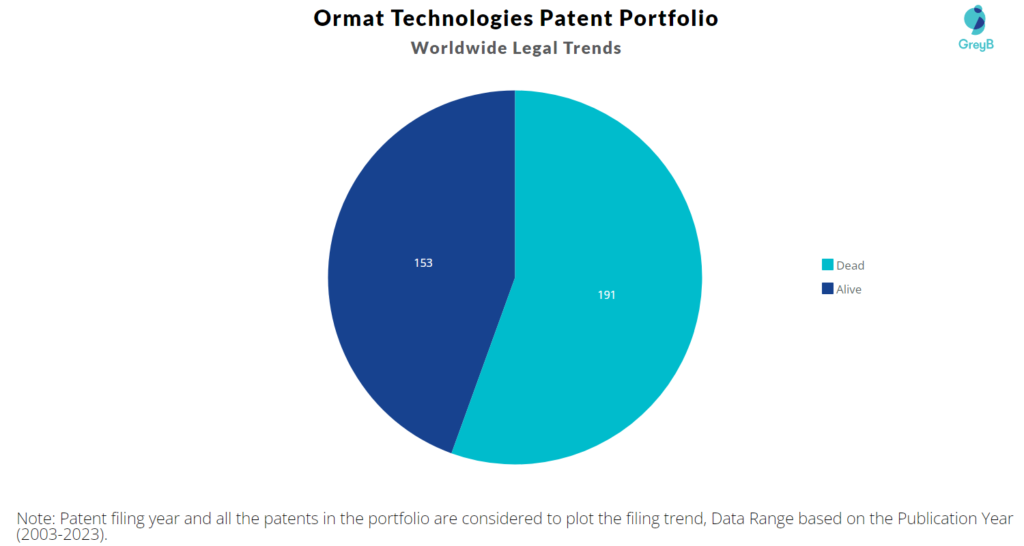
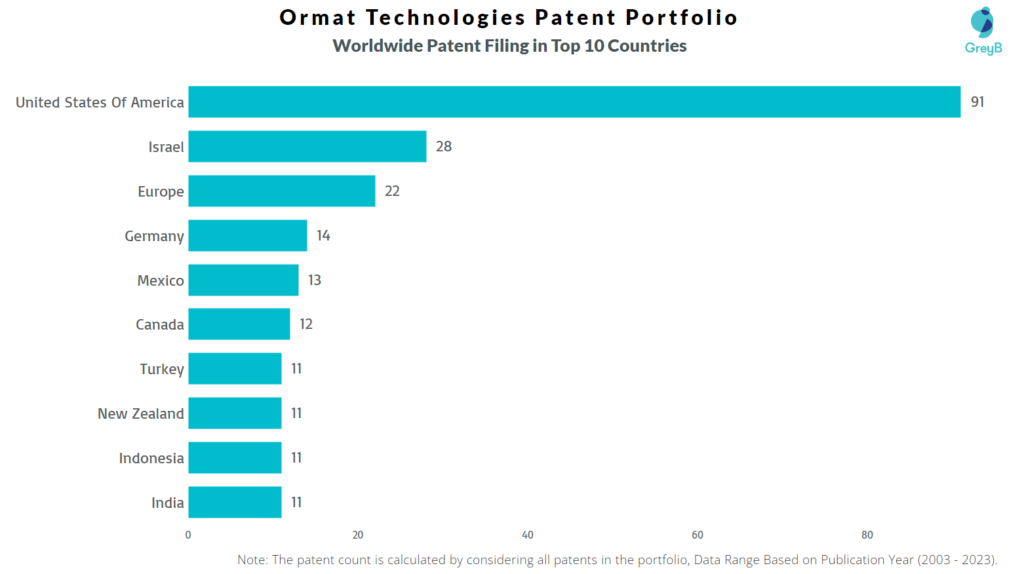
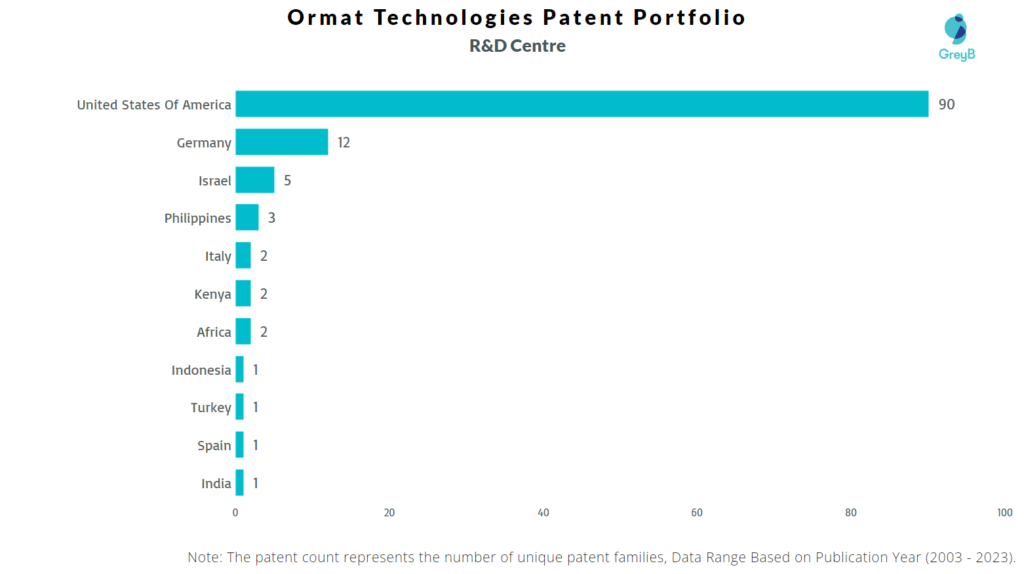
Ormat Technologies has a total of 344 patents globally, out of which 202 have been granted. Of these 344 patents, more than 44% patents are active. The United States of America is where Ormat Technologies has filed the maximum number of patents, followed by Israel and Europe. Parallelly, The United States of America seems to be the main focused R&D center and also USA is the origin country of Ormat Technologies.
Ormat Technologies was founded in 1965. The Company develops and operates renewable energy projects. The Company offers geothermal, recovered energy and energy management and storage solutions.
Do read about some of the most popular patents of Ormat Technologies which have been covered by us in this article and also you can find Ormat Technologies patents information, the worldwide patent filing activity and its patent filing trend over the years, and many other stats over Ormat Technologies patent portfolio.
How many patents does the Founder and CEO of Ormat Technologies have?
The Founder Yehuda Bronicki has 0 patent and the CEO Isaac Angel have 0 patent.
How many patents does Ormat Technologies have?
Ormat Technologies has a total of 344 patents globally. These patents belong to 121 unique patent families. Out of 344 patents, 153 patents are active.
How Many Patents did Ormat Technologies File Every Year?
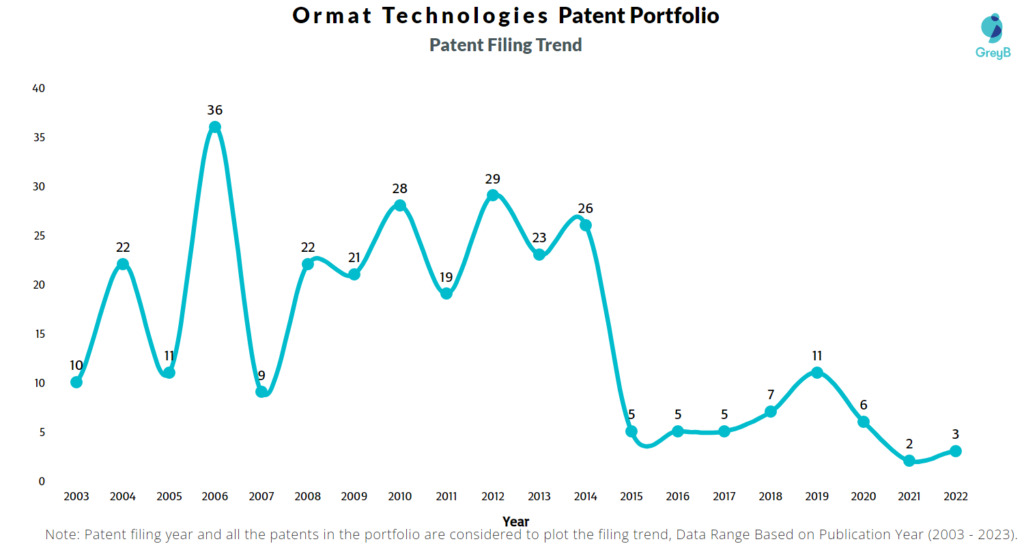
Are you wondering why there is a drop in patent filing for the last two years? It is because a patent application can take up to 18 months to get published. Certainly, it doesn’t suggest a decrease in the patent filing.
| Year of Patents Filing or Grant | Ormat Technologies Applications Filed | Ormat Technologies Patents Granted |
| 2023 | – | 4 |
| 2022 | 3 | 1 |
| 2021 | 2 | 7 |
| 2020 | 6 | 9 |
| 2019 | 11 | 14 |
| 2018 | 7 | 16 |
| 2017 | 5 | 16 |
| 2016 | 5 | 18 |
| 2015 | 5 | 12 |
| 2014 | 26 | 11 |
| 2013 | 23 | 14 |
| 2012 | 29 | 11 |
How many Ormat Technologies patents are Alive/Dead?
Worldwide Patents
How Many Patents did Ormat Technologies File in Different Countries?
Countries in which Ormat Technologies Filed Patents
| Country | Patents |
| United States Of America | 91 |
| Israel | 28 |
| Europe | 22 |
| Germany | 14 |
| Mexico | 13 |
| Canada | 12 |
| Turkey | 11 |
| New Zealand | 11 |
| Indonesia | 11 |
| India | 11 |
| Australia | 8 |
| Brazil | 6 |
| Russia | 6 |
| Philippines | 5 |
| China | 5 |
| Austria | 5 |
| Spain | 5 |
| Korea (South) | 5 |
| Africa | 4 |
| Portugal | 4 |
| South Africa | 3 |
| Japan | 2 |
| Kenya | 2 |
| Iceland | 2 |
| Italy | 2 |
| Croatia | 1 |
| Egypt | 1 |
| Eurasia | 1 |
Where are Research Centers of Ormat Technologies Patents Located?
10 Best Ormat Technologies Patents
US6571548B1 is the most popular patent in the Ormat Technologies portfolio. It has received 240 citations so far from companies like Carrier Corporation, Utc Power and Caterpillar.
Below is the list of 10 most cited patents of Ormat Technologies:
| Publication Number | Citation Count |
| US6571548B1 | 240 |
| US20130245847A1 | 123 |
| US6510695B1 | 106 |
| US7340897B2 | 91 |
| US7225621B2 | 89 |
| US6832485B2 | 80 |
| WO2012145563A1 | 76 |
| US6883328B2 | 62 |
| US6960839B2 | 61 |
| US6694738B2 | 60 |
How many inventions of other companies were rejected due to Ormat Technologies patents?
The statistics below share strategic R&D insights. It tells the companies that were trying to protect inventions similar to Ormat Technologies invention. They couldn’t because Ormat Technologies had protected those before them.
Examiners at the USPTO referred 50 Ormat Technologies patents in 263 rejections (35 USC § 102 or 35 USC § 103 types).
The top citing companies in the Ormat Technologies patent portfolio are General Electric, Pyrogenesis and Bitzer.
List of the Companies whose Patents were rejected citing Ormat Technologies –
| Company | Number of Patent Applications that faced Rejection Citing Ormat Technologies Patents | Number of Rejections (102 & 103) |
| General Electric | 14 | 27 |
| Pyrogenesis | 4 | 15 |
| Bitzer | 4 | 6 |
| Siemens | 4 | 10 |
| Cummins | 3 | 8 |
| Nuovo Pignone Technologie | 3 | 4 |
| Mitsubishi Heavy Industries | 3 | 4 |
| Halliburton Energy Services | 3 | 3 |
| Kyocera | 3 | 6 |
| Tas Energy | 2 | 4 |
Count of 102 and 103 Type Rejections based on Ormat Technologies Patents

Top Ormat Technologies Patents used in Rejecting Most Patent Applications
| Patent Number | Count of Rejected Applications |
| US8181463B2 | 11 |
| US20130245847A1 | 7 |
| US6539723B2 | 7 |
| US6571548B1 | 7 |
| US8438849B2 | 6 |
| US20140316973A1 | 6 |
| US6510695B1 | 6 |
| US6832485B2 | 5 |
| US7493763B2 | 5 |
| US8655498B2 | 4 |
| US8061139B2 | 4 |
| US9212544B2 | 4 |
| US7225621B2 | 4 |
| US6539718B2 | 4 |
| US6981378B2 | 3 |
What Percentage of Ormat Technologies US Patent Applications were Granted?
Ormat Technologies (Excluding its subsidiaries) has filed 79 patent applications at USPTO so far (Excluding Design and PCT applications). Out of these 73 have been granted leading to a grant rate of 93.59%.
Below are the key stats of Ormat Technologies patent prosecution at the USPTO.

Which Law Firms Filed Most US Patents for Ormat Technologies?
| Law Firm | Total Applications | Success Rate |
| Nath Goldberg & Meyer | 45 | 88.89% |
| Oblon Mcclelland Maier & Neustadt | 23 | 100.00% |
| Donald M Sandler | 9 | 100.00% |
| Fenwick & West | 1 | 0% |
| Nath & Associates | 1 | 100.00% |
hat are Ormat Technologies key innovation segments?
What Technologies are Covered by Ormat Technologies?
The chart below distributes patents filed by Ormat Technologies
