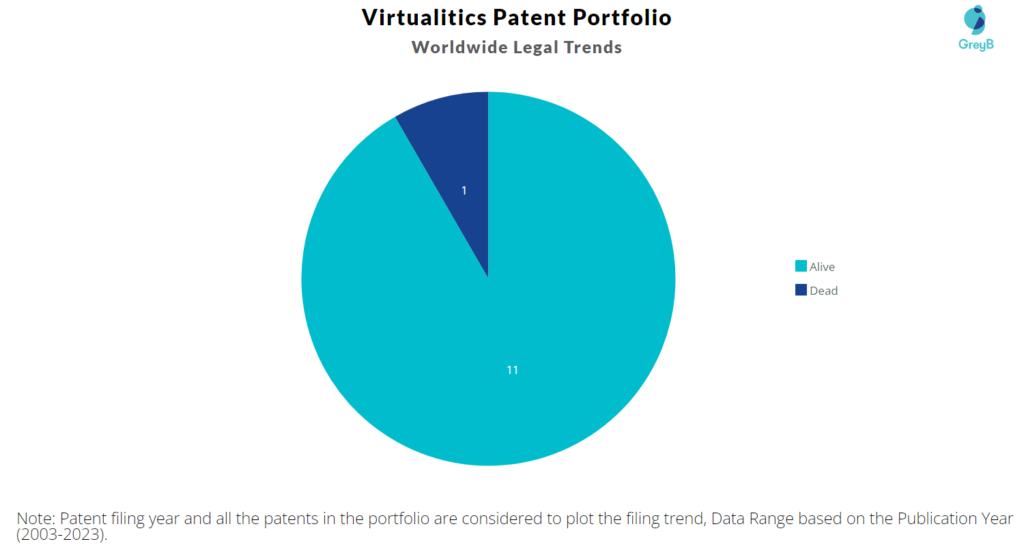
Virtualitics has a total of 12 patents globally, out of which 5 have been granted. Of these 12 patents, more than 91% patents are active. The United States of America is where Virtualitics has filed all their patents. Parallelly, United States of America seems to be the main focused R&D centre and also is the origin country of Virtualitics.
Virtualitics was founded in 2015. Virtualitics operates as a data visualization company. The company uses a combination of artificial intelligence, big data, and virtual and augmented reality to extract insights from large and complicated data sets.
Do read about some of the most popular patents of Virtualitics which have been covered by us in this article and also you can find Virtualitics patents information, the worldwide patent filing activity and its patent filing trend over the years, and many other stats over Virtualitics patent portfolio.
How many patents do the Founder and CEO of Virtualitics have?
The Founder Ciro Donalek, George Djorgovski, Michael Amori (Also CEO), Scott Davidoff have 26, 0, 21, 6 patents.
How many patents does Virtualitics have?
Virtualitics has a total of 12 patents globally. These patents belong to 7 unique patent families. Out of 12 patents, 11 patents are active.
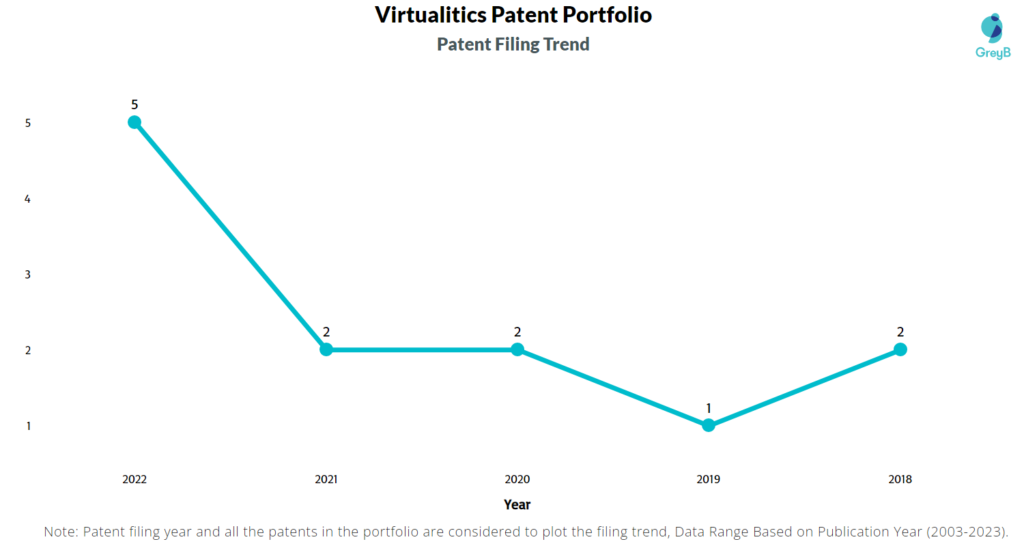
How Many Patents did Virtualitics File Every Year?

Are you wondering why there is a drop in patent filing for the last two years? It is because a patent application can take up to 18 months to get published. Certainly, it doesn’t suggest a decrease in the patent filing.
| Year of Patents Filing or Grant | Virtualitics Applications Filed | Virtualitics Patents Granted |
| 2022 | 5 | 2 |
| 2021 | 2 | – |
| 2020 | 2 | 2 |
| 2019 | 1 | 1 |
| 2018 | 2 | – |
How many Virtualitics patents are Alive/Dead?

How Many Patents did Virtualitics File in Different Countries?
Virtualitics filled all their patents in United States of America.
Where are Research Centers of Virtualitics Patents Located?
The Research Center of Virtualitics Patents is the United States of America.
List of Virtualitics Patents
| Virtualitics Patent | Title |
| US11481939B2 | Systems And Methods For 3D Data Visualization And Network Extraction |
| US11455759B2 | Systems And Methods For High Dimensional 3D Data Visualization |
| US10872446B2 | Systems And Methods For High Dimensional 3D Data Visualization |
| US10621762B2 | Systems And Methods For High Dimensional 3D Data Visualization |
| US10454597B1 | Systems And Methods For Locating Telecommunication Cell Sites |
| US20230137890A1 | Systems And Methods For 3D Data Visualization And Network Extraction |
| US20230077998A1 | Systems And Methods For Smart Instance Selection |
| US20230013873A1 | Systems And Methods For High Dimensional 3D Data Visualization |
| US20230004557A1 | Systems And Methods For Network Explainability |
| US20220342873A1 | Systems And Methods For Natural Language Querying |
| US20210318851A1 | Systems And Methods For Dataset Merging Using Flow Structures |
| WO2019221767A1 | Systems And Methods For High Dimensional 3D Data Visualization |
What are Virtualitics key innovation segments?
What Technologies are Covered by Virtualitics?

The chart below distributes patents filed by Virtualitics
