Trelleborg has a total of 4626 patents globally, out of which 2343 have been granted. Of these 4626 patents, more than 34% patents are active. The Japan is where Trelleborg has filed the maximum number of patents, followed by United States of America and Europe. Parallelly, Japan seems to be the main focused R&D centre and also Europe is the origin country of Trelleborg.
Trelleborg was founded in 1905 by Henry Dunker and Johan Kock. Trelleborg AB manufactures and distributes industrial products. The Company produces noise suppression and anti-vibration systems for the automobile industry and complete wheel systems for forest and farm machines and other equipment. As of August 2022, Trelleborg has a market cap of $ 58.913 Billion.
Do read about some of the most popular patents of Trelleborg which have been covered by us in this article and also you can find Trelleborg patents information, the worldwide patent filing activity and its patent filing trend over the years, and many other stats over Trelleborg patent portfolio.
How many patents does the Founder and CEO of Trelleborg have?
The Founder Henry Dunker have 83 patents and Johan Kock have 23 patents and CEO Peter Nilsson have 730 patents.
How many patents does Trelleborg have?
Trelleborg has a total of 4626 patents globally. These patents belong to 2743 unique patent families. Out of 4626 patents, 1575 patents are active.
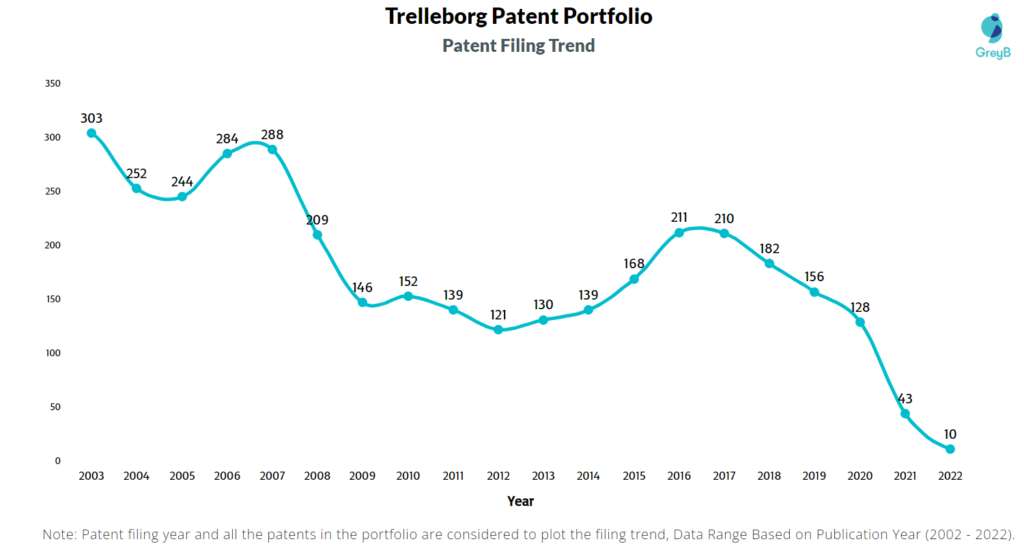
How Many Patents did Trelleborg File Every Year?

Are you wondering why there is a drop in patent filing for the last two years? It is because a patent application can take up to 18 months to get published. Certainly, it doesn’t suggest a decrease in the patent filing.
| Year of Patents Filing or Grant | Trelleborg Applications Filed | Trelleborg Patents Granted |
| 2011 | 139 | 107 |
| 2012 | 121 | 127 |
| 2013 | 130 | 86 |
| 2014 | 139 | 104 |
| 2015 | 168 | 98 |
| 2016 | 211 | 104 |
| 2017 | 210 | 118 |
| 2018 | 182 | 121 |
| 2019 | 156 | 149 |
| 2020 | 128 | 123 |
| 2021 | 43 | 100 |
| 2022 | 10 | 85 |
How many Trelleborg patents are Alive/Dead?
Worldwide Patents

How Many Patents did Trelleborg File in Different Countries?

Countries in which Trelleborg Filed Patents
| Country | Patent |
| Japan | 1970 |
| United States Of America | 603 |
| Europe | 296 |
| Germany | 279 |
| China | 172 |
| Korea | 161 |
| Australia | 89 |
| Taiwan | 82 |
| United Kingdom | 78 |
| Canada | 76 |
| Brazil | 74 |
| Spain | 71 |
| India | 50 |
| Denmark | 39 |
| Austria | 36 |
| France | 33 |
| Italy | 32 |
| Singapore | 28 |
| Malaysia | 27 |
| Poland | 21 |
| Sweden | 20 |
| Mexico | 18 |
| Hungary | 15 |
| Russia | 15 |
| Hong Kong | 14 |
| Norway | 14 |
| Israel | 13 |
| South Africa | 10 |
| Portugal | 10 |
| Thailand | 8 |
| Netherlands | 7 |
| Indonesia | 6 |
| Argentina | 6 |
| Czech Republic | 4 |
| Malta | 3 |
| Slovenia | 3 |
| Finland | 3 |
| Costa Rica | 3 |
| Turkey | 2 |
| Eurasia | 2 |
| Lithuania | 2 |
| Croatia | 1 |
| Belgium | 1 |
| Philippines | 1 |
| Pakistan | 1 |
| New Zealand | 1 |
Where are Research Centers of Trelleborg Patents Located?

10 Best Trelleborg Patents
US7393418B2 is the most popular patent in the Trelleborg portfolio. It has received 279 citations so far from companies like Applied Materials, Asm Ip Holding, Taiwan Semiconductor Manufacturing Company.
Below is the list of 10 most cited patents of Trelleborg:
| Publication Number | Citation Count |
| US7393418B2 | 279 |
| US6340648B1 | 220 |
| US6430444B1 | 196 |
| US20130164498A1 | 157 |
| US20040209209A1 | 125 |
| US6394141B2 | 103 |
| US6407371B1 | 100 |
| JP2003081654A | 89 |
| US6616767B2 | 83 |
| US20020193723A1 | 82 |
Which Companies are using Trelleborg Patents to Advance their Research?
If patents or patents from a particular technology area of a company receive a lot of citations, it implies that the technology is being followed and incrementally innovated by the citing companies. It also indicates that citing companies are working on similar and closely related technologies.
The top citing companies in the Trelleborg patent portfolio are Applied Materials, Applied Materials and Tokyo Electron Limited.
List of the top forward citing Companies –
| Company | Number of Patents |
| Applied Materials | 18 |
| Boeing | 11 |
| Tokyo Electron Limited | 10 |
| Sumco Corporation | 8 |
| General Electric | 5 |
| Coorstek Kk | 5 |
| Coorstek | 5 |
| Viv Solutions Llc | 5 |
| Ngk | 4 |
| Robert Bosch Gmbh | 4 |
Count of 102 and 103 Type Rejections based on Trelleborg Patents

Top Trelleborg Patents used in Rejecting Most Patent Applications
| Patent Number | Count of Rejected Applications |
| US6616767B2 | 20 |
| US20040058603A1 | 12 |
| US8212288B2 | 9 |
| US7063118B2 | 8 |
| US7175911B2 | 8 |
| US6933254B2 | 7 |
| US7100641B2 | 7 |
| US7293590B2 | 7 |
| US8215646B2 | 6 |
| US7685838B2 | 5 |
| US6755595B2 | 5 |
| US7069836B1 | 5 |
| US20130164498A1 | 5 |
| US9568139B2 | 5 |
| US6363098B1 | 5 |
What Percentage of Trelleborg US Patent Applications were Granted?
Trelleborg (Excluding its subsidiaries) has filed 12 patent applications at USPTO so far (Excluding Design and PCT applications). Out of these 9 have been granted leading to a grant rate of 75%.
Below are the key stats of Trelleborg patent prosecution at the USPTO.

Which Law Firms Filed Most US Patents for Trelleborg?
| Law Firm | Total Applications | Success Rate |
| Buchanan Ingersoll & Rooney | 4 | 75.00% |
| Leydig Voit & Mayer Ltd | 2 | 100.00% |
| Locke Lord Llp | 2 | 50.00% |
| Harness Dickey & Pierce PLC | 1 | 100.00% |
| Moser Taboada Ansell Limited | 1 | 100.00% |
| Nils H Ljungman & Associates | 1 | 100.00% |
| Sand & Sebolt | 1 | 0.00% |
EXCLUSIVE INSIGHTS COMING SOON!
What are Trelleborg’s key innovation segments?
What Technologies are Covered by Trelleborg’s?

The chart below distributes patents filed by Trelleborg’s in different countries on the basis of the technology protected in patents. It also represents the markets where Trelleborg’s thinks it’s important to protect particular technology inventions.

R&D Focus: How Trelleborg’s search focus changed over the years?

EXCLUSIVE INSIGHTS COMING SOON!
Interested in knowing about the areas of innovation that are being protected by Trelleborg’s?
