Microsoft: “Be what’s next” is an American multinational computer technology corporation founded in the year 1975. Formed by Harvard College dropout, Bill Gates and his childhood friend Paul Allen, Microsoft has now become the biggest and one of the most valuable software companies. Its innovation focus, ranging from operating systems, security, productivity, and cloud computing to emerging technologies like AI, mixed reality, and quantum computing. You can find Microsoft’s patents information, the worldwide patent filing activity and its patent filing trend over the years, and many other stats over Microsoft’s patent portfolio.
Satya Nadella is the executive chairman and CEO of Microsoft, succeeding Steve Ballmer in 2014 as CEO and John W. Thompson in 2021 as chairman. You can also read our analysis on, Satya Nadella’s Patents and Inventions.
Microsoft has a total of 124462 patents globally, out of which 62298 have been granted. Of these 124462 patents, more than 64% patents are active. United States of America is where Microsoft has filed the maximum number of patents, followed by Europe (EPO) and China. Parallelly, United States of America seems to be the main focused R&D centre and also is the origin country of Microsoft.
Do read about some of the most popular patents of Microsoft which have been covered by us in this article and also you can find Microsoft patents information, the worldwide patent filing activity and its patent filing trend over the years, and many other stats over Microsoft patent portfolio.
Microsoft Innovation Prediction Roadmap: 2025–2030

The insights and projections presented in this article are based on predictive analysis, current patent analysis that have been done, and publicly available information as of 2025. While care has been taken to ensure accuracy, the forward-looking statements are speculative and should not be interpreted as definitive strategic actions by Microsoft or its affiliates. This content is intended for informational and research purposes only and does not constitute legal, financial, or investment advice.
Keep track of every patent move and monitor competitor activity in real-time. Click here for full insights:
How many patents does Microsoft have?
Microsoft has a total of 124462 patents globally. These patents belong to 72371 unique patent families. Out of 124462 patents, 81287 patents are active.
How Many Patents did Microsoft File Every Year?

Are you wondering why there is a drop in patent filing for the last two years? It is because a patent application can take up to 18 months to get published. Certainly, it doesn’t suggest a decrease in the patent filing.
| Year of Patents Filing or Grant | Microsoft Applications Filed | Microsoft Patents Granted |
| 2026 | 11 | 1340 |
| 2025 | 1245 | 3769 |
| 2024 | 4247 | 4465 |
| 2023 | 6197 | 2849 |
| 2022 | 8620 | 4351 |
| 2021 | 6392 | 4887 |
| 2020 | 7517 | 4423 |
| 2019 | 7950 | 4262 |
| 2018 | 6690 | 3069 |
| 2017 | 7378 | 3383 |
How many Microsoft patents are Alive/Dead?
Worldwide Patents

How Many Patents did Microsoft File in Different Countries?

Countries in which Microsoft Filed Patents
| Country | Patents |
| United States of America | 47692 |
| Europe (EPO) | 16085 |
| China | 13233 |
| India | 4850 |
| Japan | 4511 |
| Germany | 4456 |
| Korea (South) | 3834 |
| Canada | 2032 |
| Brazil | 1933 |
| Australia | 1496 |
| Taiwan | 1470 |
| Russia | 1280 |
| Hong Kong (S.A.R.) | 1190 |
| Mexico | 1188 |
| United Kingdom | 630 |
| South Africa | 533 |
| Singapore | 443 |
| Malaysia | 433 |
| Israel | 394 |
| Austria | 305 |
| Indonesia | 286 |
| Spain | 276 |
| Philippines | 190 |
| Thailand | 168 |
| Chile | 154 |
| Argentina | 122 |
| New Zealand | 115 |
| Netherlands | 84 |
| Luxembourg | 84 |
| Colombia | 77 |
| Italy | 64 |
| Norway | 58 |
| Viet Nam | 51 |
| Denmark | 31 |
| Portugal | 17 |
| Poland | 16 |
| Egypt | 15 |
| Slovenia | 5 |
| Hungary | 3 |
| Lithuania | 3 |
| Croatia | 2 |
| Serbia | 2 |
| Finland | 2 |
| France | 2 |
| Cyprus | 1 |
| Bulgaria | 1 |
| Latvia | 1 |
| Turkey | 1 |
| Romania | 1 |
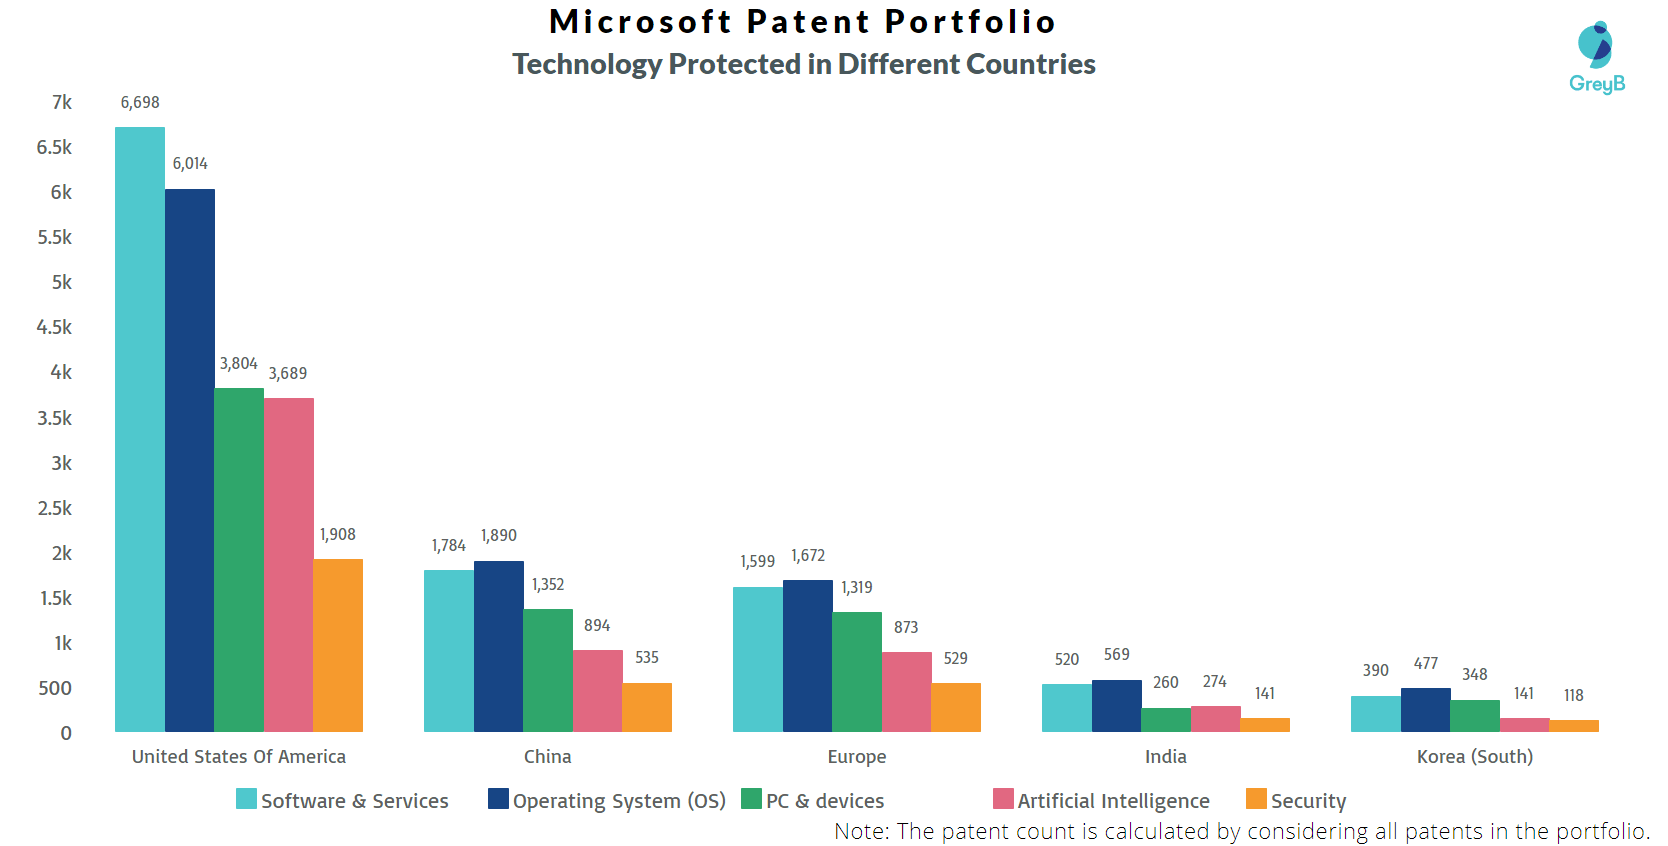
What Technologies are Covered by Microsoft Patents?
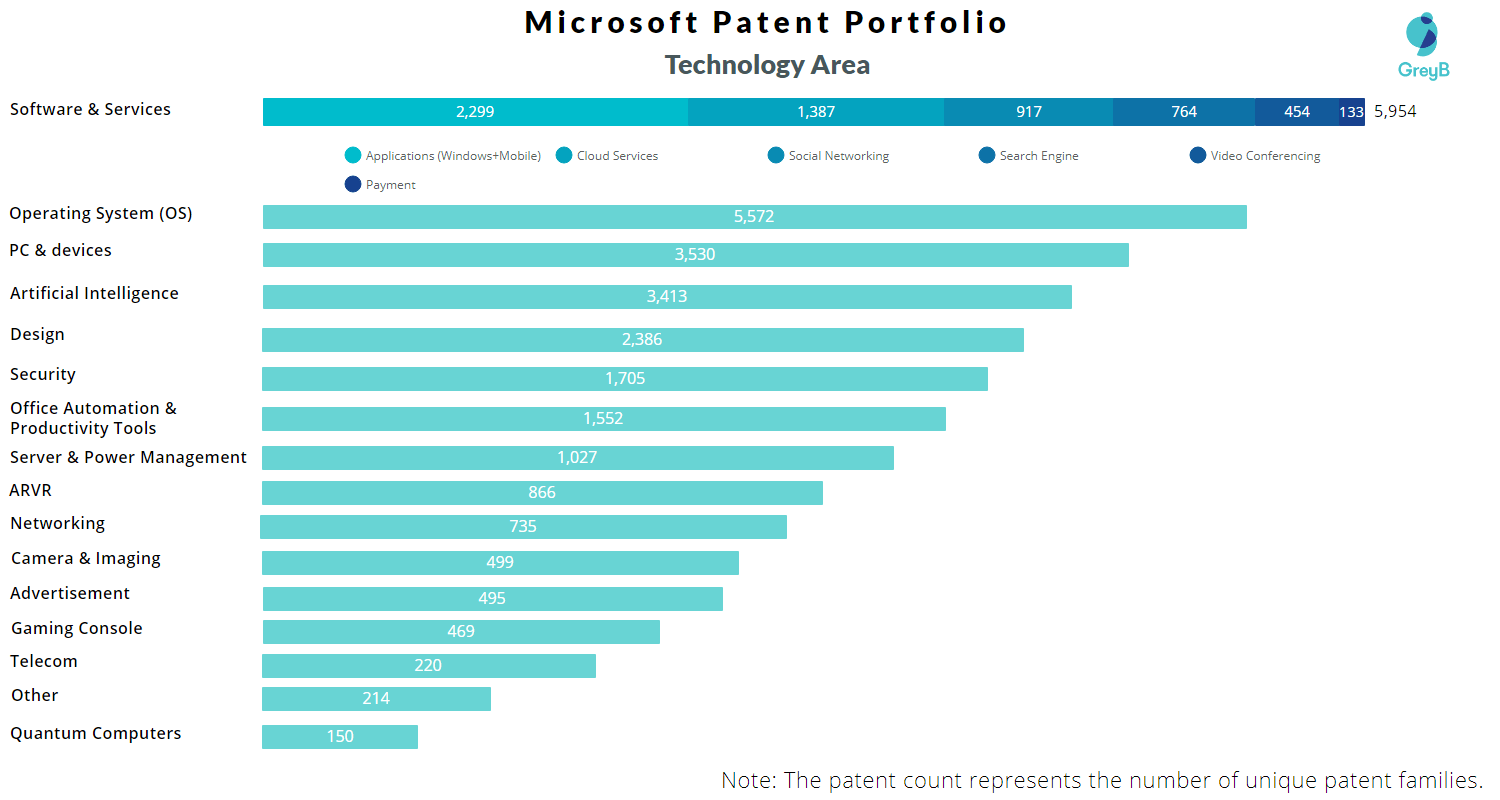
The chart below distributes patents filed by Microsoft in different countries on the basis of the technology protected in patents. It also represents the markets where Microsoft thinks it’s important to protect particular technology inventions.
Where are Research Centers of Microsoft Located?

R&D Focus: How Microsoft Research Focus Changed Over the Years?

Given technical insights are based on the (2011 to 2021), would you like to know what Microsoft updated in technical segments and where Microsoft increased its filing? Fill out the form to get the details.
Where are Research Centres of Microsoft Patents Located?

10 Best Microsoft Patents
US20130278631A1 is the most popular patent in the Microsoft portfolio. It has received 2064 citations so far from companies like Apple, Wal-Mart Stores and Google.
Below is the list of 10 most cited patents of Microsoft:
| Publication Number | Citation Count |
| US20130278631A1 | 2064 |
| US20110213664A1 | 1576 |
| US20140063055A1 | 964 |
| USD650789S1 | 916 |
| USD819684S1 | 880 |
| US20120113223A1 | 864 |
| USD782530S1 | 856 |
| USD677273S1 | 854 |
| US20120249797A1 | 802 |
| US20110320373A1 | 779 |
How many inventions of other companies were rejected due to Microsoft patents?
The statistics below share strategic R&D insights. It tells the companies that were trying to protect inventions similar to Microsoft invention. They couldn’t because Microsoft had protected those before them.
Examiners at the USPTO referred 17541 Microsoft patents in 126750 rejections (35 USC § 102 or 35 USC § 103 types).
The top citing companies in the Microsoft patent portfolio are IBM, Google and Samsung.
List of the Companies whose Patents were rejected citing Microsoft –
| Company | Number of Patent Applications that faced Rejection Citing Microsoft Patents | Number of Rejections (102 & 103) |
| IBM | 4234 | 9770 |
| 2606 | 5849 | |
| Samsung | 2489 | 6541 |
| Apple | 1382 | 3232 |
| Sony | 1217 | 3251 |
| Intel | 1114 | 2507 |
| Meta | 1074 | 2619 |
| Amazon | 974 | 2259 |
| Qualcomm | 728 | 1787 |
| Sap Se | 631 | 1396 |
Count of 102 and 103 Type Rejections based on Microsoft Patents

Top Microsoft Patents used in Rejecting Most Patent Applications
| Patent Number | Count of Rejected Applications |
| US8964298B2 | 133 |
| US8010460B2 | 97 |
| US8745541B2 | 78 |
| US20110213664A1 | 78 |
| US20140063055A1 | 75 |
| US20130050258A1 | 62 |
| US20120127284A1 | 59 |
| US20120206452A1 | 54 |
| US8659658B2 | 52 |
| US8467991B2 | 51 |
| US20130147686A1 | 50 |
| US20110221656A1 | 49 |
| US8670018B2 | 48 |
| US20120105473A1 | 48 |
| US9183676B2 | 47 |
What Percentage of Microsoft US Patent Applications were Granted?
Microsoft (Excluding its subsidiaries) has filed 49306 patent applications at USPTO so far (Excluding Design and PCT applications). Out of these 37462 have been granted leading to a grant rate of 78.57%.
Below are the key stats of Microsoft patent prosecution at the USPTO.

Which Law Firms are managing US Patents for Microsoft?
| Law Firm | Total Applications | Success Rate |
| Microsoft (Inhouse IP Dept.) | 38633 | 91.36% |
| Lee & Hayes Pc | 3108 | 61.79% |
| Perkins Coie Llp | 661 | 75.40% |
| Amin Turocy & Watson Llp | 657 | 92.42% |
| Workman Nydegger | 610 | 71.61% |
| Westman Champlin | 421 | 70.25% |
| Seed & Berry | 284 | 70.67% |
| Merchant & Gould Pc | 278 | 84.28% |
| Haley Guiliano Llp | 240 | 92.44% |
| Jeffrey R Kurin | 203 | 2.03% |