Google has a total of 117979 patents globally, out of which 70781 have been granted. Of these 117979 patents, more than 70% patents are active. United States of America is where Google has filed the maximum number of patents, followed by China and Europe (EPO). Parallelly, United States of America seems to be the main focused R&D centre and also is the origin country of Google.
Google was founded in the year 1998. The Company operates as a global technology company specializes in internet related services and products. The Company focuses on web-based search and display advertising tools, search engine, cloud computing, software, and hardware.
Do read about some of the most popular patents of Google which have been covered by us in this article and also you can find Google patents information, the worldwide patent filing activity and its patent filing trend over the years, and many other stats over Google patent portfolio.
Do read about some interesting highlights of Google Patent Acquisition Stats, Google Subsidiaries and Acquisitions, How Samsung and Google Are Betting on the Future of AI: Patent Trends and Innovation Insight.
Google Innovation Prediction Roadmap: 2025–2030

The insights and projections presented in this article are based on predictive analysis, current patent analysis that have been done, and publicly available information as of 2024. While care has been taken to ensure accuracy, the forward-looking statements are speculative and should not be interpreted as definitive strategic actions by Google or its affiliates. This content is intended for informational and research purposes only and does not constitute legal, financial, or investment advice.
Keep track of every patent move and monitor competitor activity in real-time. Click here for full insights:
How many patents does the Founder and CEO of Google have?
The Founder Larry Page has 38 and Sergey Brin has 79 patents and the CEO, Sundar Pichai has 5 patents.
How many patents does Google have?
Google has a total of 117979 patents globally. These patents belong to 39667 unique patent families. Out of 117979 patents, 83641 patents are active.
How Many Patents did Google File Every Year?

Are you wondering why there is a drop in patent filing for the last two years? It is because a patent application can take up to 18 months to get published. Certainly, it doesn’t suggest a decrease in the patent filing.
| Year of Patents Filing or Grant | Google Applications Filed | Google Patents Granted |
| 2024 | 49 | 389 |
| 2023 | 2258 | 2899 |
| 2022 | 4557 | 5759 |
| 2021 | 7058 | 6551 |
| 2020 | 9194 | 6648 |
| 2019 | 9345 | 7149 |
| 2018 | 8818 | 5877 |
| 2017 | 9564 | 5751 |
| 2016 | 9589 | 5191 |
| 2015 | 6501 | 4668 |
| 2014 | 7359 | 4207 |
| 2013 | 8139 | 3401 |
How many Google patents are Alive/Dead?

How Many Patents did Google File in Different Countries?

Countries in which Google Filed Patents
| Country | Patents |
| United States of America | 50742 |
| China | 11496 |
| Europe (EPO) | 11211 |
| Germany | 5970 |
| Korea (South) | 5610 |
| Japan | 5508 |
| India | 3016 |
| Australia | 2803 |
| United Kingdom | 2458 |
| Canada | 2119 |
| Taiwan | 1176 |
| Brazil | 679 |
| Singapore | 622 |
| Hong Kong (S.A.R.) | 464 |
| Russia | 303 |
| Israel | 284 |
| Denmark | 193 |
| Mexico | 129 |
| Austria | 87 |
| Viet Nam | 80 |
| Spain | 71 |
| Finland | 63 |
| South Africa | 54 |
| Poland | 35 |
| Norway | 34 |
| Netherlands | 32 |
| Italy | 31 |
| Chile | 29 |
| New Zealand | 29 |
| Indonesia | 26 |
| Ireland | 23 |
| Philippines | 21 |
| France | 21 |
| Argentina | 17 |
| Uruguay | 14 |
| Pakistan | 14 |
| Portugal | 13 |
| Thailand | 11 |
| Malaysia | 11 |
| Dominican Republic | 10 |
| Sweden | 10 |
| Colombia | 8 |
| Peru | 8 |
| Costa Rica | 7 |
| Ecuador | 7 |
| Malta | 6 |
| Slovakia | 5 |
| Eurasia | 5 |
| Turkey | 4 |
| Panama | 3 |
| Croatia | 2 |
| Hungary | 2 |
| Africa | 2 |
| Greece | 1 |
| Latvia | 1 |
| Slovenia | 1 |
| Republic of Moldova | 1 |
| Ukraine | 1 |
| Romania | 1 |
| Kenya | 1 |
| Morocco | 1 |
| Cyprus | 1 |
| Tunisia | 1 |
| Serbia | 1 |
| Lithuania | 1 |
Where are Research Centres of Google Patents Located?

How Many Patents Owned by Google and Its Subsidiaries?

Patents acquired by Google
Google has acquired 6295 patent families from other companies which are not associated with Google.
Below the chart shows the top 10 patent acquisitions of Google –

10 Best Google Patents
US6526581B1 is the most popular patent in the Google portfolio. It has received 991 citations so far from companies like Accenture, Verizon Communications and LG Electronics.
Below is the list of 10 most cited patents of Google:
| Publication Number | Citation Count |
| US6526581B1 | 991 |
| US6647269B2 | 902 |
| US6785704B1 | 886 |
| US7136875B2 | 882 |
| US20090288012A1 | 861 |
| US20050021397A1 | 852 |
| US20050071328A1 | 847 |
| US20040044571A1 | 832 |
| US6658423B1 | 799 |
| US20100278453A1 | 790 |
What Percentage of Google US Patent Applications were Granted?
Google (Excluding its subsidiaries) has filed 44958 patent applications at USPTO so far (Excluding Design and PCT applications). Out of these 35247 have been granted leading to a grant rate of 87.2%.
Below are the key stats of Google patent prosecution at the USPTO.

Which Law Firms Filed Most US Patents for Google?
| Law Firm | Total Applications | Success Rate |
| Fish & Richardson PC | 7714 | 88.54% |
| Google (Inhose IP Dept) | 7181 | 90.08% |
| Dority & Manning PA | 3901 | 69.59% |
| Brake Hughes Bellermann Llp | 3192 | 93.64% |
| Shumaker & Sieffert PA | 2490 | 85.97% |
| Gray Ice Higdon | 2087 | 96.55% |
| Colby Nipper | 1746 | 89.22% |
| Honigman Llp | 1673 | 95.75% |
EXCLUSIVE INSIGHTS COMING SOON!
What are Google’s key innovation segments?
What Technologies are Covered by Google?
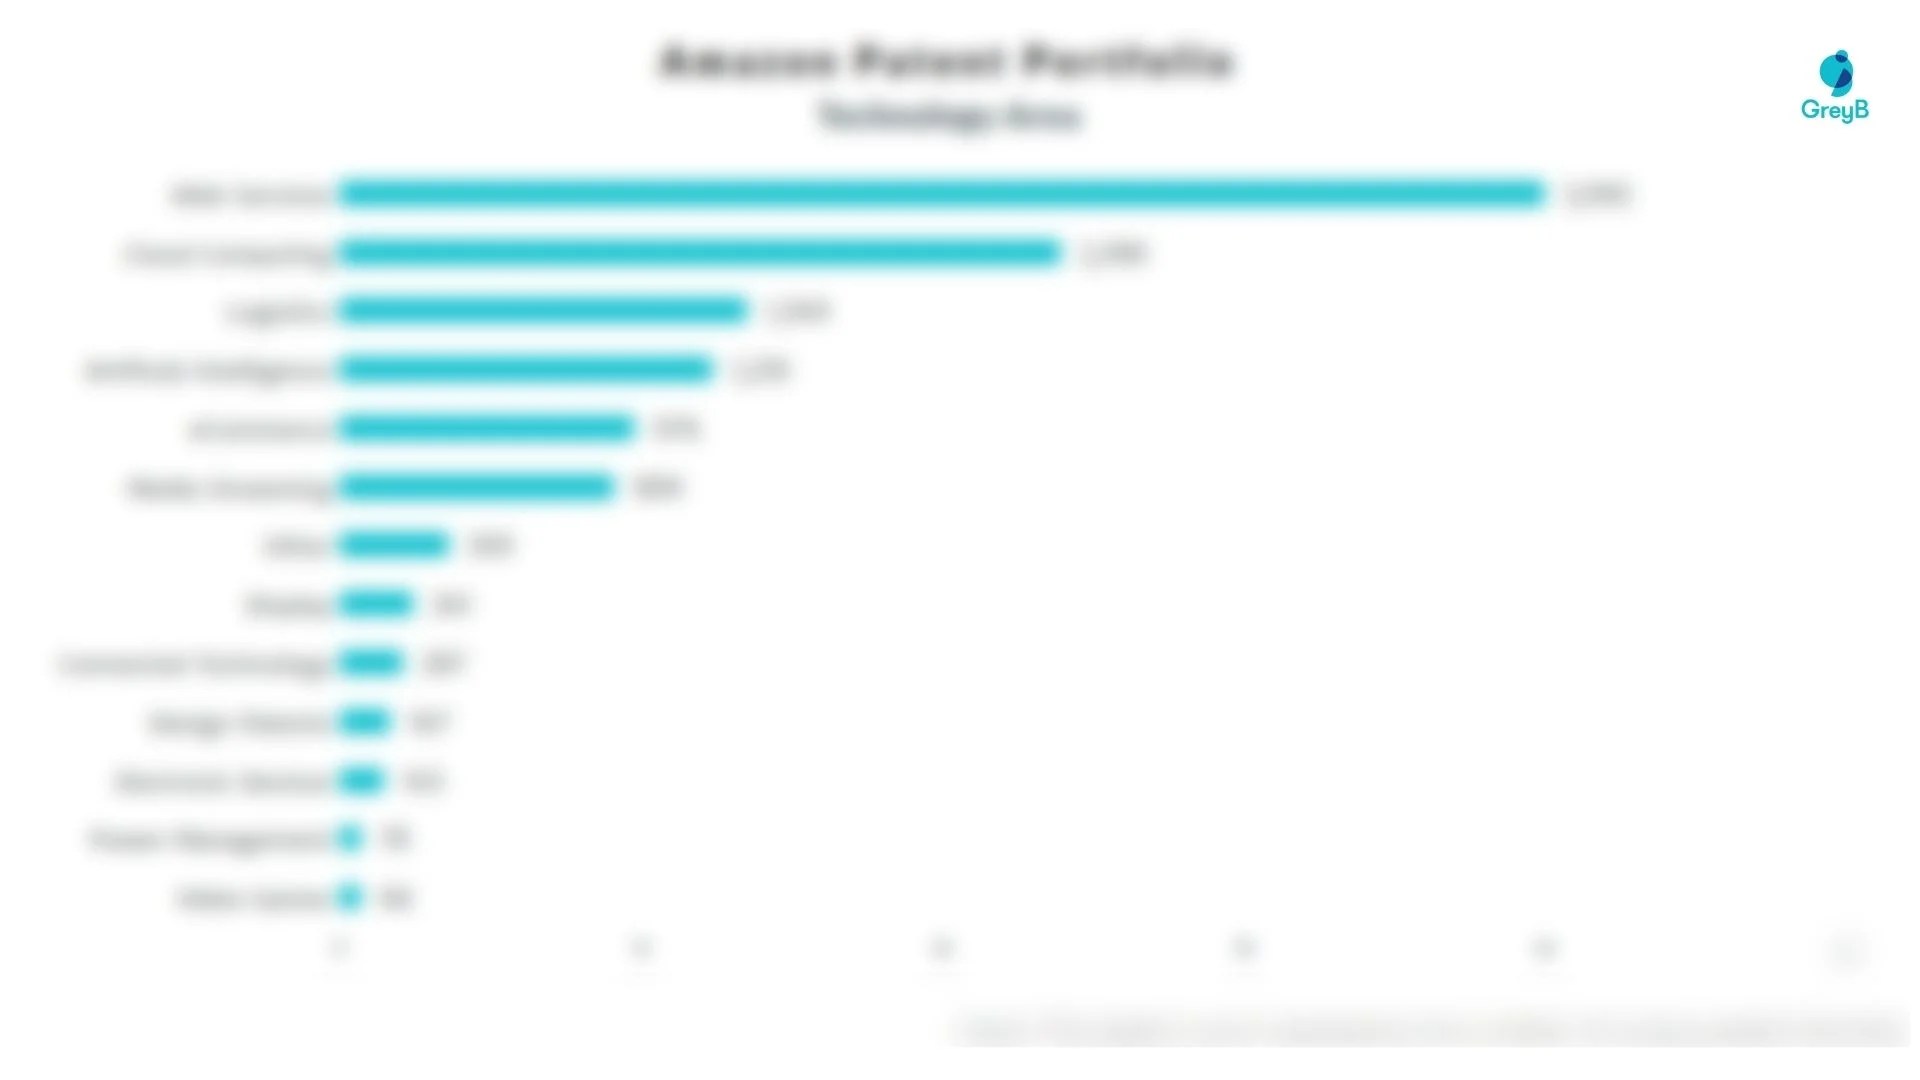
The chart below distributes patents filed by