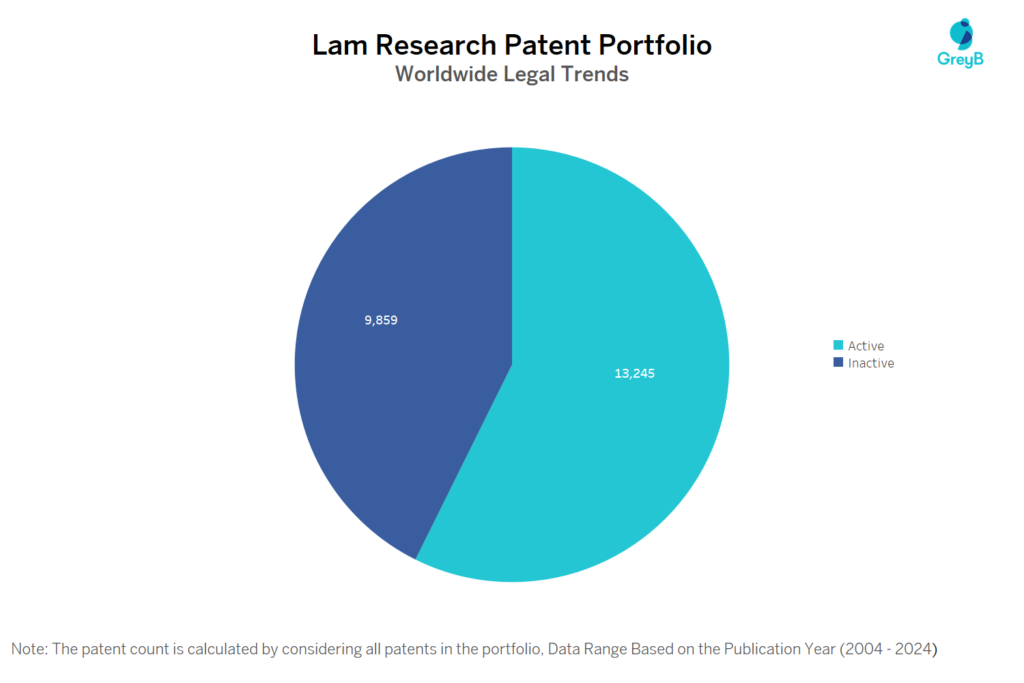
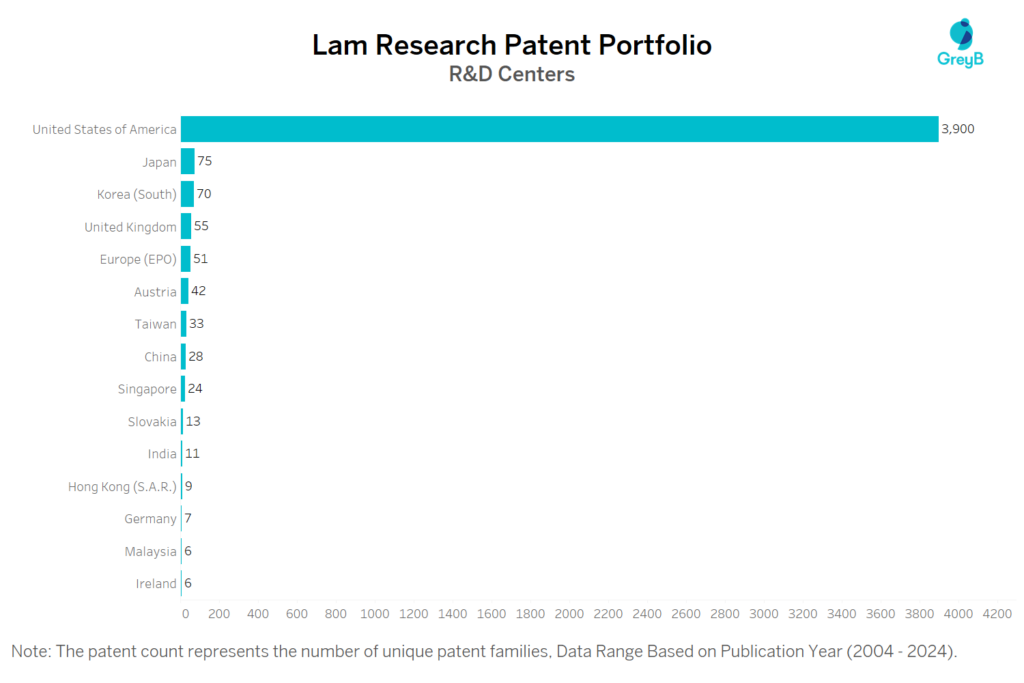
Lam Research has a total of 23104 patents globally, out of which 13363 have been granted. Of these 23104 patents, more than 57% patents are active. United States of America is where Lam Research has filed the maximum number of patents, followed by Korea (South) and Taiwan. Parallelly, United States of America seems to be the main focused R&D centre and also is the origin country of Lam Research.
Lam Research was founded in the year 1980. Lam Research, a global leader in semiconductor manufacturing, specializes in innovative wafer fabrication equipment and services. Their advanced technology solutions support the production of integrated circuits, helping drive progress in areas like AI, 5G and advanced computing technologies.
Do read about some of the most popular patents of Lam Research which have been covered by us in this article and also you can find Lam Research patents information, the worldwide patent filing activity and its patent filing trend over the years, and many other stats over Lam Research patent portfolio.
How many patents does Lam Research have?
Lam Research has a total of 23104 patents globally. These patents belong to 4333 unique patent families. Out of 23104 patents, 13245 patents are active.
How Many Patents did Lam Research File Every Year?
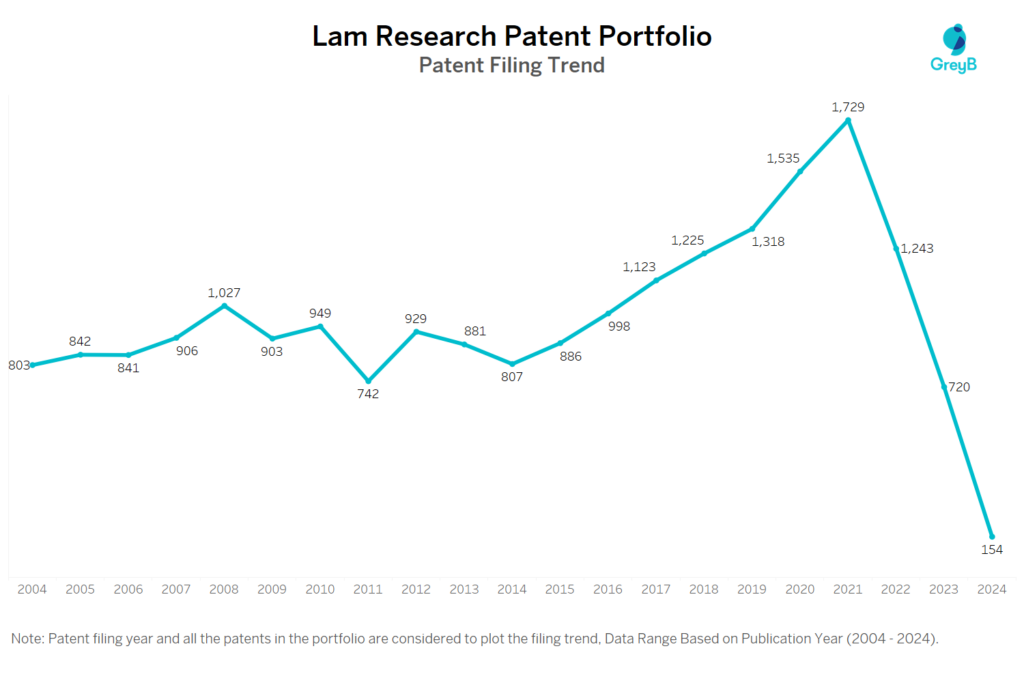
Are you wondering why there is a drop in patent filing for the last two years? It is because a patent application can take up to 18 months to get published. Certainly, it doesn’t suggest a decrease in the patent filing.
| Year of Patents Filing or Grant | Lam Research Applications Filed | Lam Research Patents Granted |
| 2024 | 154 | 746 |
| 2023 | 720 | 880 |
| 2022 | 1243 | 637 |
| 2021 | 1729 | 624 |
| 2020 | 1535 | 706 |
| 2019 | 1318 | 704 |
| 2018 | 1225 | 691 |
| 2017 | 1123 | 716 |
| 2016 | 998 | 736 |
| 2015 | 886 | 771 |
| 2014 | 807 | 831 |
| 2013 | 881 | 808 |
How many Lam Research patents are Alive/Dead?
How Many Patents did Lam Research File in Different Countries?
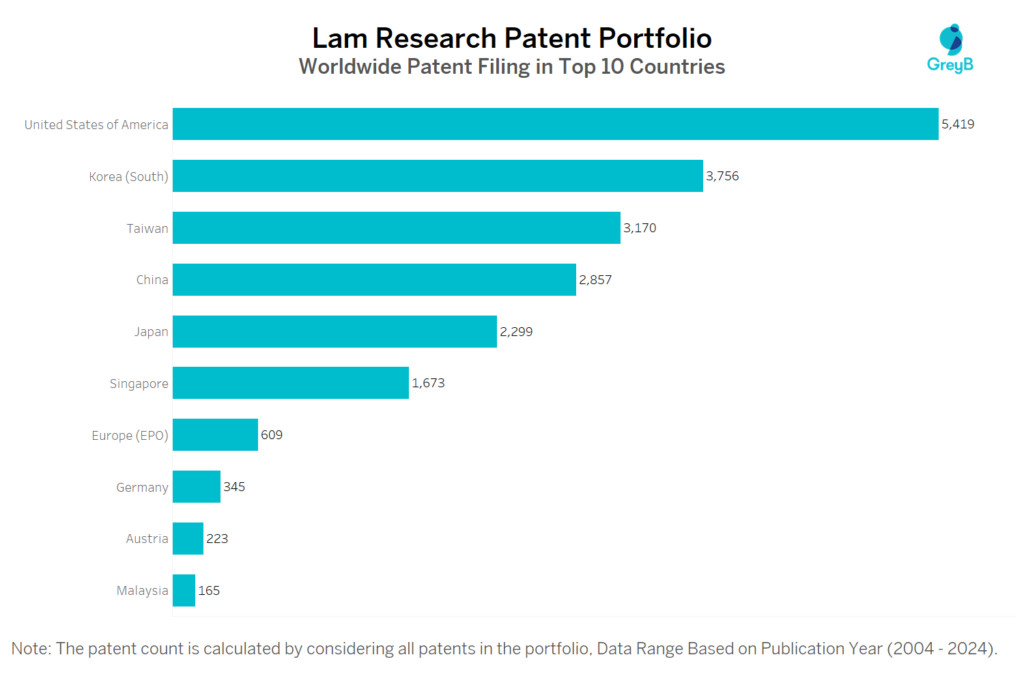
Countries in which Lam Research Filed Patents
| Country | Patents |
| United States of America | 5419 |
| Korea (South) | 3756 |
| Taiwan | 3170 |
| China | 2857 |
| Japan | 2299 |
| Singapore | 1673 |
| Europe (EPO) | 609 |
| Germany | 345 |
| Austria | 223 |
| Malaysia | 165 |
| Israel | 93 |
| United Kingdom | 63 |
| Australia | 41 |
| Hong Kong (S.A.R.) | 24 |
| Slovakia | 19 |
| Italy | 12 |
| Russian Federation | 12 |
| Poland | 11 |
| Spain | 9 |
| Portugal | 8 |
| India | 6 |
| France | 4 |
| Denmark | 2 |
| Philippines | 2 |
| Brazil | 2 |
| South Africa | 1 |
| Croatia | 1 |
| Norway | 1 |
| Slovenia | 1 |
Where are Research Centres of Lam Research Patents Located?
10 Best Lam Research Patents
US7153542B2 is the most popular patent in the Lam Research portfolio. It has received 804 citations so far from companies like Tokyo Electron Limited, Applied Materials and Novellus Systems.
Below is the list of 10 most cited patents of Lam Research:
| Publication Number | Citation Count |
| US7153542B2 | 804 |
| US7915139B1 | 752 |
| US20110256734A1 | 742 |
| US6847014B1 | 680 |
| US7582555B1 | 570 |
| US7265061B1 | 567 |
| US7790633B1 | 556 |
| US7888233B1 | 543 |
| US7208389B1 | 537 |
| US8728956B2 | 530 |
EXCLUSIVE INSIGHTS COMING SOON!
What are Lam Research’s key innovation segments?
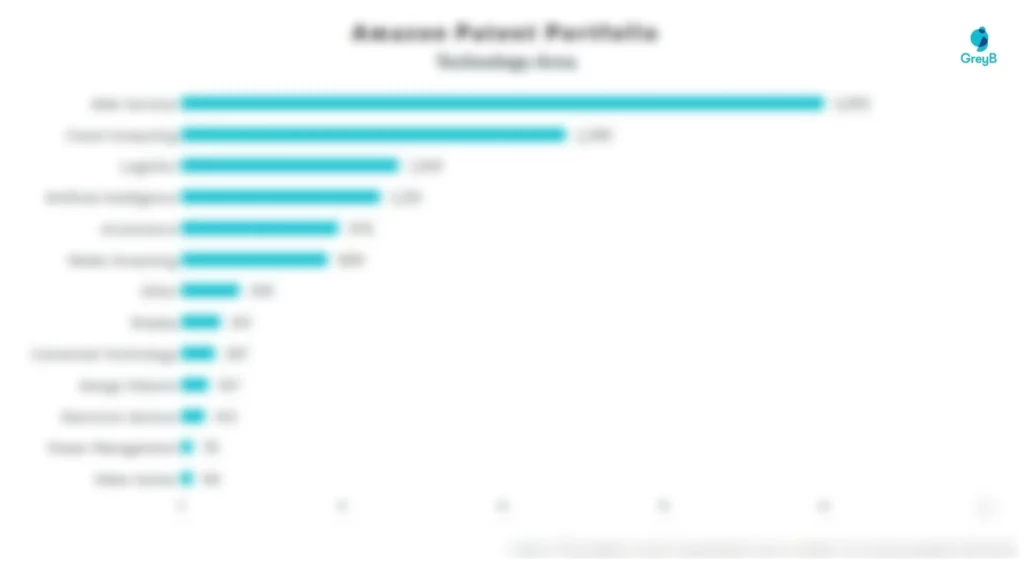
What Technologies are Covered by Lam Research?
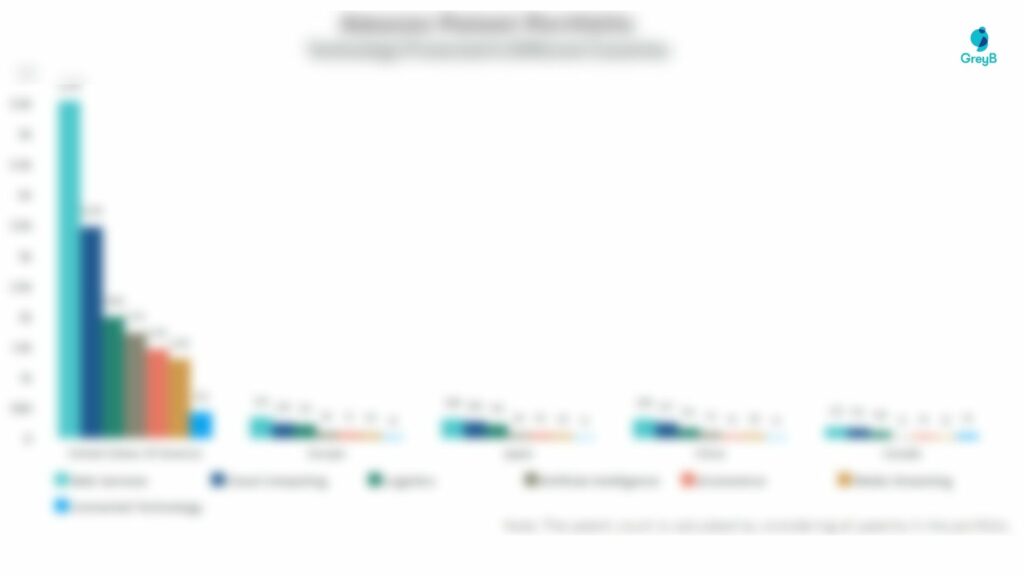
The chart below distributes patents filed by Lam Research in different countries on the basis of the technology protected in patents. It also represents the markets where Lam Research thinks it’s important to protect particular technology inventions.
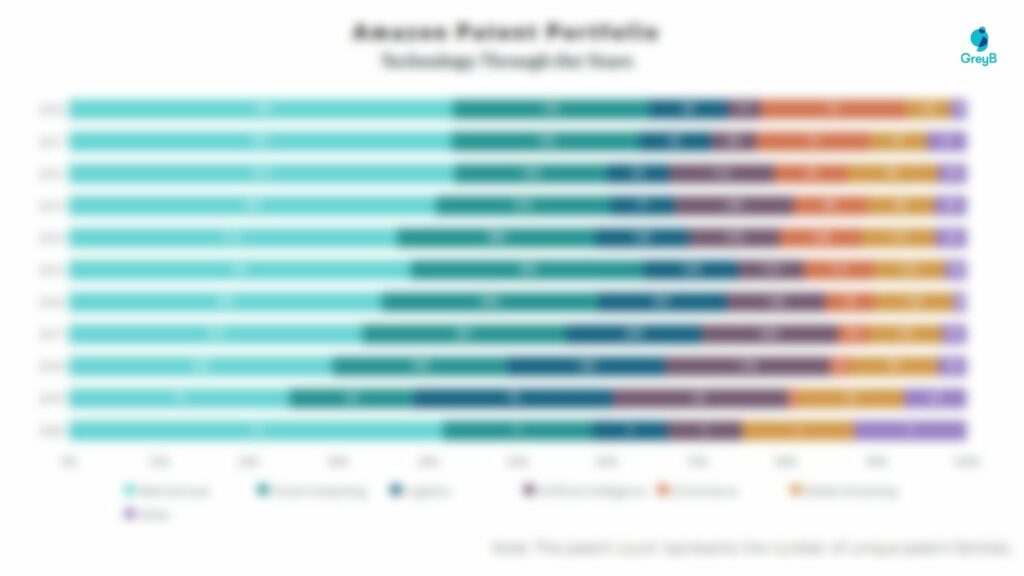
R&D Focus: How has Lam Research’s search focus changed over the years?
EXCLUSIVE INSIGHTS COMING SOON!
