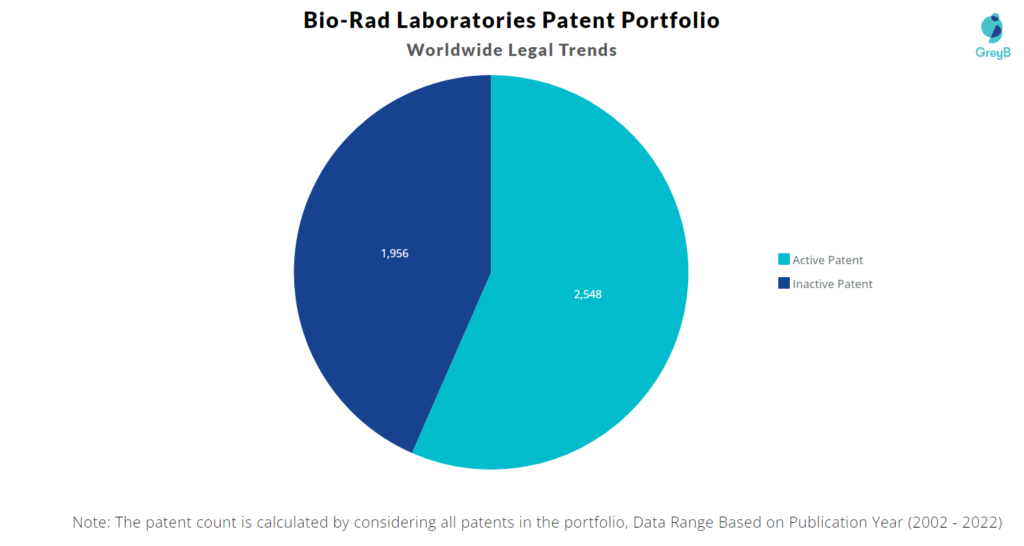
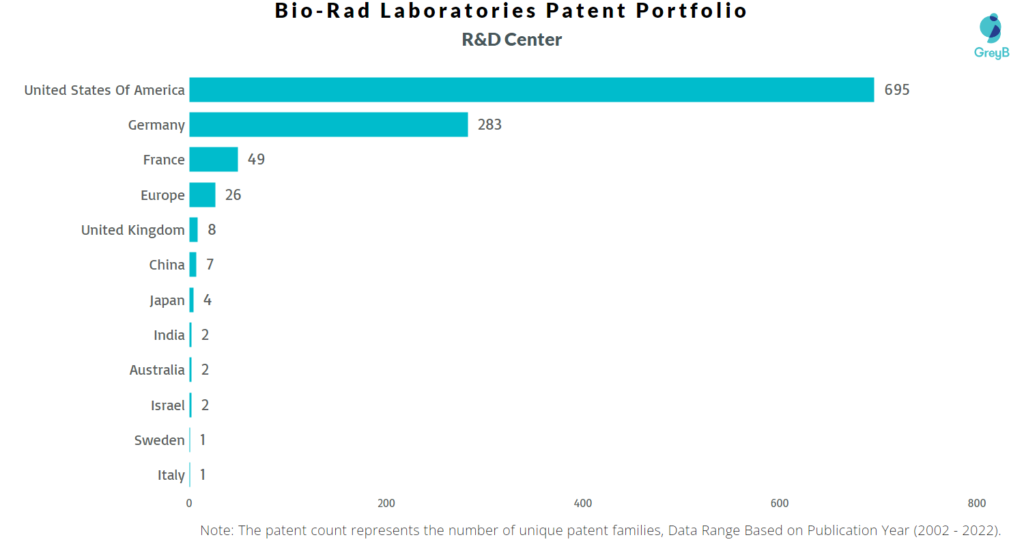
Bio-Rad Laboratories has a total of 4504 patents globally, out of which 2564 have been granted. Of these 4504 patents, more than 56% patents are active. United States Of America is where Bio-Rad Laboratories has filed the maximum number of patents, followed by Europe and Germany. Parallelly, United States Of America seems to be the main focused R&D center and is also the origin country of Bio-Rad Laboratories.
Bio-Rad Laboratories was founded in 1952 by David Schwartz. Bio-Rad Laboratories operates a chain of laboratories. The Company manufactures and distributes life science research products, clinical diagnostics, and analytical instrumentation. Bio-Rad Laboratories products and systems separate complex chemical and biological materials, as well as identify, analyse, and purify their components. Bio-Rad Laboratories serves customers worldwide. As of April 2022 Bio-Rad Laboratories has a market cap of $16.53 Billion.
Do read about some of the most popular patents of Bio-Rad Laboratories which have been covered by us in this article and also you can find Bio-Rad Laboratories patents information, the worldwide patent filing activity and its patent filing trend over the years, and many other stats over Bio-Rad Laboratories patent portfolio.
How many patents does the Founder and CEO of Bio-Rad Laboratories have?
The Founder & CEO, David Schwartz and Norman David Schwartz has 0 patents.
How many patents does Bio-Rad Laboratories have?
Bio-Rad Laboratories has a total of 4504 patents globally. These patents belong to 1095 unique patent families. Out of 4504 patents, 2548 patents are active.
How Many Patents did Bio-Rad Laboratories File Every Year?
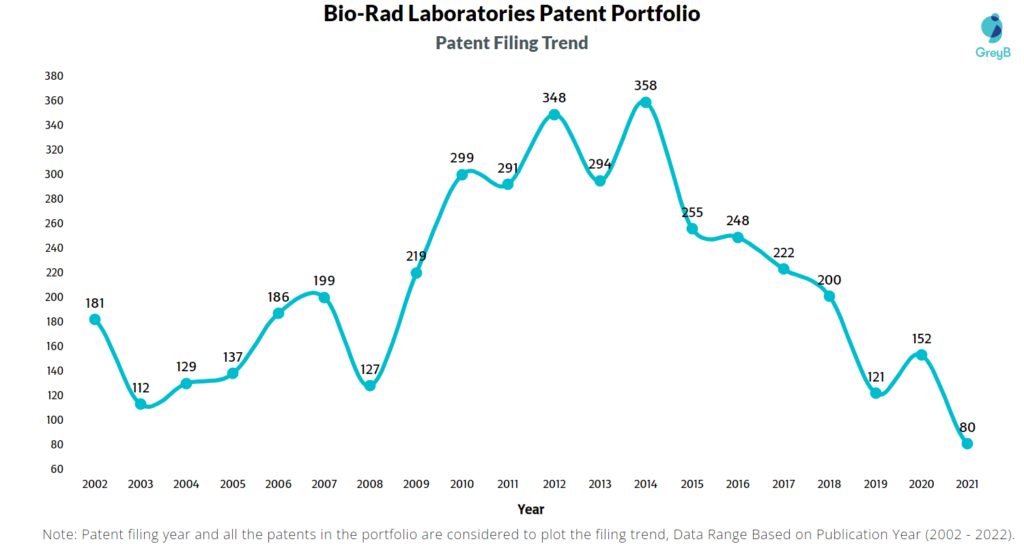
Are you wondering why there is a drop in patent filing for the last two years? It is because a patent application can take up to 18 months to get published. Certainly, it doesn’t suggest a decrease in the patent filing.
| Year of Patents Filing or Grant | Bio-Rad Laboratories Applications Filed | Bio-Rad Laboratories Patents Granted |
| 2010 | 299 | 92 |
| 2011 | 291 | 70 |
| 2012 | 348 | 97 |
| 2013 | 294 | 105 |
| 2014 | 358 | 171 |
| 2015 | 255 | 157 |
| 2016 | 248 | 200 |
| 2017 | 222 | 227 |
| 2018 | 200 | 245 |
| 2019 | 121 | 252 |
| 2020 | 152 | 242 |
| 2021 | 80 | 201 |
| 2022 | – | 45 |
How many Bio-Rad Laboratories patents are Alive/Dead?
Worldwide Patents
How Many Patents did Bio-Rad Laboratories File in Different Countries?
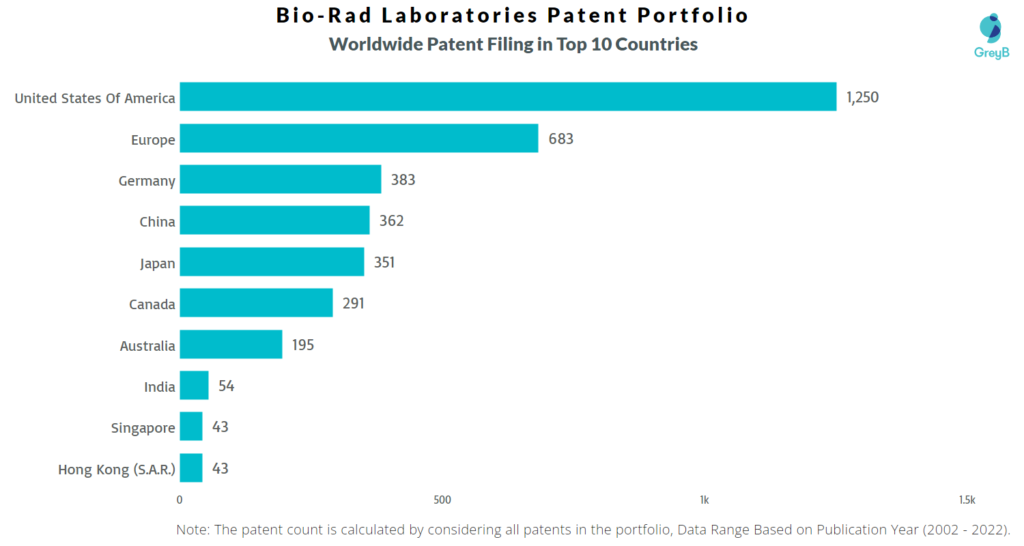
Countries in which Bio-Rad Laboratories Filed Patents
| Country | Patents |
| United States Of America | 1250 |
| Europe | 683 |
| Germany | 383 |
| China | 362 |
| Japan | 351 |
| Canada | 291 |
| Australia | 195 |
| India | 54 |
| Singapore | 43 |
| Hong Kong (S.A.R.) | 43 |
| Spain | 40 |
| France | 37 |
| Austria | 34 |
| Korea (South) | 23 |
| Brazil | 18 |
| Russia | 12 |
| Denmark | 12 |
| Mexico | 11 |
| New Zealand | 8 |
| United Kingdom | 7 |
| Israel | 7 |
| Portugal | 6 |
| Poland | 4 |
| South Africa | 2 |
| Taiwan | 1 |
| Netherlands | 1 |
| Argentina | 1 |
| Norway | 1 |
| Czech Republic | 1 |
| Hungary | 1 |
Where are Research Centers of Bio-Rad Laboratories Patents Located?
10 Best Bio-Rad Laboratories Patents
US20080014589A1 is the most popular patent in the Bio-Rad Laboratories portfolio. It has received 844 citations so far from companies like Ion Torrent Systems and Veridex.
Below is the list of 10 most cited patents of Bio-Rad Laboratories:
| Publication Number | Citation Count |
| US20080014589A1 | 844 |
| US20080003142A1 | 809 |
| US20100022414A1 | 434 |
| US20100137163A1 | 415 |
| US6337435B1 | 333 |
| WO2007081387A1 | 293 |
| WO2010036352A1 | 275 |
| US6675104B2 | 233 |
| WO2008021123A1 | 232 |
| US6579719B1 | 176 |
Which Companies are using Bio-Rad Laboratories Patents to Advance their Research?
If patents or patents from a particular technology area of a company receive a lot of citations, it implies that the technology is being followed and incrementally innovated by the citing companies. It also indicates that citing companies are working on similar and closely related technologies.
The top citing companies in the Bio-Rad Laboratories patent portfolio are 10X Genomics, Life Technologies and National Institutes Of Health.
List of the top forward citing Companies –
| Company | Number Of Patents |
| 10X Genomics | 53 |
| Life Technologies | 38 |
| National Institutes Of Health | 17 |
| University Of California | 16 |
| Sysmex | 16 |
| Harvard College | 14 |
| Applied Biosystems | 12 |
| Roche Molecular Systems | 9 |
| Ge Healthcare Bio-Sciences | 8 |
| Hitachi | 8 |
Count of 102 and 103 Type Rejections based on Bio-Rad Laboratories Patents
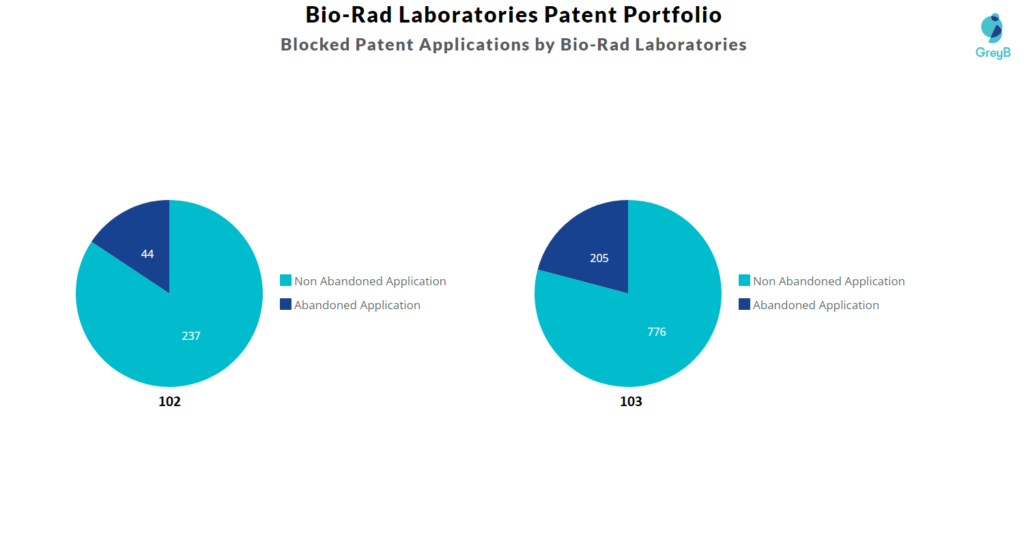
Top Bio-Rad Laboratories Patents used in Rejecting Most Patent Applications
| Patent Number | Count of Rejected Applications |
| US9150852B2 | 57 |
| US20080003142A1 | 56 |
| US20080014589A1 | 39 |
| US6337435B1 | 27 |
| US9347059B2 | 27 |
| US20100022414A1 | 24 |
| US20100137163A1 | 23 |
| US9194861B2 | 21 |
| US6627424B1 | 18 |
| US7220385B2 | 17 |
What Percentage of Bio-Rad Laboratories US Patent Applications were Granted?
Bio-Rad Laboratories (Excluding its subsidiaries) has filed 1061 patent applications at USPTO so far (Excluding Design and PCT applications). Out of these 742 have been granted leading to a grant rate of 82.44%.
Below are the key stats of Bio-Rad Laboratories patent prosecution at the USPTO.

Which Law Firms Filed Most US Patents for Bio-Rad Laboratories?
| Law Firm | Total Applications | Success Rate |
| Bio Rad Kilpatrick Townsend And Stockton | 382 | 91.94% |
| Kilpatrick Townsend & Stockton | 156 | 44.03% |
| Kolisch Hartwell | 126 | 81.82% |
| Brown Rudnick | 77 | 88.68% |
| Schox | 42 | 100.00% |
| Morgan Lewis & Bockius | 22 | 54.55% |
| Mintz Levin Boston Office | 19 | 100.00% |
| Stinson | 18 | 88.89% |
| Saliwanchik Lloyd & Eisenschenk | 16 | 100.00% |
| Weaver Austin Villeneuve & Sampson | 15 | 93.33% |
EXCLUSIVE INSIGHTS COMING SOON!
What are Bio-Rad Laboratories key innovation segments?
