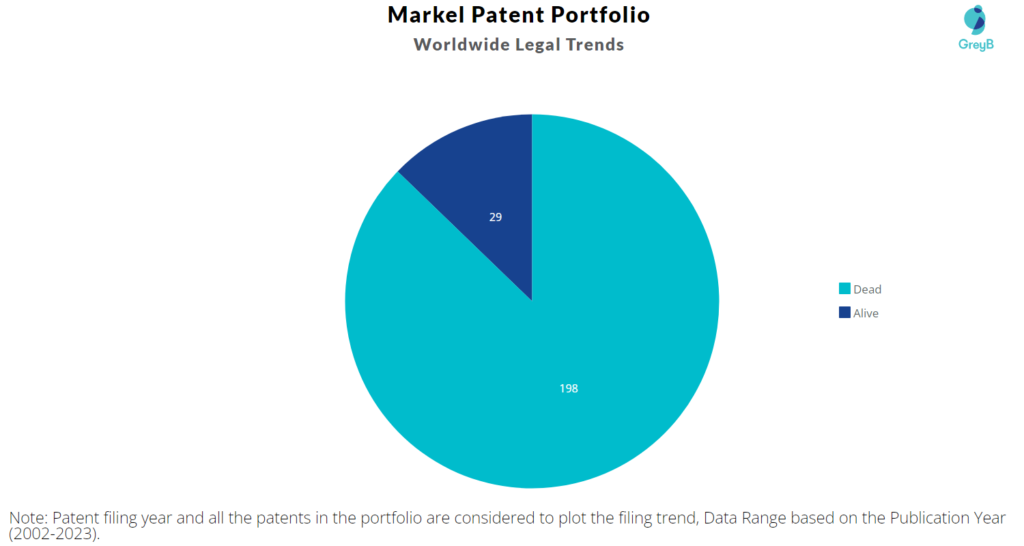
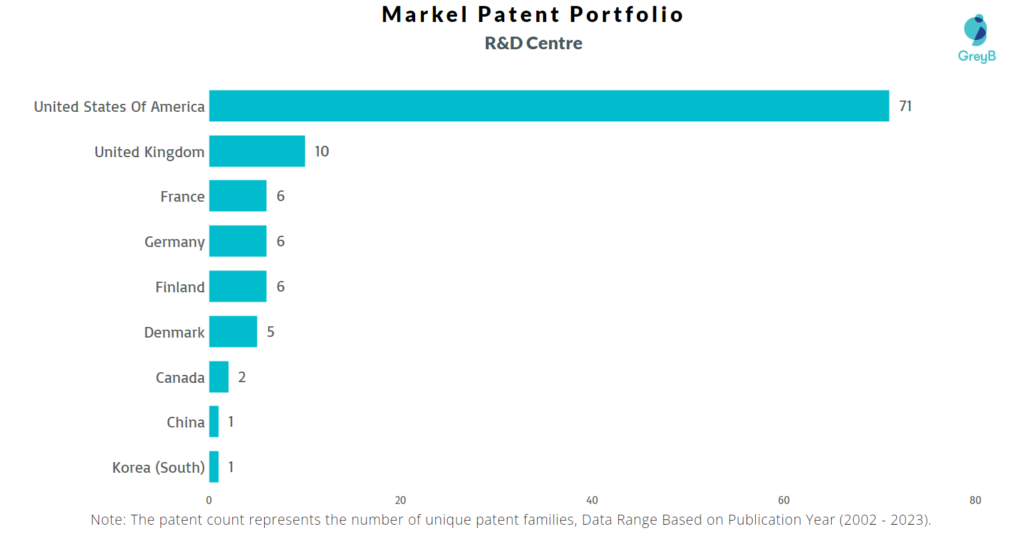
Markel has a total of 227 patents globally, out of which 156 have been granted. Of these 227 patents, more than 12% patents are active. The United States of America is where Markel has filed the maximum number of patents, followed by Australia and Canada. Parallelly, the United States of America seems to be the main focused R&D centre and also is the origin country of Markel.
Markel was founded in the year 1930. The Company markets and underwrites specialty insurance products and programs to a variety of niche markets. The Company also underwrites a diverse property, casualty and marine and aviation insurance and reinsurance business on a worldwide basis. As of February 2023, the market cap of Markel is $17.77 Billion.
Do read about some of the most popular patents of Markel which have been covered by us in this article and also you can find Markel patents information, the worldwide patent filing activity and its patent filing trend over the years, and many other stats over Markel’s patent portfolio.
How many patents does the founder and the CEO of Markel have?
The founder Samuel A. Markel has 0 patent and CEO James McAliney has 0 patent.
How many patents does Markel have?
Markel has a total of 227 patents globally. These patents belong to 108 unique patent families. Out of 227 patents, 29 patents are active.
How Many Patents did Markel File Every Year?
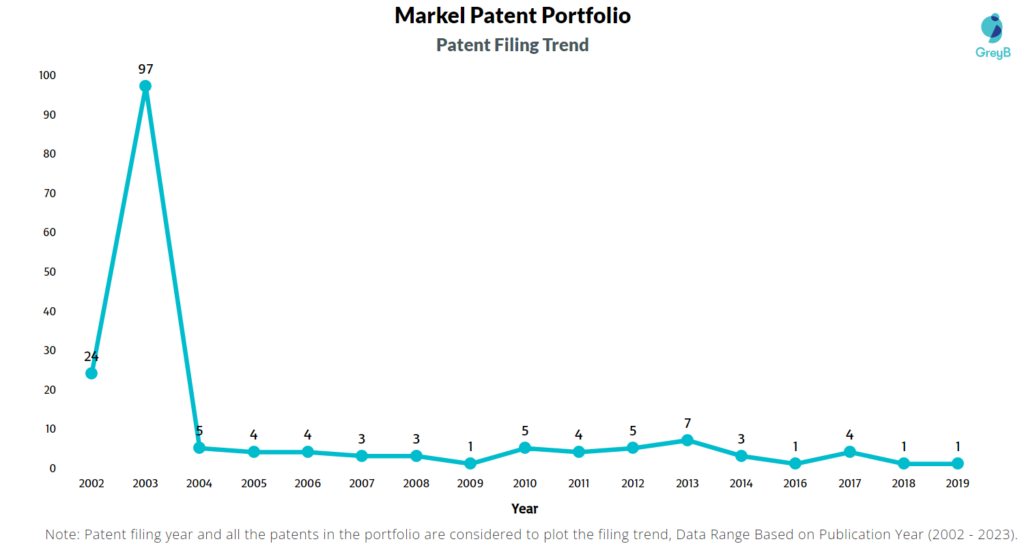
Are you wondering why there is a drop in patent filing for the last two years? It is because a patent application can take up to 18 months to get published. Certainly, it doesn’t suggest a decrease in the patent filing.
| Year of Patents Filing or Grant | Markel Applications Filed | Markel Patents Granted |
| 2022 | – | 2 |
| 2020 | – | 2 |
| 2019 | 1 | 4 |
| 2018 | 1 | 2 |
| 2017 | 4 | – |
| 2016 | 1 | 5 |
| 2015 | – | 1 |
| 2014 | 3 | 4 |
| 2013 | 7 | 3 |
| 2012 | 5 | – |
| 2011 | 4 | – |
How many Markel patents are Alive/Dead?
How Many Patents did Markel File in Different Countries?
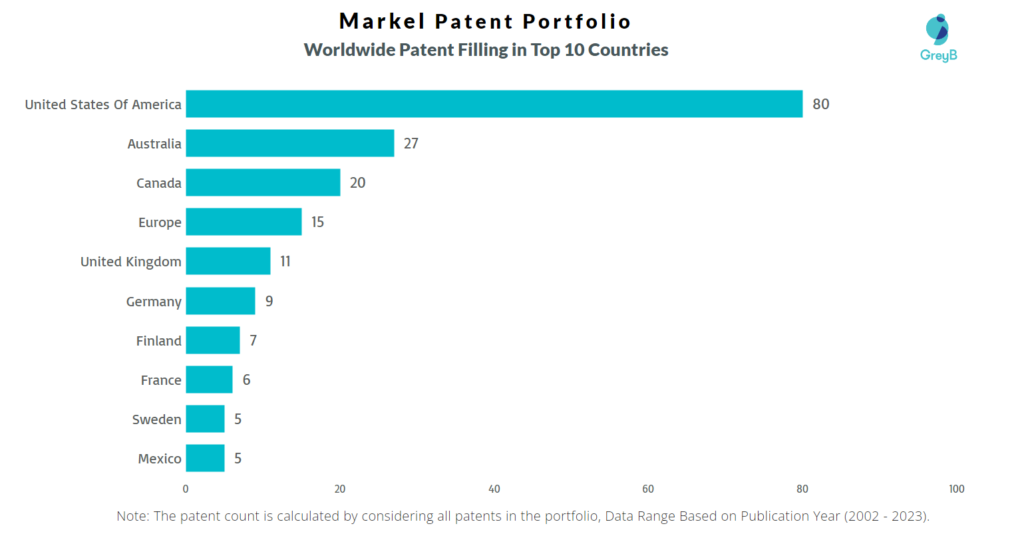
Countries in which Markel Filed Patents
| Country | Patents |
| United States Of America | 80 |
| Australia | 27 |
| Canada | 20 |
| Europe | 15 |
| United Kingdom | 11 |
| Germany | 9 |
| Finland | 7 |
| France | 6 |
| Sweden | 5 |
| Mexico | 5 |
| Denmark | 5 |
| Norway | 5 |
| Italy | 3 |
| Taiwan | 2 |
| Brazil | 2 |
| Korea (South) | 2 |
| New Zealand | 1 |
| Austria | 1 |
| China | 1 |
Where are Research Centres of Markel Patents Located?
10 Best Markel Patents
US20050015491A1 is the most popular patent in the Markel portfolio. It has received 156 citations so far from companies like IBM, Microsoft and Samsung.
Below is the list of 10 most cited patents of Markel:
| Publication Number | Citation Count |
| US20050015491A1 | 156 |
| US20090119133A1 | 88 |
| US20030021908A1 | 82 |
| US20040158991A1 | 81 |
| US6643936B2 | 75 |
| US6625832B2 | 61 |
| US6349473B1 | 54 |
| US20030140757A1 | 44 |
| US6345445B1 | 42 |
| US20070038485A1 | 30 |
How many inventions of other companies were rejected due to Markel patents?
The statistics below share strategic R&D insights. It tells the companies that were trying to protect inventions similar to Markel invention. They couldn’t because Markel had protected those before them.
Examiners at the USPTO referred 21 Markel patents in 126 rejections (35 USC § 102 or 35 USC § 103 types).
The top citing companies in the Markel patent portfolio are Hartford Fire, Nova Chemicals and Sap Se.
List of the Companies whose Patents were rejected citing Markel –
| Company | Number of Patent Applications that faced Rejection Citing Markel Patents | Number of Rejections (102 & 103) |
| Hartford Fire | 4 | 11 |
| Nova Chemicals | 3 | 16 |
| Sap Se | 3 | 4 |
| Qomplx Inc | 2 | 4 |
| Solbern Inc | 2 | 3 |
| Kongsberg Driveline Systems | 2 | 4 |
| Leatherman | 2 | 8 |
| The National Telephone | 1 | 1 |
| Produits Plastiques Performants Holding | 1 | 4 |
| Nhk Spring Company | 1 | 2 |
Count of 102 and 103 Type Rejections based on Markel Patents
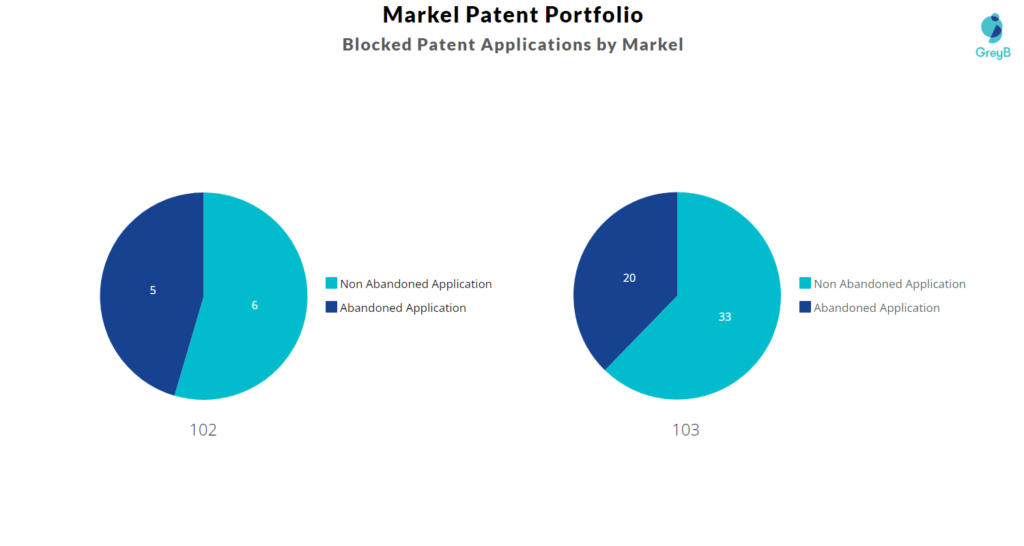
Top Markel Patents used in Rejecting Most Patent Applications
| Patent Number | Count of Rejected Applications |
| US20090119133A1 | 9 |
| US7744692B2 | 5 |
| US20030021908A1 | 4 |
| US6625832B2 | 4 |
| US8540081B2 | 3 |
| US20050015491A1 | 3 |
| US20060053945A1 | 3 |
| US6349473B1 | 3 |
| US7299731B2 | 2 |
| US20020138990A1 | 2 |
| US7487718B2 | 2 |
| US6884481B1 | 2 |
| US20030118689A1 | 2 |
| US7011008B2 | 2 |
| US9061251B2 | 2 |
What Percentage of Markel US Patent Applications were Granted?
Markel (Excluding its subsidiaries) has filed 39 patent applications at USPTO so far (Excluding Design and PCT applications). Out of these 28 have been granted leading to a grant rate of 73.68%.
Below are the key stats of Markel patent prosecution at the USPTO.

Which Law Firms Filed Most US Patents for Markel?
| Law Firm | Total Applications | Success Rate |
| Joseph F Posillico | 8 | 57.14% |
| Leslie A Cohen | 8 | 62.50% |
| Joshua R Slavitt | 3 | 100.00% |
| Mc Cormick Paulding & Huber | 3 | 100.00% |
| Mccormick Paulding & Huber | 3 | 100.00% |
| Synnestvedt & Lechner | 2 | 100.00% |
| David B Ritchie | 1 | 0.00% |
| Finnegan Henderson Farabow Garrett & Dunner | 1 | 0.00% |
| Fox Rothschild | 1 | 0.00% |
| James A Drobile | 1 | 100.00% |
