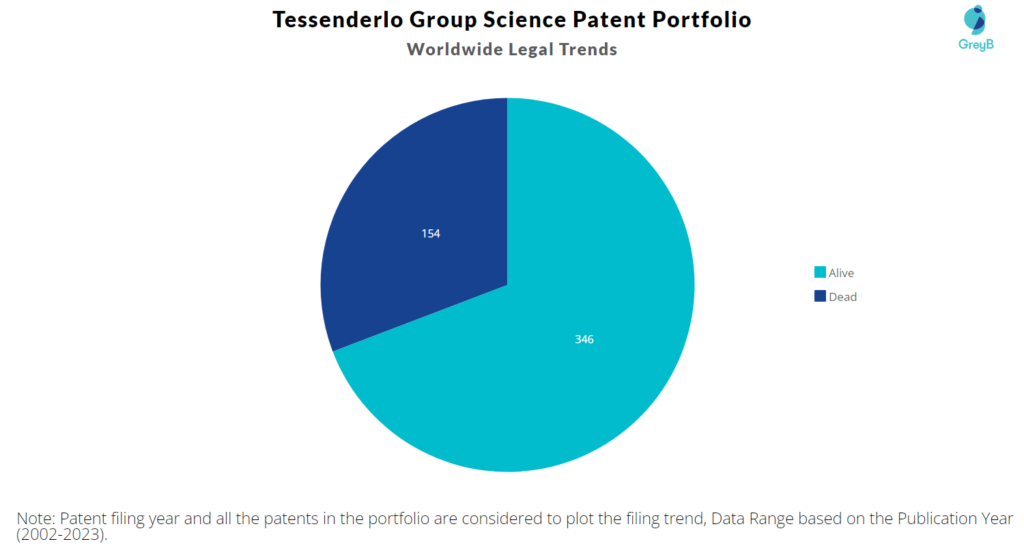
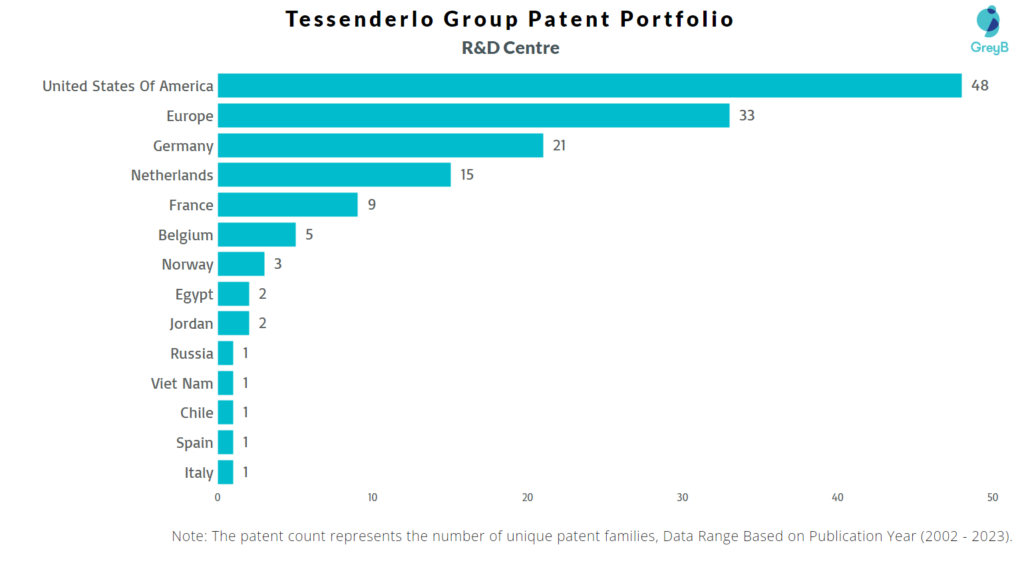
Tessenderlo Group has a total of 500 patents globally, out of which 232 have been granted. Of these 500 patents, more than 69% patents are active. Europe is where Tessenderlo Group has filed the maximum number of patents, followed by the United States of America and Germany. Parallelly, the United States of America seems to be the main focused R&D centre and also Belgium is the origin country of Tessenderlo Group.
Tessenderlo Group was founded in the year 1919. The Tessenderlo Group produces speciality chemicals for a range of industries. The company makes sulphate-based speciality fertilisers, gelatine and bio-residual processing, potassium sulphate fertilisers, water treatment products, and other things. Tessenderlo provides services to the consumer products industries of construction, agriculture, pharmaceuticals, and others. As of March 2023, the market cap of Tessenderlo Group is $2.6 Billion.
Do read about some of the most popular patents of Tessenderlo Group which have been covered by us in this article and also you can find Tessenderlo Group patents information, the worldwide patent filing activity and its patent filing trend over the years, and many other stats over Tessenderlo Group patent portfolio.
How many patents does the CEO of Tessenderlo Group have?
The CEO Luc Tack have 0 patents.
How many patents does Tessenderlo Group have?
Tessenderlo Group has a total of 500 patents globally. These patents belong to 143 unique patent families. Out of 500 patents, 346 patents are active.
How Many Patents did Tessenderlo Group File Every Year?
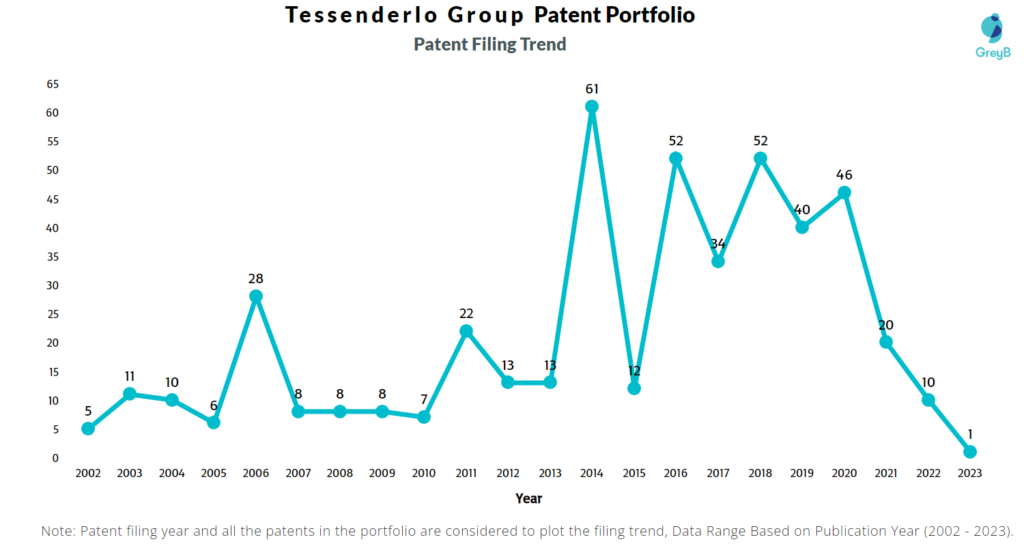
Are you wondering why there is a drop in patent filing for the last two years? It is because a patent application can take up to 18 months to get published. Certainly, it doesn’t suggest a decrease in the patent filing.
| Year of Patents Filing or Grant | Tessenderlo Group Applications Filed | Tessenderlo Group Patents Granted |
| 2023 | 1 | 4 |
| 2022 | 10 | 31 |
| 2021 | 20 | 35 |
| 2020 | 46 | 17 |
| 2019 | 40 | 24 |
| 2018 | 52 | 21 |
| 2017 | 34 | 14 |
| 2016 | 52 | 9 |
| 2015 | 12 | 8 |
| 2014 | 61 | 6 |
| 2013 | 13 | 6 |
| 2012 | 13 | 5 |
| 2011 | 22 | 3 |
How many Tessenderlo Group patents are Alive/Dead?
How Many Patents did Tessenderlo Group File in Different Countries?
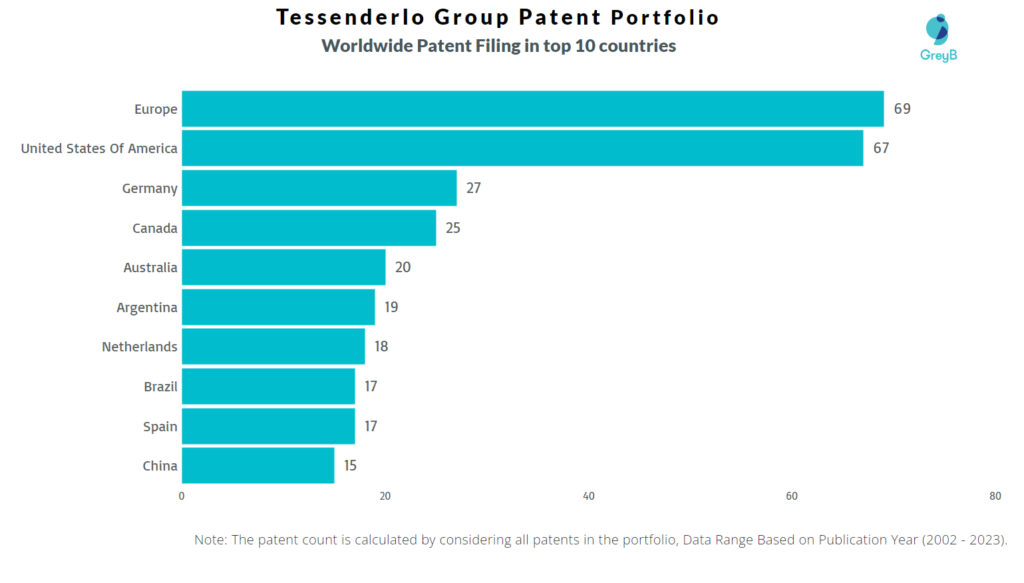
Countries in which Tessenderlo Group Filed Patents
| Country | Patent |
| Europe | 69 |
| United States Of America | 67 |
| Germany | 27 |
| Canada | 25 |
| Australia | 20 |
| Argentina | 19 |
| Netherlands | 18 |
| Brazil | 17 |
| Spain | 17 |
| China | 15 |
| Mexico | 14 |
| Poland | 11 |
| Chile | 11 |
| Belgium | 10 |
| Peru | 9 |
| India | 9 |
| Hungary | 8 |
| Turkey | 7 |
| France | 7 |
| Norway | 7 |
| Denmark | 6 |
| Portugal | 6 |
| Austria | 6 |
| Japan | 5 |
| Indonesia | 4 |
| Russia | 4 |
| South Africa | 4 |
| Korea (South) | 3 |
| Ukraine | 3 |
| Costa Rica | 3 |
| Viet Nam | 2 |
| Egypt | 2 |
| Philippines | 2 |
| Colombia | 2 |
| Eurasia | 2 |
| Hong Kong (S.A.R.) | 2 |
| Jordan | 2 |
| Ecuador | 1 |
| Kazakhstan | 1 |
| Taiwan | 1 |
| Serbia | 1 |
| Lithuania | 1 |
| Malaysia | 1 |
| Italy | 1 |
| Israel | 1 |
Where are Research Centres of Tessenderlo Group Patents Located?
10 Best Tessenderlo Group Patents
US7682219B2 is the most popular patent in the Tessenderlo Group portfolio. It has received 227 citations so far from companies like Nike, Ossur and Adidas.
Below is the list of 10 most cited patents of Tessenderlo Group:
| Publication Number | Citation Count |
| US7682219B2 | 227 |
| US6588237B2 | 213 |
| US20090068908A1 | 202 |
| US20080011021A1 | 112 |
| US6837771B2 | 108 |
| US6672762B1 | 78 |
| US6854296B1 | 65 |
| US6685534B2 | 51 |
| US6823763B1 | 48 |
| USD466273S1 | 47 |
How many inventions of other companies were rejected due to Tessenderlo Group patents?
The statistics below share strategic R&D insights. It tells the companies that were trying to protect inventions similar to Tessenderlo Group invention. They couldn’t because Tessenderlo Group had protected those before them.
Examiners at the USPTO referred 11 Tessenderlo Group patents in 48 rejections (35 USC § 102 or 35 USC § 103 types).
The top citing companies in the Tessenderlo Group patent portfolio are United Laboratories International, Earthcoat Plus and Wellmade Floor Covering.
List of the Companies whose Patents were rejected citing Tessenderlo Group –
| Company | Number of Patent Applications that faced Rejection Citing Tessenderlo Group Patents | Number of Rejections (102 & 103) |
| United Laboratories International | 3 | 5 |
| Earthcoat Plus | 3 | 12 |
| Wellmade Floor Covering | 2 | 2 |
| Stoller Enterprises | 1 | 3 |
| 3M | 1 | 1 |
| Eagle Us | 1 | 1 |
| Benjamin E Haglund | 1 | 1 |
| Oms Investments | 1 | 2 |
| Chevron Usa | 1 | 1 |
| Sabic Global Technologies | 1 | 3 |
Count of 102 and 103 Type Rejections based on Tessenderlo Group Patents

Top Tessenderlo Group Patents used in Rejecting Most Patent Applications
| Patent Number | Count of Rejected Applications |
| US7204967B2 | 4 |
| US20110207870A1 | 4 |
| US7018643B2 | 3 |
| US20070037711A1 | 3 |
| US8637091B2 | 3 |
| US7781375B2 | 2 |
| US6464995B1 | 2 |
| US20100147776A1 | 1 |
| US20110207839A1 | 1 |
| US7431902B2 | 1 |
| US6514512B1 | 1 |
What Percentage of Tessenderlo Group US Patent Applications were Granted?
Tessenderlo Group (Excluding its subsidiaries) has filed 14 patent applications at USPTO so far (Excluding Design and PCT applications). Out of these 4 have been granted leading to a grant rate of 80%.
Below are the key stats of Tessenderlo Group patent prosecution at the USPTO.

Which Law Firms Filed Most US Patents for Tessenderlo Group?
| Law Firm | Total Applications | Success Rate |
| Hoyng Rokh Monegie | 11 | 80% |
| Fennemore Craig | 2 | 0% |
| N V Nederlandsch Octrooibureau | 1 | 0% |
