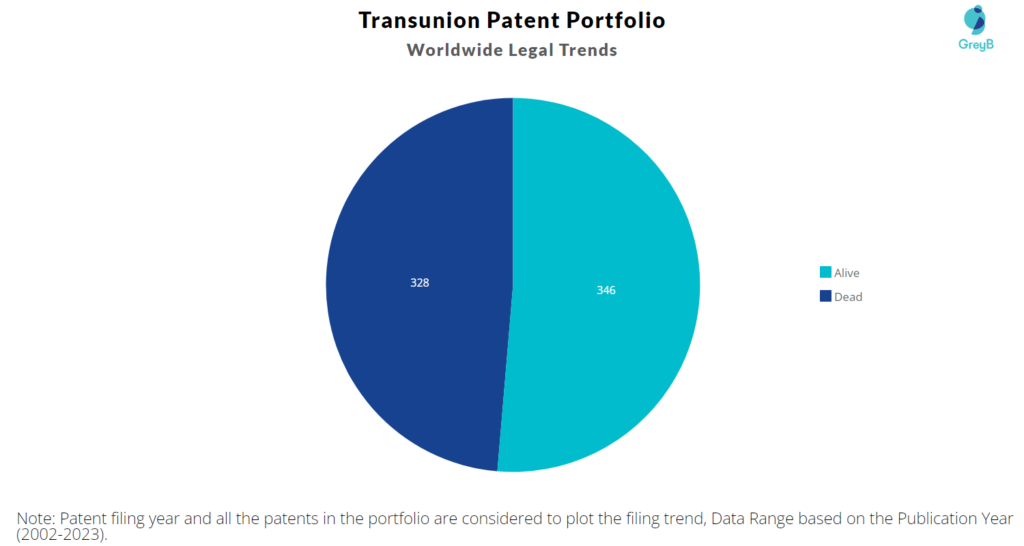
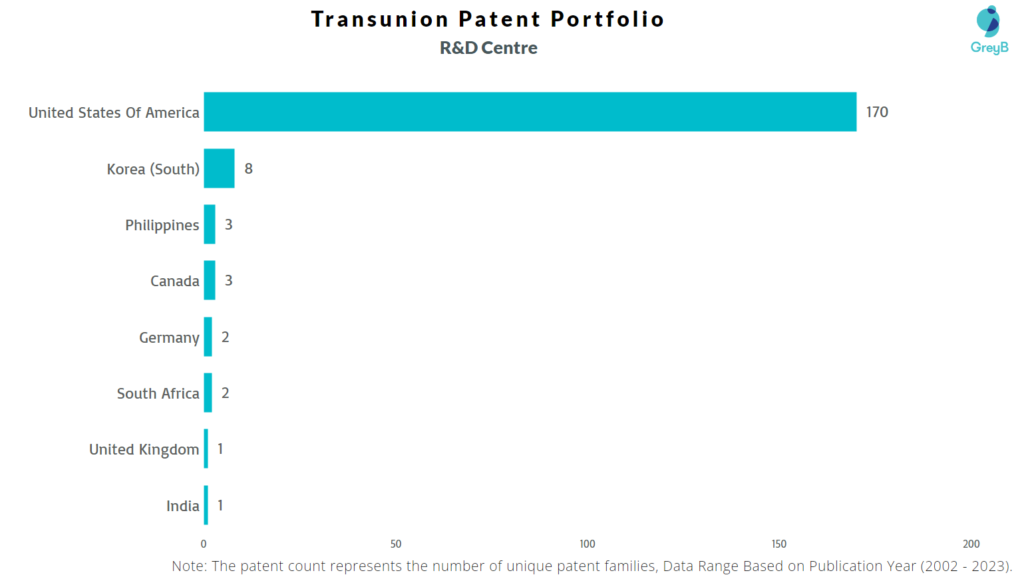
Transunion has a total of 674 patents globally, out of which 254 have been granted. Of these 674 patents, more than 51% patents are active. The United States of America is where Transunion has filed the maximum number of patents, followed by Canada and Europe. Parallelly, the United States of America seems to be the main focused R&D centre and also is the origin country of Transunion.
Transunion was founded in the year 1968. Transunion is a business that provides credit reports. In addition to providing risk and information solutions, the company delivers consumer reports, risk scores, analytical services, and decision-making capabilities. As of April 2023, Transunion has a market cap of $12.05 Billion.
Do read about some of the most popular patents of Transunion which have been covered by us in this article and also you can find Transunion patents information, the worldwide patent filing activity and its patent filing trend over the years, and many other stats over Transunion patent portfolio.
How many patents does the founder and the CEO of Transunion have?
The CEO Chris Cartwright have 0 patents.
How many patents does Transunion have?
Transunion has a total of 674 patents globally. These patents belong to 192 unique patent families. Out of 674 patents, 346 patents are active.
How Many Patents did Transunion File Every Year?
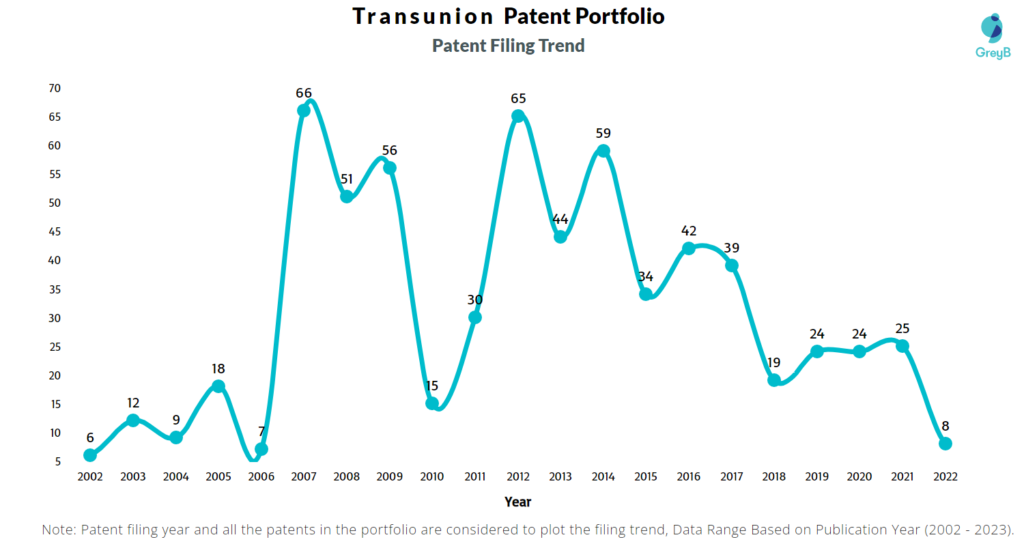
Are you wondering why there is a drop in patent filing for the last two years? It is because a patent application can take up to 18 months to get published. Certainly, it doesn’t suggest a decrease in the patent filing.
| Year of Patents Filing or Grant | Transunion Applications Filed | Transunion Patents Granted |
| 2023 | – | 4 |
| 2022 | 8 | 14 |
| 2021 | 25 | 19 |
| 2020 | 24 | 21 |
| 2019 | 24 | 17 |
| 2018 | 19 | 19 |
| 2017 | 39 | 21 |
| 2016 | 42 | 22 |
| 2015 | 34 | 20 |
| 2014 | 59 | 25 |
| 2013 | 44 | 19 |
| 2012 | 65 | 11 |
| 2011 | 30 | 10 |
How many Transunion patents are Alive/Dead?
How Many Patents did Transunion File in Different Countries?
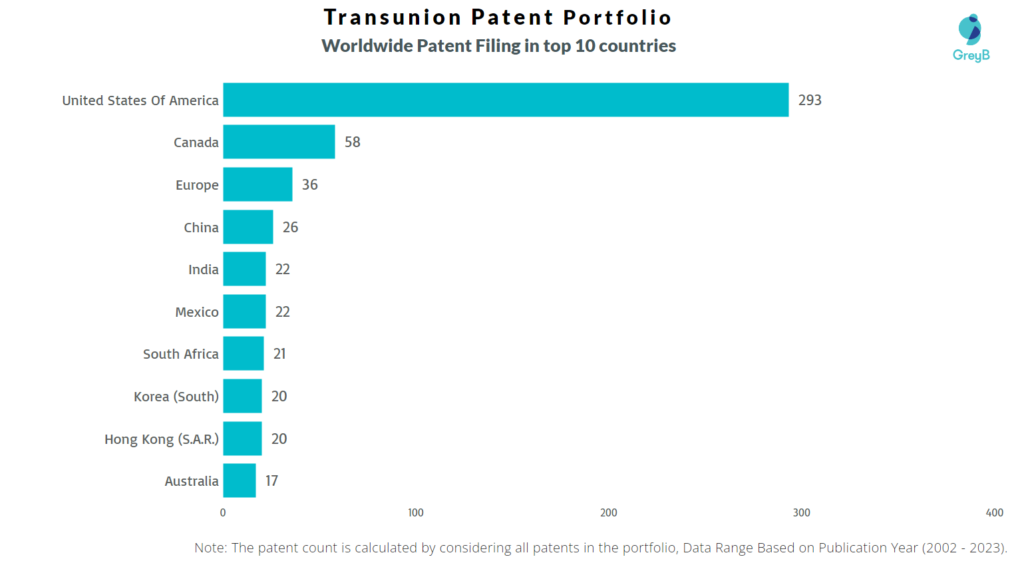
Countries in which Transunion Filed Patents
| Country | Patent |
| United States Of America | 293 |
| Canada | 58 |
| Europe | 36 |
| China | 26 |
| India | 22 |
| Mexico | 22 |
| South Africa | 21 |
| Korea (South) | 20 |
| Hong Kong (S.A.R.) | 20 |
| Australia | 17 |
| Japan | 16 |
| Brazil | 15 |
| Philippines | 14 |
| Singapore | 8 |
| Dominican Republic | 5 |
| Colombia | 4 |
| Germany | 3 |
| United Kingdom | 2 |
| Austria | 1 |
| Lithuania | 1 |
| Africa | 1 |
| Spain | 1 |
Where are Research Centres of Transunion Patents Located?
10 Best Transunion Patents
US20040039798A1 is the most popular patent in the Transunion portfolio. It has received 540 citations so far from companies like Microsoft, Amazon and Cloudflare.
Below is the list of 10 most cited patents of Transunion:
| Publication Number | Citation Count |
| US20040039798A1 | 540 |
| US6684250B2 | 489 |
| US20050154664A1 | 446 |
| US7072963B2 | 358 |
| US6748426B1 | 268 |
| US20060041464A1 | 217 |
| US7272728B2 | 217 |
| US20130179982A1 | 206 |
| US7774270B1 | 183 |
| US20020136391A1 | 182 |
How many inventions of other companies were rejected due to Transunion patents?
The statistics below share strategic R&D insights. It tells the companies that were trying to protect inventions similar to Transunion invention. They couldn’t because Transunion had protected those before them.
Examiners at the USPTO referred 138 Transunion patents in 1111 rejections (35 USC § 102 or 35 USC § 103 types).
The top citing companies in the Transunion patent portfolio are IBM, Microsoft and Google.
List of the Companies whose Patents were rejected citing Transunion –
| Company | Number of Patent Applications that faced Rejection Citing Transunion Patents | Number of Rejections (102 & 103) |
| IBM | 31 | 71 |
| Microsoft | 19 | 34 |
| 17 | 33 | |
| American Express | 14 | 27 |
| Bank Of America | 10 | 22 |
| Amazon | 8 | 14 |
| Samsung | 7 | 22 |
| Visa | 6 | 12 |
| Verizon | 6 | 20 |
| Adobe | 5 | 19 |
Count of 102 and 103 Type Rejections based on Transunion Patents
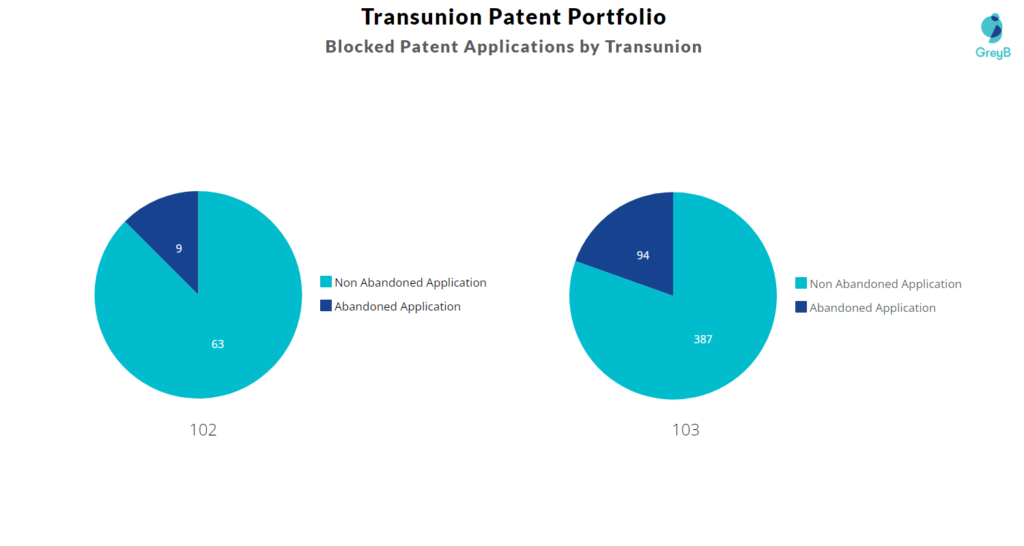
Top Transunion Patents used in Rejecting Most Patent Applications
| Patent Number | Count of Rejected Applications |
| US20080134282A1 | 19 |
| US8160614B2 | 18 |
| US6684250B2 | 17 |
| US8769304B2 | 16 |
| US20080134045A1 | 14 |
| US20130035975A1 | 14 |
| US20080059152A1 | 13 |
| US20050154664A1 | 13 |
| US8776225B2 | 13 |
| US20080133729A1 | 12 |
| US20040039798A1 | 12 |
| US10810218B2 | 11 |
| US8244571B2 | 9 |
| US8560610B2 | 8 |
| US7630932B2 | 8 |
