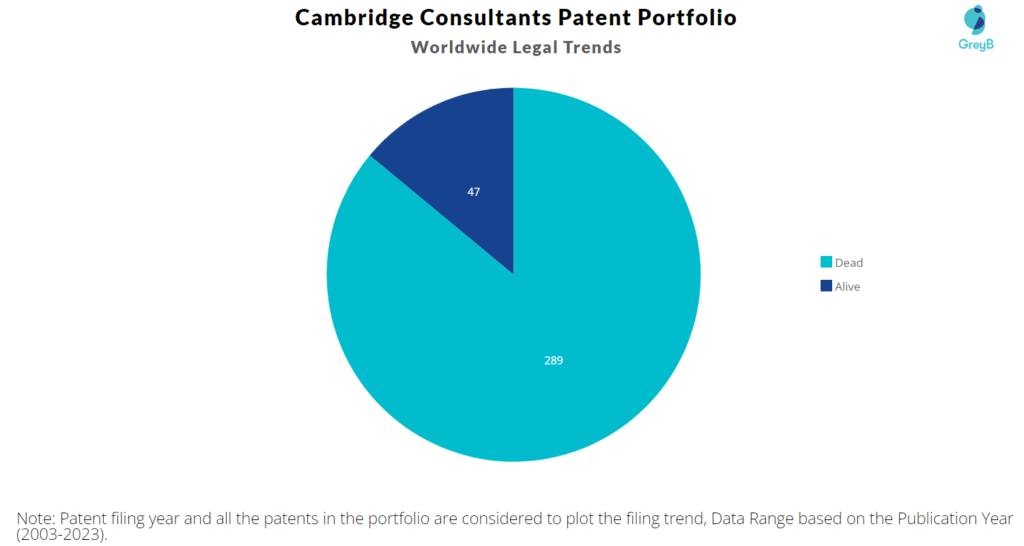
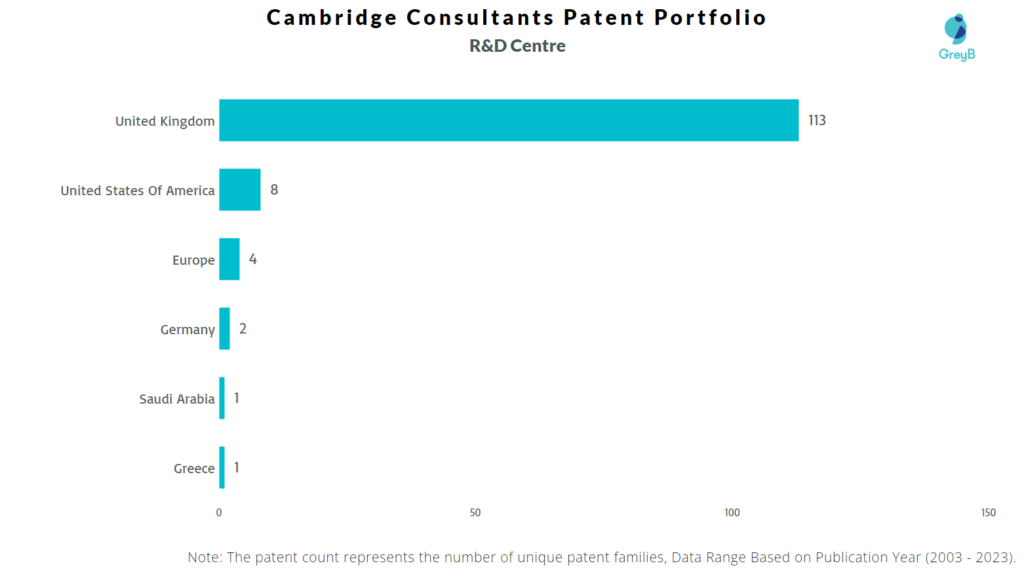
Cambridge Consultants has a total of 336 patents globally, out of which 92 have been granted. Of these 336 patents, more than 13% patents are active. The United Kingdom is where Cambridge Consultants has filed the maximum number of patents, followed by Europe and United States of America. Parallelly, The United Kingdom seems to be the main focused R&D center and also US is the origin country of Cambridge Consultants.
Cambridge Consultants was founded in 1960. The Company is a product development company. The Company provides a range of technology consulting services and specializes in wireless product development and medical product development. Company serves blue-chip companies, startup companies, and government agencies.
Do read about some of the most popular patents of Cambridge Consultants which have been covered by us in this article and also you can find Cambridge Consultants patents information, the worldwide patent filing activity and its patent filing trend over the years, and many other stats over Cambridge Consultants patent portfolio.
How many patents does Cambridge Consultants have?
Cambridge Consultants has a total of 336 patents globally. These patents belong to 130 unique patent families. Out of 336 patents, 47 patents are active.
How Many Patents did Cambridge Consultants File Every Year?
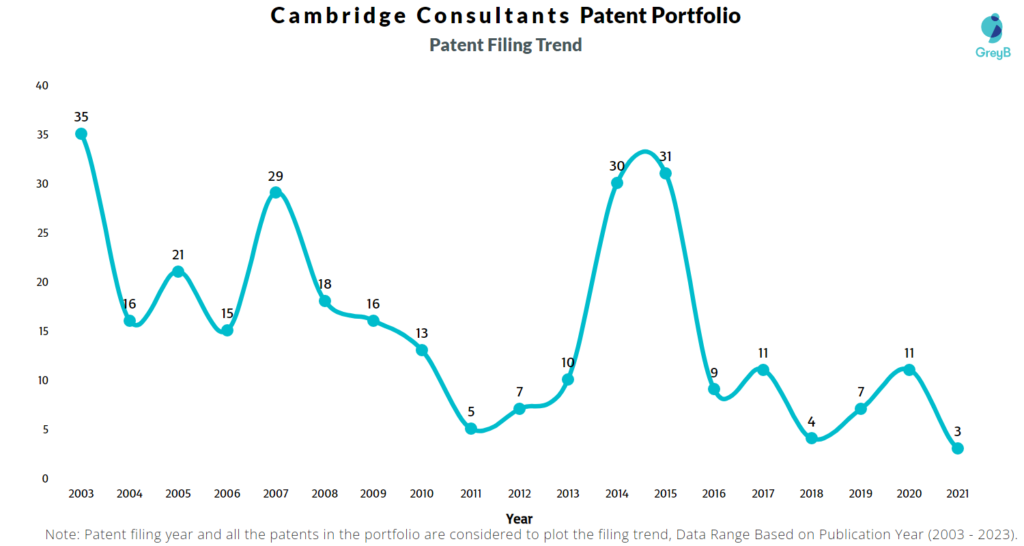
Are you wondering why there is a drop in patent filing for the last two years? It is because a patent application can take up to 18 months to get published. Certainly, it doesn’t suggest a decrease in the patent filing.
| Year of Patents Filing or Grant | Cambridge Consultants Applications Filed | Cambridge Consultants Patents Granted |
| 2023 | – | 1 |
| 2022 | – | 3 |
| 2021 | 3 | 4 |
| 2020 | 11 | 10 |
| 2019 | 7 | 2 |
| 2018 | 4 | 1 |
| 2017 | 11 | 7 |
| 2016 | 9 | 2 |
| 2015 | 31 | 1 |
| 2014 | 30 | 4 |
| 2013 | 10 | 4 |
| 2012 | 7 | 8 |
How many Cambridge Consultants patents are Alive/Dead?
Worldwide Patents
How Many Patents did Cambridge Consultants File in Different Countries?
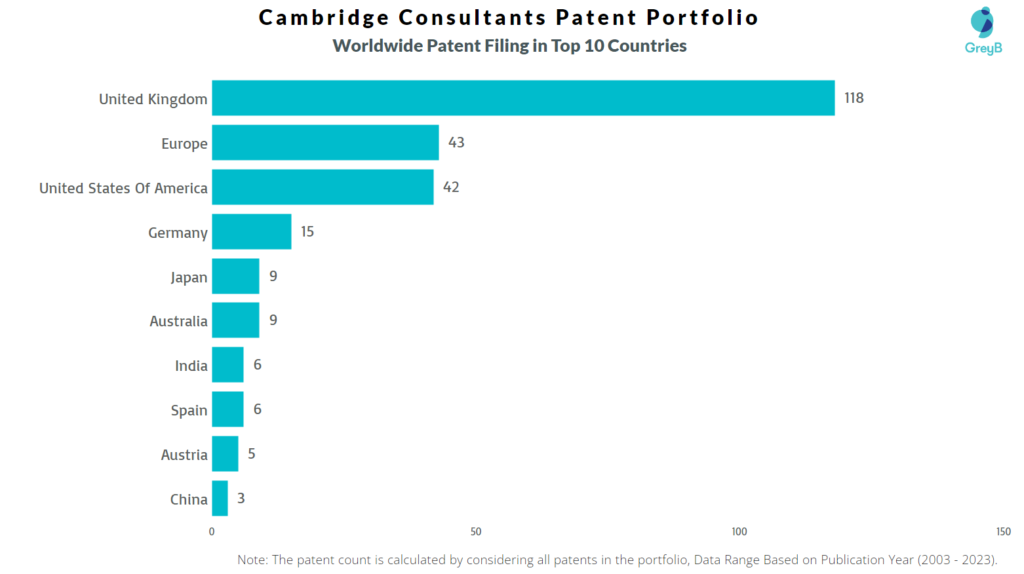
Countries in which Cambridge Consultants Filed Patents
| Country | Patents |
| United Kingdom | 118 |
| Europe | 43 |
| United States Of America | 42 |
| Germany | 15 |
| Japan | 9 |
| Australia | 9 |
| India | 6 |
| Spain | 6 |
| Austria | 5 |
| China | 3 |
| Canada | 3 |
| South Africa | 2 |
| Poland | 2 |
| Mexico | 2 |
| Brazil | 1 |
| Saudi Arabia | 1 |
| Korea (South) | 1 |
| France | 1 |
| Portugal | 1 |
| Russia | 1 |
| Israel | 1 |
Where are Research Centers of Cambridge Consultants Patents Located?
10 Best Cambridge Consultants Patents
WO2003065135A1 is the most popular patent in the Cambridge Consultants portfolio. It has received 136 citations so far from companies like General Electric, Alstom Technology and Honeywell.
Below is the list of 10 most cited patents of Cambridge Consultants:
| Publication Number | Citation Count |
| WO2003065135A1 | 136 |
| US7016779B2 | 135 |
| US20150382085A1 | 132 |
| WO2007012854A1 | 63 |
| WO2007144614A1 | 60 |
| WO2007012861A1 | 60 |
| US20100212667A1 | 59 |
| WO2008020217A1 | 51 |
| US20080316605A1 | 50 |
| US7227493B2 | 49 |
How many inventions of other companies were rejected due to Cambridge Consultants patents?
The statistics below share strategic R&D insights. It tells the companies that were trying to protect inventions similar to Cambridge Consultants invention. They couldn’t because Cambridge Consultants had protected those before them.
Examiners at the USPTO referred 21 Cambridge Consultants patents in 222 rejections (35 USC § 102 or 35 USC § 103 types).
The top citing companies in the Cambridge Consultants patent portfolio are Arm Holdings, Robert Bosch and Gm Global Technology.
List of the Companies whose Patents were rejected citing Cambridge Consultants –
| Company | Number of Patent Applications that faced Rejection Citing Cambridge Consultants Patents | Number of Rejections (102 & 103) |
| Arm Holdings | 5 | 13 |
| Robert Bosch | 5 | 12 |
| Gm Global Technology | 5 | 11 |
| Samsung | 4 | 10 |
| Qualcomm | 4 | 6 |
| Intel | 4 | 11 |
| Peloton Technology | 2 | 3 |
| Microsoft | 2 | 4 |
| Manta Devices | 2 | 5 |
| Semiconductor Energy Laboratory | 2 | 3 |
Count of 102 and 103 Type Rejections based on Cambridge Consultants Patents
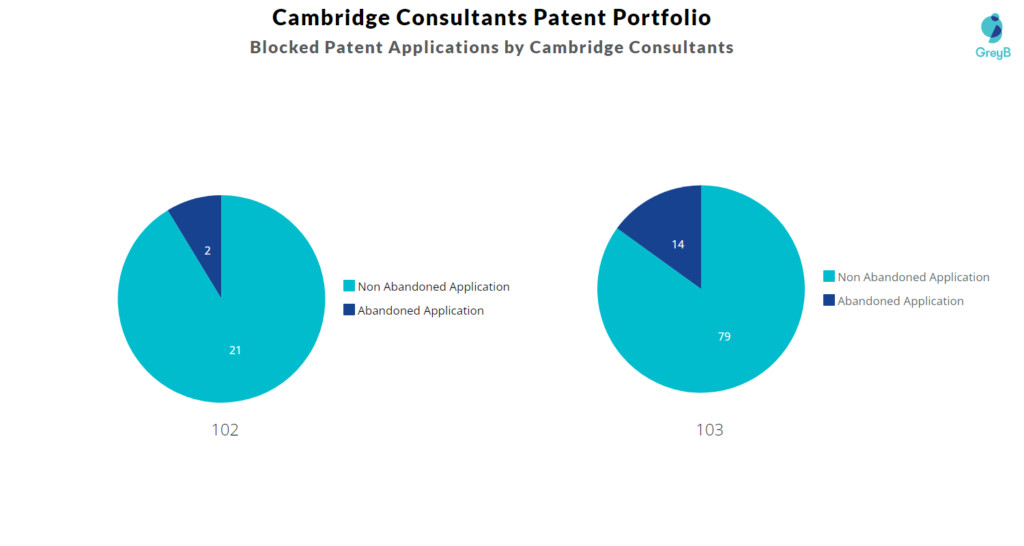
Top Cambridge Consultants Patents used in Rejecting Most Patent Applications
| Patent Number | Count of Rejected Applications |
| US7750841B2 | 28 |
| US9645949B2 | 10 |
| US9652241B2 | 10 |
| US7016779B2 | 7 |
| US8261739B2 | 6 |
| US7227493B2 | 6 |
| US6515615B2 | 5 |
| US20060243469A1 | 5 |
| US10366550B2 | 5 |
| US8683163B2 | 4 |
| US8742368B2 | 3 |
| US20050108662A1 | 2 |
| US7084980B2 | 2 |
| US20130047985A1 | 2 |
| US20080316605A1 | 2 |
What are Cambridge Consultants key innovation segments?
What Technologies are Covered by Cambridge Consultants?
The chart below distributes patents filed by Cambridge Consultants
