Patent data rarely lies and in surgical devices, it tells a story worth paying close attention to.
The surgical devices sector sits at the intersection of several powerful forces: aging global populations, rising demand for minimally invasive procedures, the rapid expansion of robotic-assisted surgery and increasing pressure on healthcare systems to deliver better outcomes at lower cost. As these forces converge, so does the competition to own the underlying technology.
This analysis examines the global surgical devices patent landscape from 2021 to 2026, drawing on data across filing trends, geographic distribution, leading companies, key inventors and portfolio strategy. Certain metrics, including continuation filings, patent status and FIT classifications, reflect US patent data specifically.
For IP professionals and R&D strategists, the numbers here go beyond simple counts. They surface questions about where innovation is actually happening versus where it’s being protected, which players are building durable portfolios versus filing defensively and where the white space or the litigation risk may be greatest. What follows is a structured look at each of those dimensions.
How has the Surgical Devices Patent Filing Trend Changed in the Last 5 years?
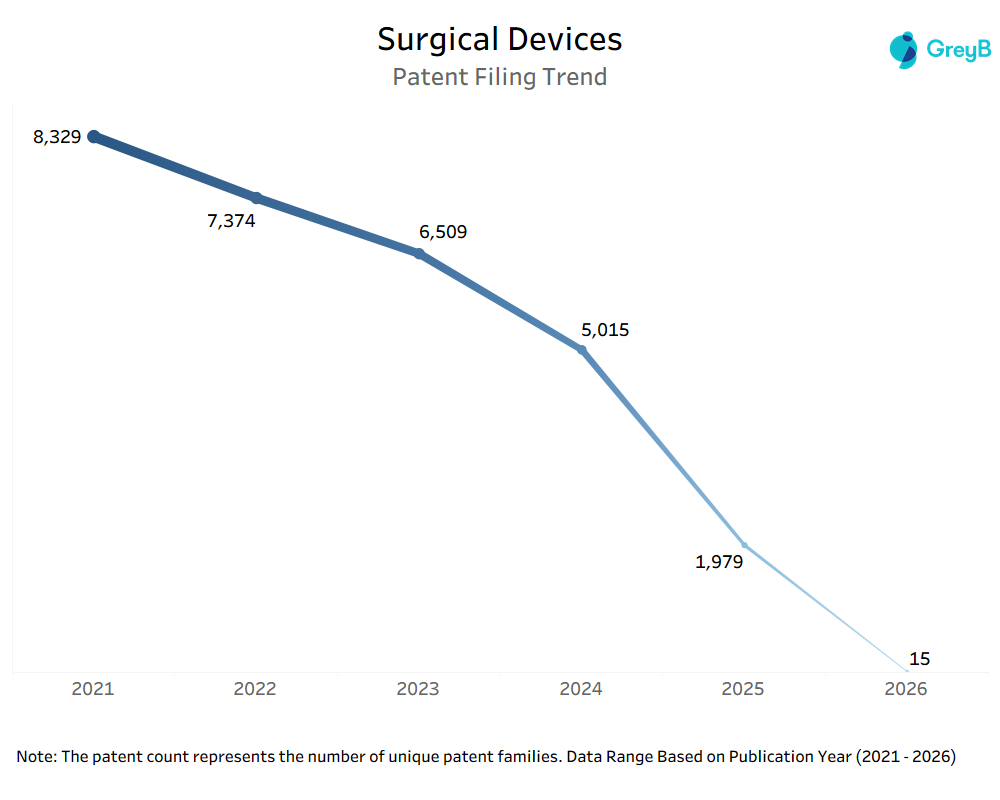
The chart shows a consistent decline in surgical device patent filings from 8,329 in 2021 to 5,015 in 2024, followed by a sharp drop to 1,979 in 2025 and a minimal count in 2026.
However, the steep decline observed in 2025 and 2026 is likely influenced by the inherent delay in patent publication timelines, where applications typically become visible 18 months after filing. As a result, recent years often appear underrepresented.
This suggests that the apparent drop does not necessarily indicate a slowdown in innovation within the surgical devices domain, but rather reflects data incompleteness for the most recent years. The steady decline from 2021 to 2024, however, may indicate a phase of consolidation or a shift in innovation focus within the industry.
Which Countries Lead Surgical Device Patent Landscape?
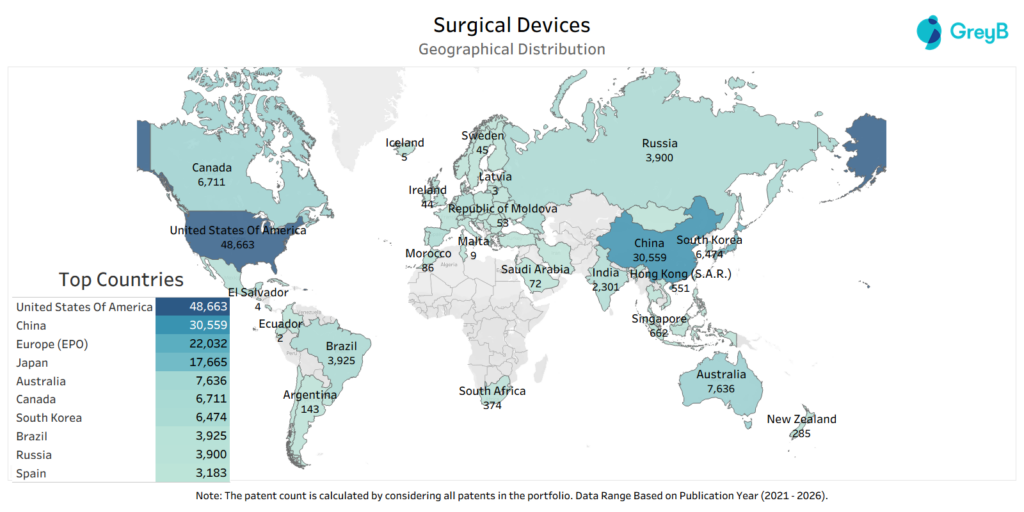
The chart highlights a strong geographical concentration of surgical device patent filings, with the United States leading significantly at 48,663 filings, followed by China (30,559). Other notable contributors include Australia, Canada, South Korea, and Russia, though at considerably lower volumes.
This concentration is likely driven by the presence of advanced healthcare ecosystems, strong R&D infrastructure, and favorable regulatory and funding environments in these regions. The dominance of the US and China reflects their continued investment in medical technologies and innovation capabilities.
This suggests that surgical device innovation is heavily centralized in a few key markets, with limited contributions from emerging regions. For stakeholders, this highlights the importance of focusing on these dominant geographies for competitive intelligence, partnerships, and market entry strategies.
Where Are Surgical Device Patents Research Centers Located?
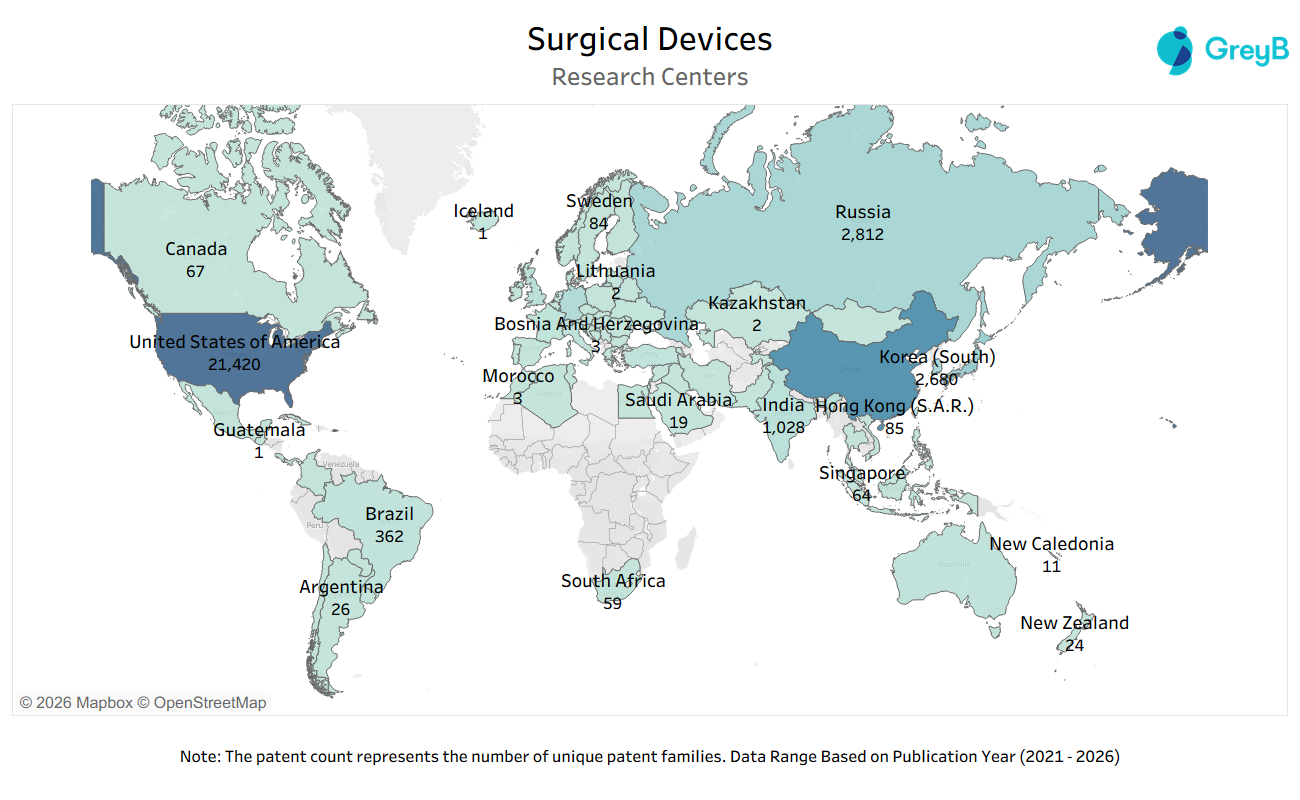
The chart indicates that research activity is highly concentrated in the United States, significantly outpacing other regions, with additional contributions from countries such as Russia and South Korea.
While this broadly aligns with the geographical distribution of patent filings, the level of concentration in the United States is even more pronounced at the research stage.
This suggests that early-stage innovation in surgical devices is strongly centralized, with the United States playing a dominant role in shaping future technologies. As a result, companies looking to access cutting-edge developments may need to prioritize engagement with these key R&D hubs.
Which Are The Top Companies With Most Surgical Device Patents?
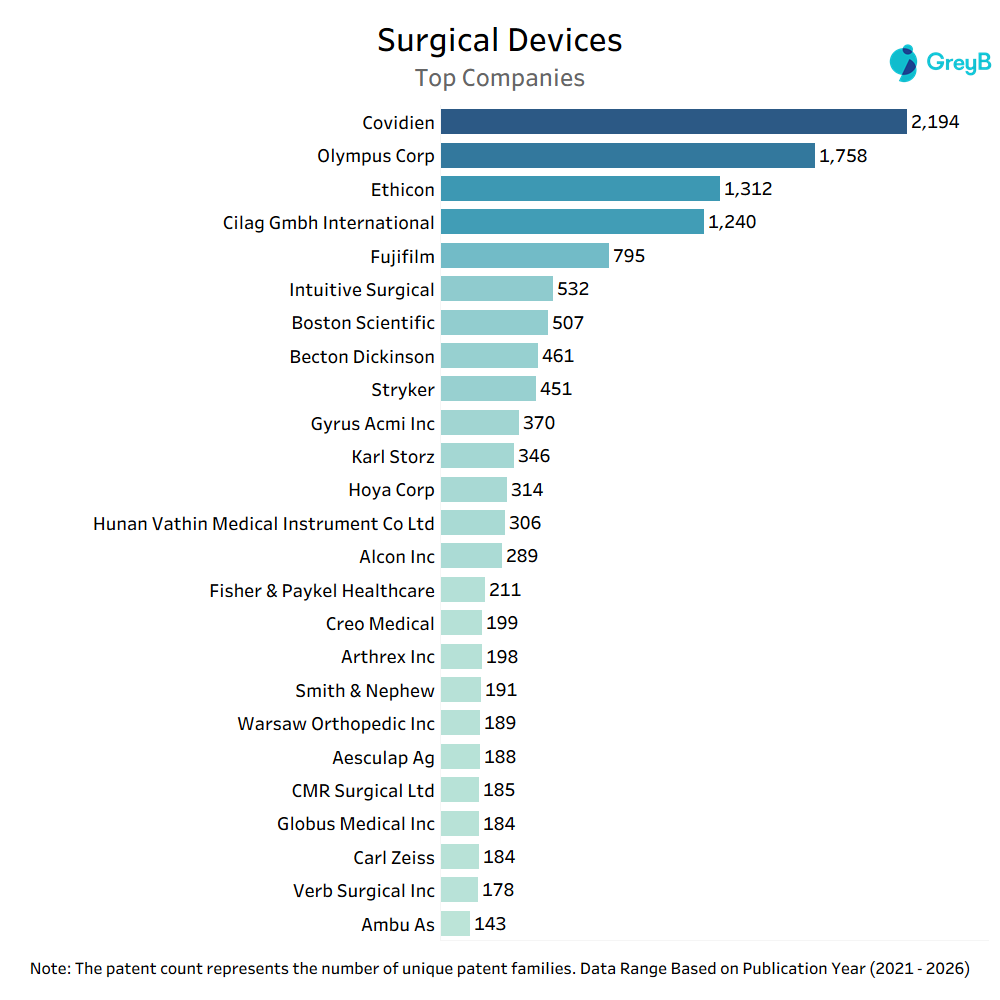
The chart highlights that patent activity in the surgical devices domain is led by a few key players, with Covidien (2,194 filings) and Olympus Corp (1,758) holding a clear lead, followed by Ethicon and Cilag GmbH International. Beyond the top four, there is a noticeable drop in patent counts, with other companies contributing at relatively lower levels.
This distribution indicates a high level of concentration among leading medical device companies, likely driven by their established product portfolios, strong R&D capabilities, and continuous investment in innovation. The presence of companies like Intuitive Surgical and Boston Scientific further reflects ongoing advancements in minimally invasive and robotic surgical technologies.
This suggests that innovation in surgical devices is largely dominated by a handful of major players, creating a competitive landscape where scale, technological expertise, and sustained R&D investment play a critical role. For new entrants, this may indicate high entry barriers, while for existing players, it underscores the importance of maintaining strong patent portfolios to retain competitive advantage.
Who Are the Key Inventors in Surgical Devices Patent Landscape?
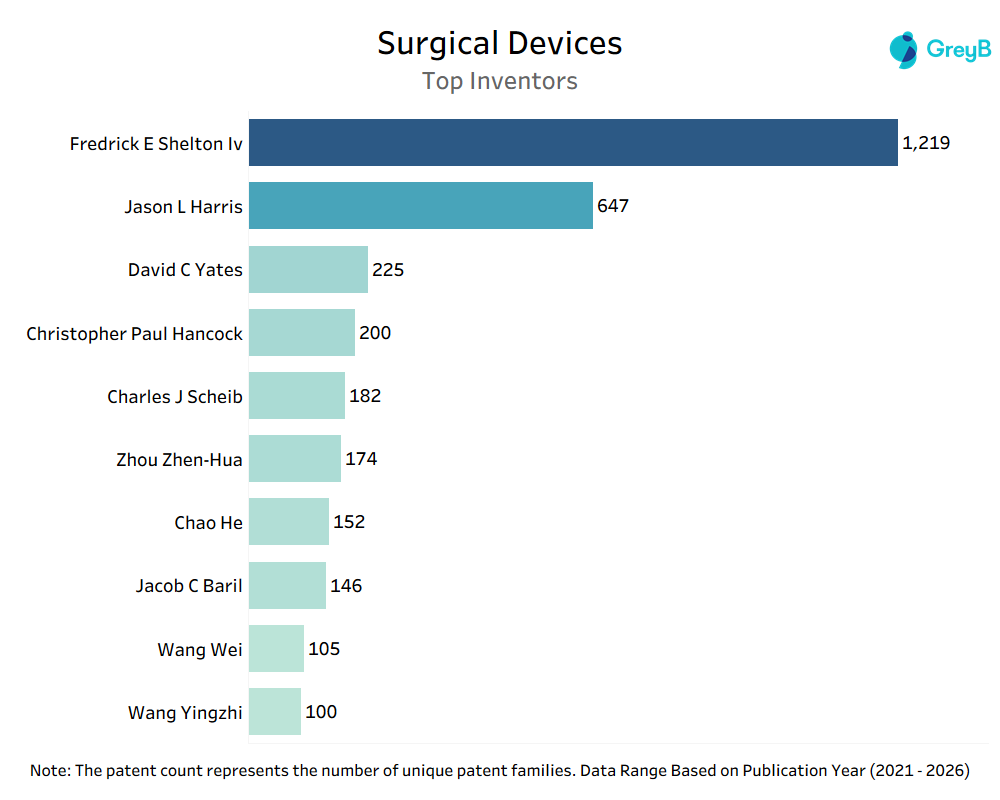
The chart shows a significant concentration of patent activity among a few leading inventors, with Fredrick E. Shelton IV (1,219 filings) holding a substantial lead, followed by Jason L. Harris (647). Beyond the top two, there is a sharp decline in patent counts, with other inventors contributing at comparatively lower levels.
This distribution suggests that innovation within the surgical devices domain is strongly influenced by a small group of highly prolific inventors, likely supported by robust institutional backing and continuous involvement in product development cycles. The steep drop after the top contributors indicates limited concentration of high-volume inventors across the broader ecosystem.
This indicates that key individuals play a critical role in driving technological advancements in surgical devices. For stakeholders, this highlights the importance of tracking leading inventors for collaboration, talent acquisition, and competitive intelligence, as they are likely to shape future innovation trajectories.
How Do Patent Legal Status in Surgical Devices Compare Across Key Markets?
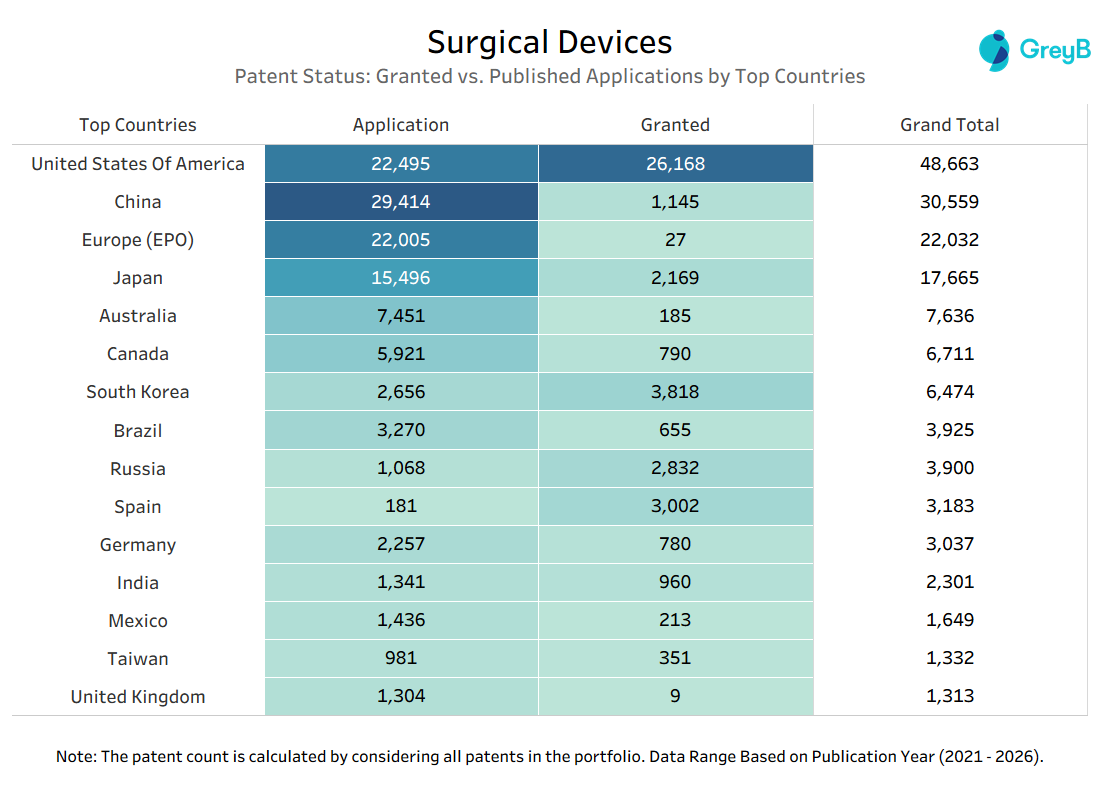
The chart shows notable differences in the proportion of granted patents versus published applications across key countries. The United States leads with a high number of granted patents (26,168), closely aligning with its application volume, while countries like China and Europe (EPO) have a significantly larger share of applications compared to granted patents.
This variation is likely driven by differences in patent examination timelines, regulatory frameworks, and filing strategies. For instance, the high number of applications in China and Europe may reflect ongoing filings that are still under examination, while the United States shows a more mature patent landscape with a higher conversion of applications into grants.
This suggests that the surgical device patent landscape is more mature and enforceable in certain jurisdictions, particularly the United States, whereas other regions may represent emerging or evolving patent portfolios. For stakeholders, this highlights the importance of considering both filing volume and grant status when evaluating market strength, freedom-to-operate, and enforcement potential.
How Do US Surgical Device Filers Extend Their Patent Coverage?
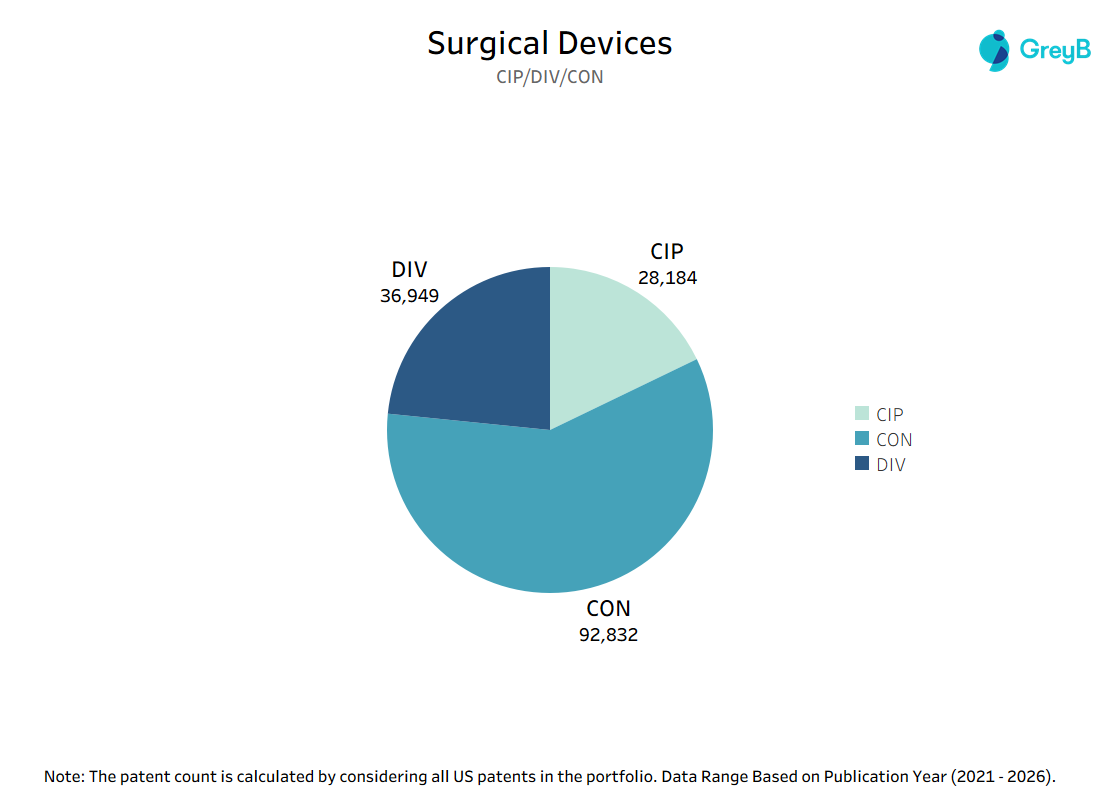
The chart shows that continuation (CON) applications dominate the landscape with 92,832 filings, significantly higher than divisional (DIV: 36,949) and continuation-in-part (CIP: 28,184) applications.
This distribution indicates a strong reliance on continuation strategies, which are typically used to extend claim scope, refine protection, and maintain long-term control over key technologies. The relatively lower share of CIP filings suggests limited introduction of new subject matter within existing patent families, while divisional filings reflect responses to patent office requirements such as restriction objections.
This suggests that companies in the surgical devices domain are strategically focusing on strengthening and prolonging their existing patent portfolios rather than introducing entirely new innovations within the same filings. For stakeholders, this highlights a competitive landscape where IP strategy is centered on maximizing protection breadth and lifecycle management, making it critical to monitor continuation chains for potential claim expansions.
What Is the Litigation Risk Profile of US Surgical Device Patents?
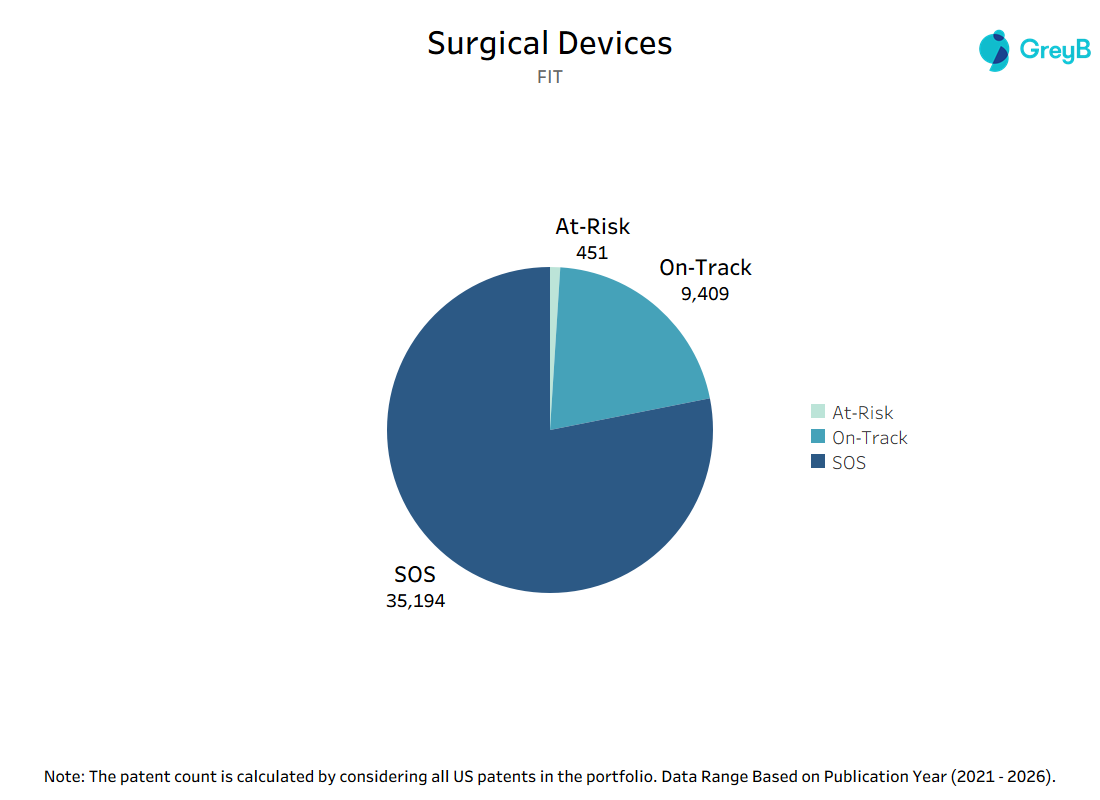
The chart shows that a significant majority of patents fall under the “SOS” category (35,194), followed by a smaller portion categorized as “On-Track” (9,409), and a minimal share classified as “At-Risk” (451).
This distribution suggests that a large portion of the patent portfolio is likely in a stable or secured state, with relatively few patents facing immediate risk. The limited number of at-risk patents may indicate effective portfolio management and strong prosecution strategies within the surgical devices domain.
This indicates that the overall patent landscape is relatively robust, with most assets either well-positioned or progressing as expected. For stakeholders, this highlights a competitive environment where maintaining strong, defensible patents is critical, while also suggesting limited immediate vulnerability across the broader portfolio.
3,736 patent families filed in 2026 with no prior family members in the last 5 years — potential whitespace hiding in plain sight. Want the full list? Fill out the form below.
The insights presented in this article are based on patent data analysis derived from publicly available sources and GreyB’s proprietary methodologies. While efforts have been made to ensure accuracy and completeness, recent patent filings may be subject to publication delays, and certain data points may evolve over time. The analysis is intended for informational purposes only and should not be considered as legal or investment advice.
Get Customized Insights for Your Business
Looking for deeper, tailored insights specific to your technology or competitors?
GreyB provides customized patent landscape and competitive intelligence reports to help you:
- Identify emerging technologies and whitespace opportunities
- Track competitor strategies and innovation focus
- Assess patent risks and enforcement potential
- Make informed R&D and business decisions.
Fill out the form to request your customized industry report and get insights aligned with your business needs.