Netflix needs no introduction. From a DVD-by-mail service into a global streaming giant. By mid-2025, its market cap surpassed $530 billion—more than double its 2020 valuation—while net income reached ~$9.3 billion (TTM), up from $1.86 billion in 2019. New ventures like ad-supported plans, live events, and “Netflix House” experiences are fueling its push toward a $1 trillion valuation by 2030.
Below are 15 key statistics and insights into Netflix’s patent portfolio. You can also read our analysis, What is Inside Netflix’s Patents, to get high-level details on:
1. Different technology areas where Netlfix has filed patents
2. Some of the top problems solved by Netflix patents in different technology areas
How many patents does Netflix have?
Netflix’s patent portfolio has a total of 2330 patents in its worldwide patent portfolio which belong to 420 unique patent families. Out of 2330 patents, 933 are patent applications, and 1397 are granted patents.
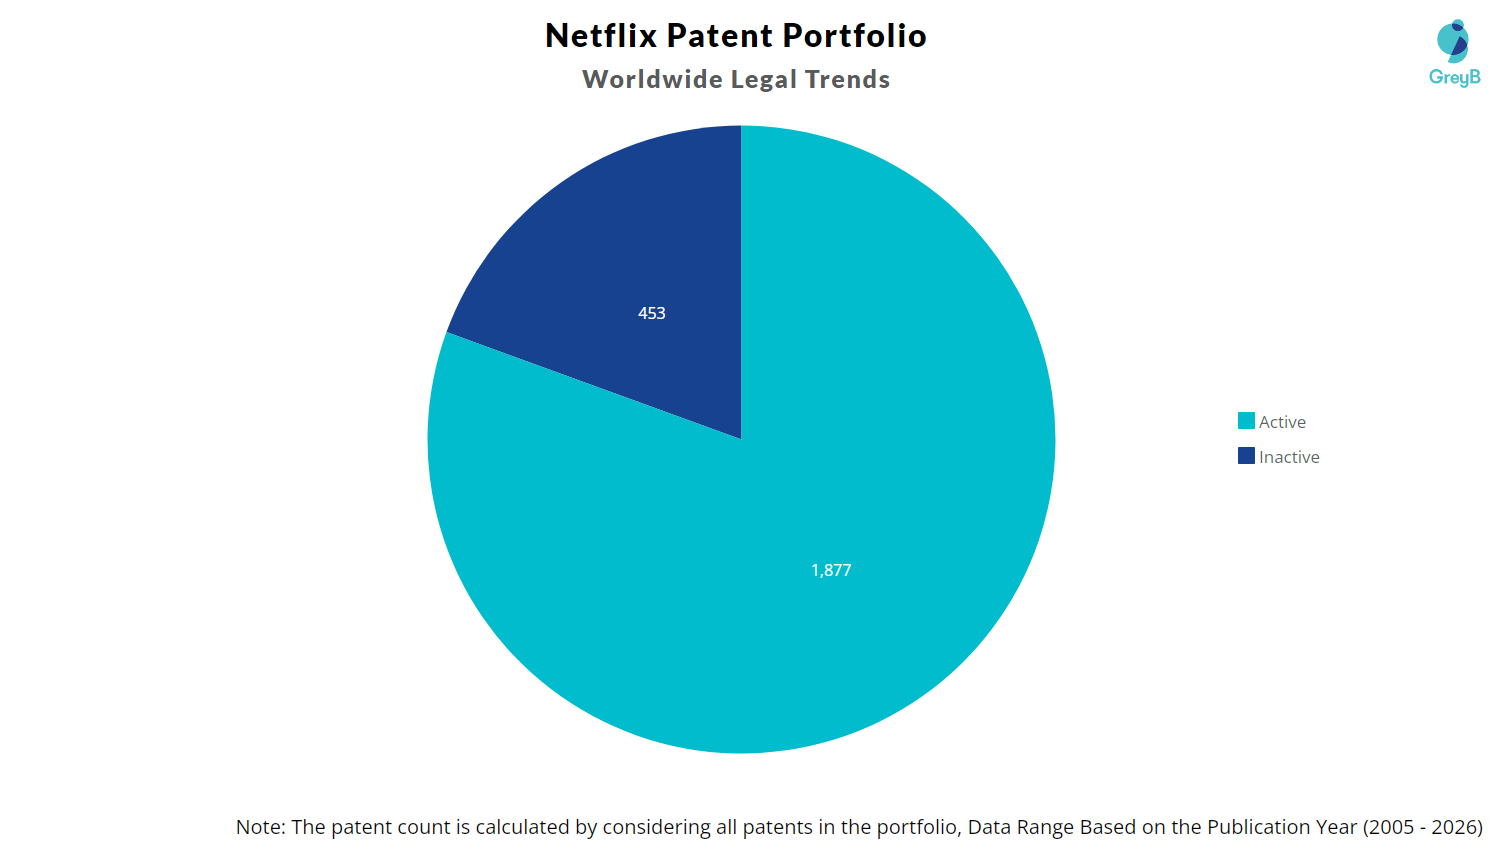
Also, 453 out of 2330 patents are inactive in the Netflix patent portfolio. These inactive patents include 432 applications and 21 granted patents. The rest of 1877 alive patent documents consists of 501 applications and 1376 granted patents.
How many Netflix Patents are Alive/Dead?
Worldwide Patents
How many patent applications did Netflix file every year?
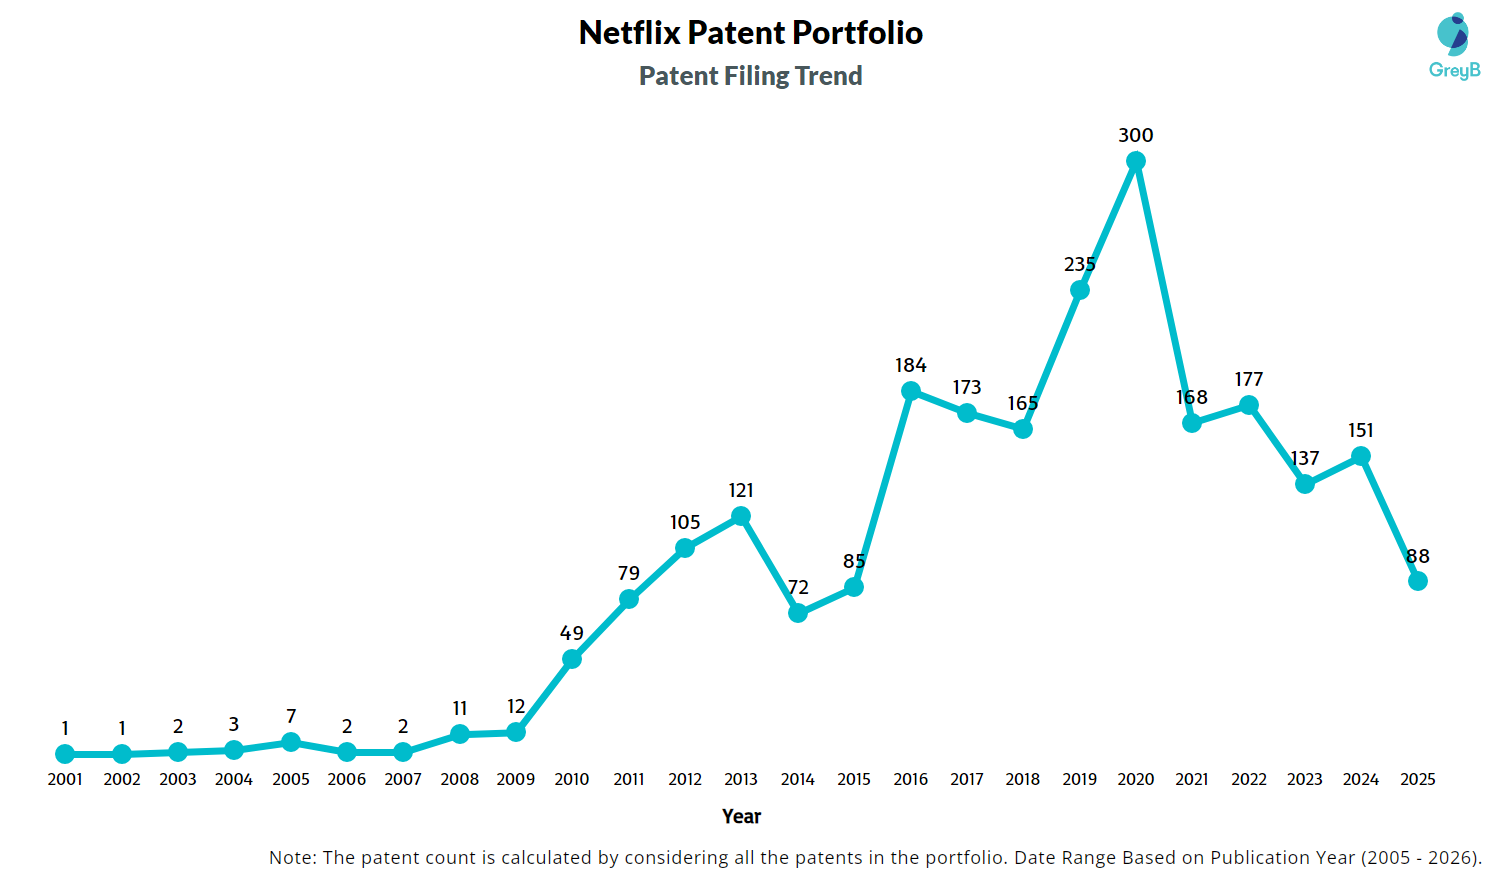
Are you wondering why there is a drop in patent filing for the last two years? It is because a patent application can take up to 18 months to get published. Certainly, it doesn’t suggest a decrease in the patent filing.
| Year of Patents Filing or Grant | Netflix Applications Filed | Netflix Patents Granted |
| 2026 | – | 26 |
| 2025 | 88 | 174 |
| 2024 | 151 | 146 |
| 2023 | 137 | 162 |
| 2022 | 177 | 126 |
| 2021 | 168 | 161 |
| 2020 | 300 | 143 |
| 2019 | 235 | 119 |
| 2018 | 165 | 92 |
| 2017 | 173 | 80 |
How Many Patents did Netflix File in Different Countries?
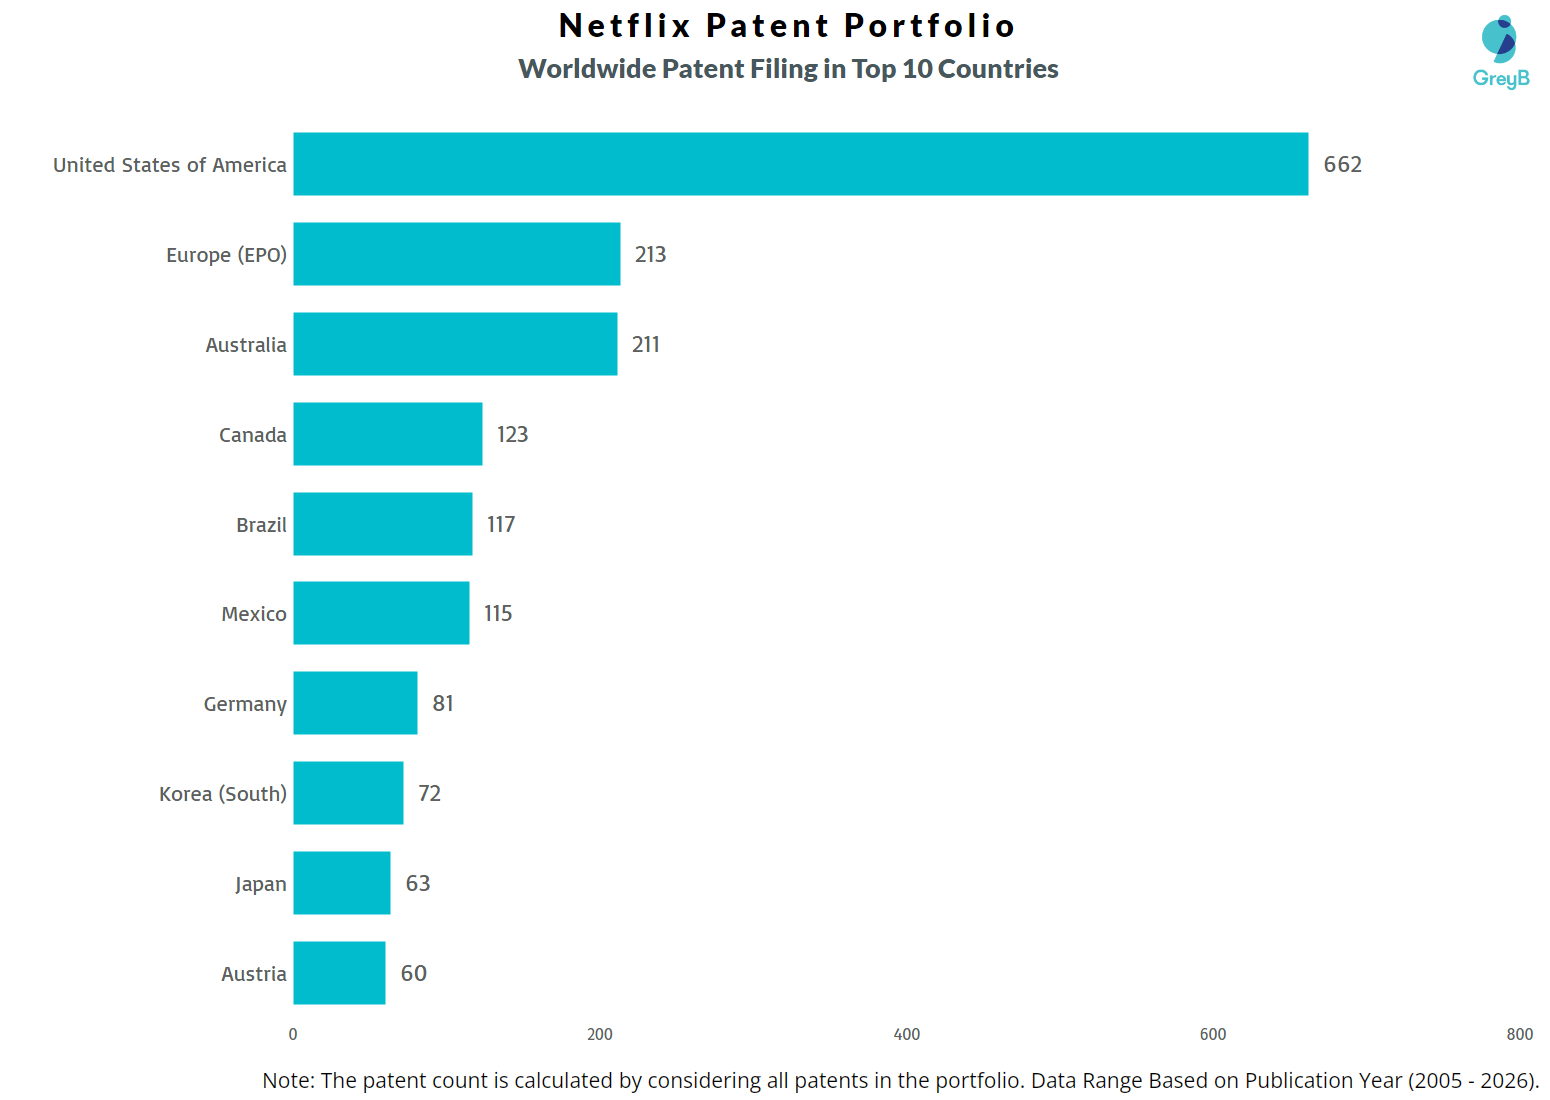
Countries in which Netflix Filed Patents
| Country | Patents |
| United States of America | 662 |
| Europe (EPO) | 213 |
| Australia | 211 |
| Canada | 123 |
| Brazil | 117 |
| Mexico | 115 |
| Germany | 81 |
| Korea (South) | 72 |
| Japan | 63 |
| Austria | 60 |
| China | 59 |
| Norway | 48 |
| Singapore | 48 |
| Denmark | 45 |
| India | 40 |
| Poland | 27 |
| United Kingdom | 10 |
| Turkey | 9 |
| Chile | 7 |
| Colombia | 7 |
| New Zealand | 1 |
| Spain | 1 |
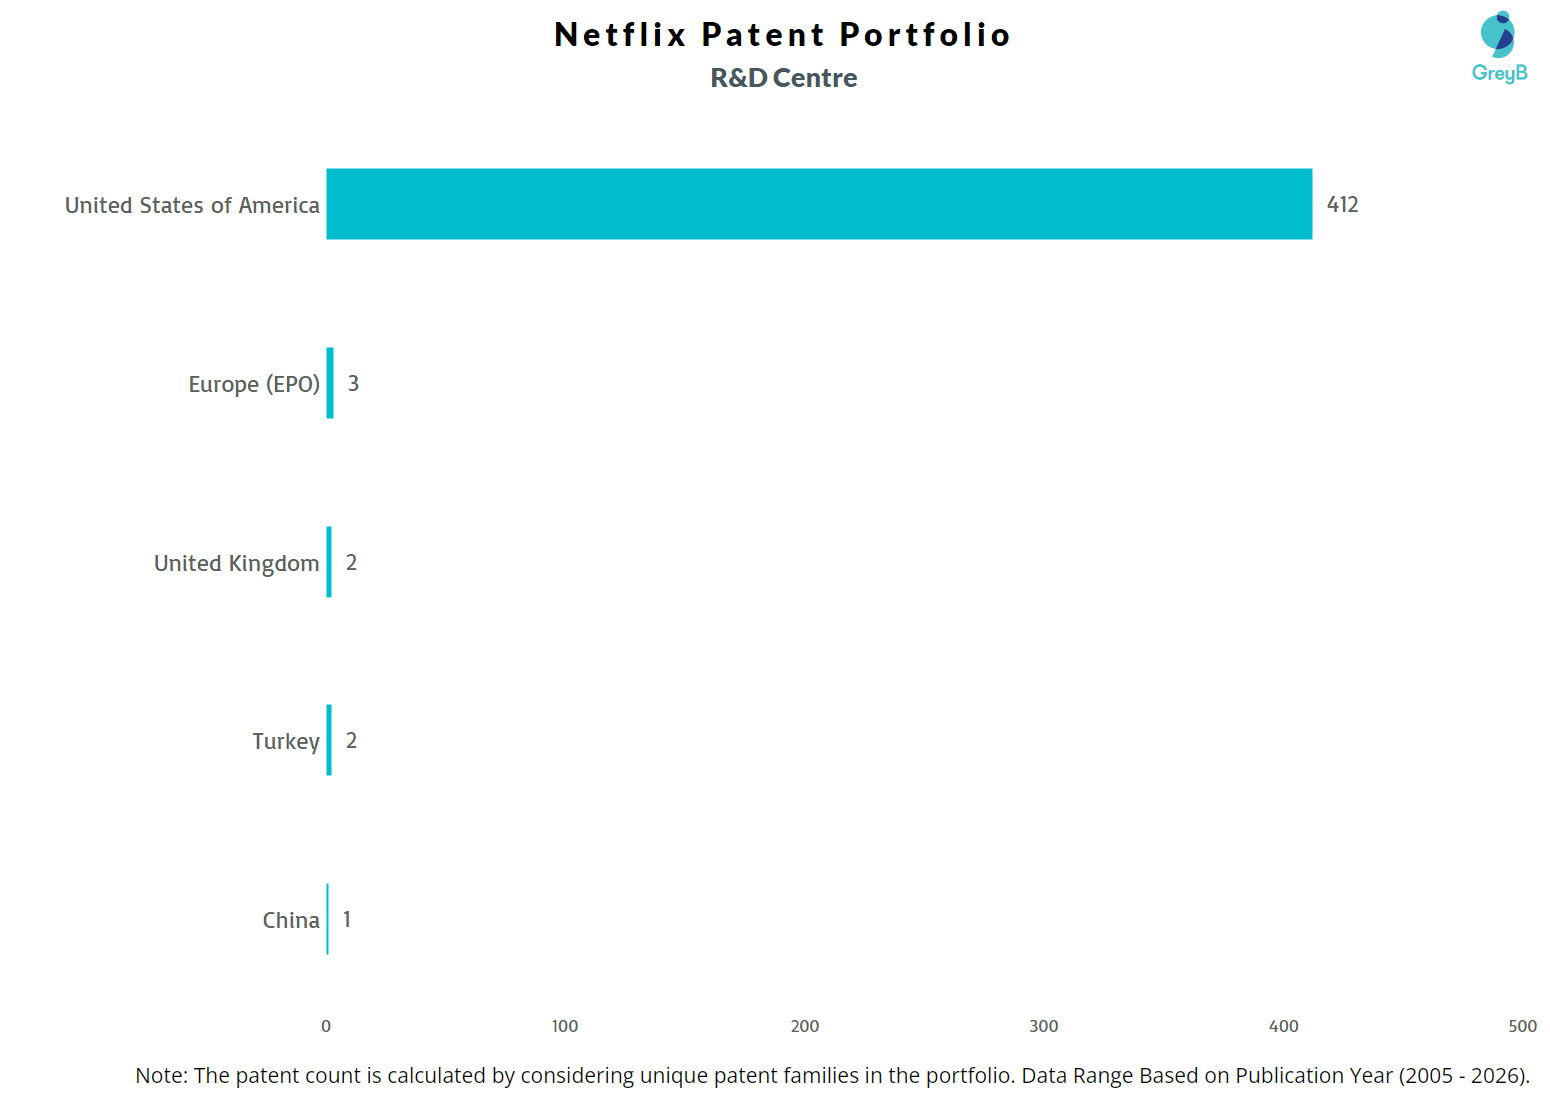
Where are Research Centres of Netflix Patents Located?
What Technologies are Covered by Netflix Patents?
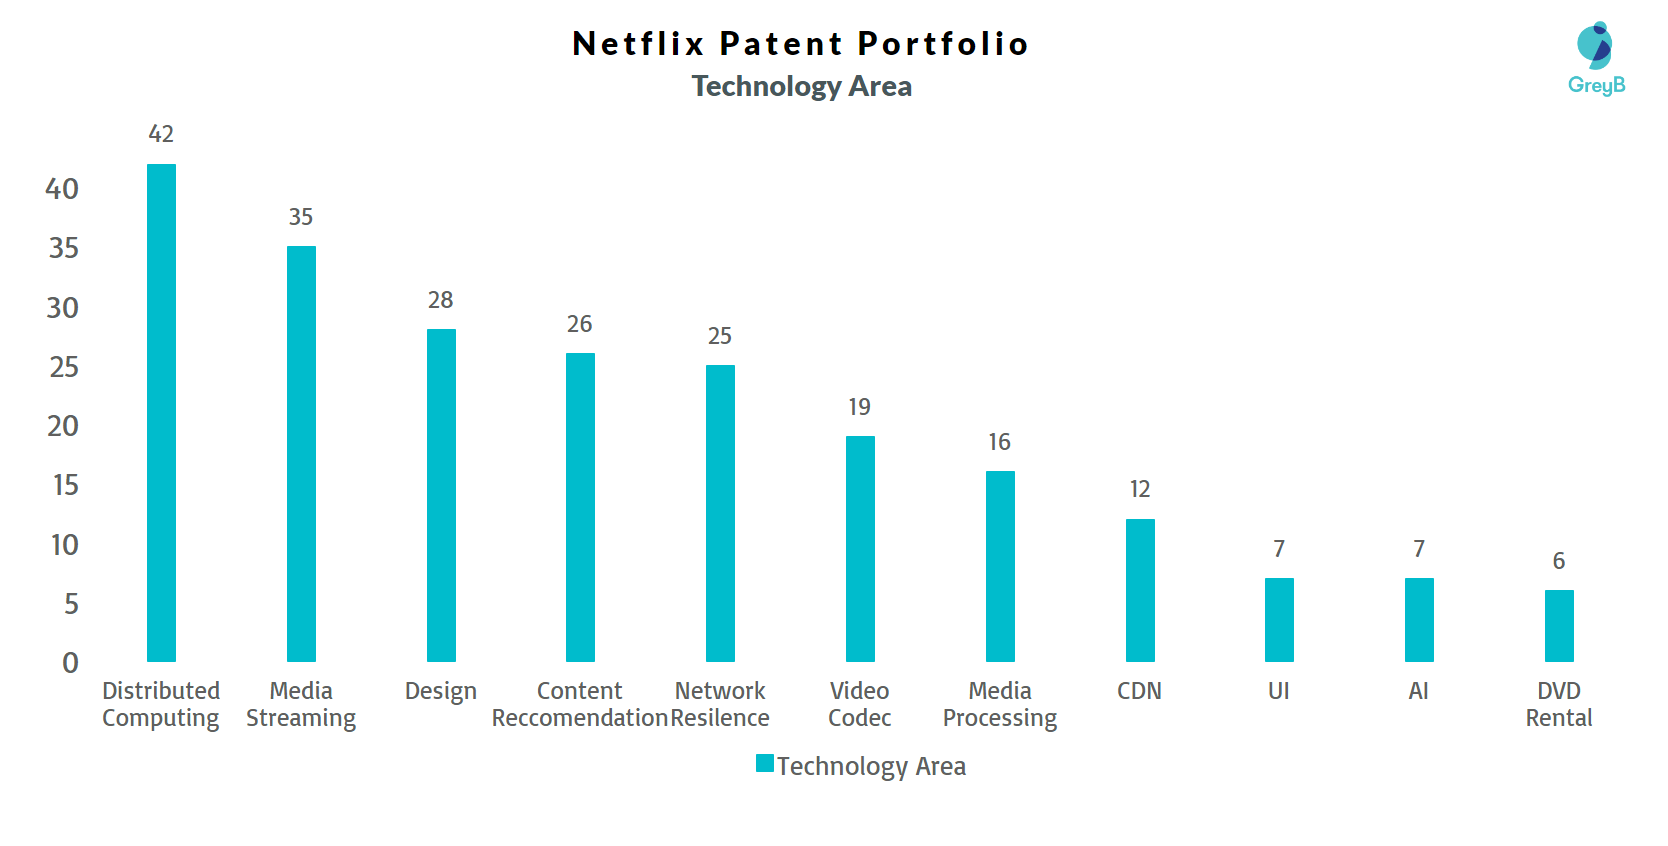
Want to know what sort of patents are in Distributed Computing or Media Streaming? We have covered that here: What is Inside Netflix’s Patents?
R&D Focus: How Netflix’s Research Focus Changed Over the Years?
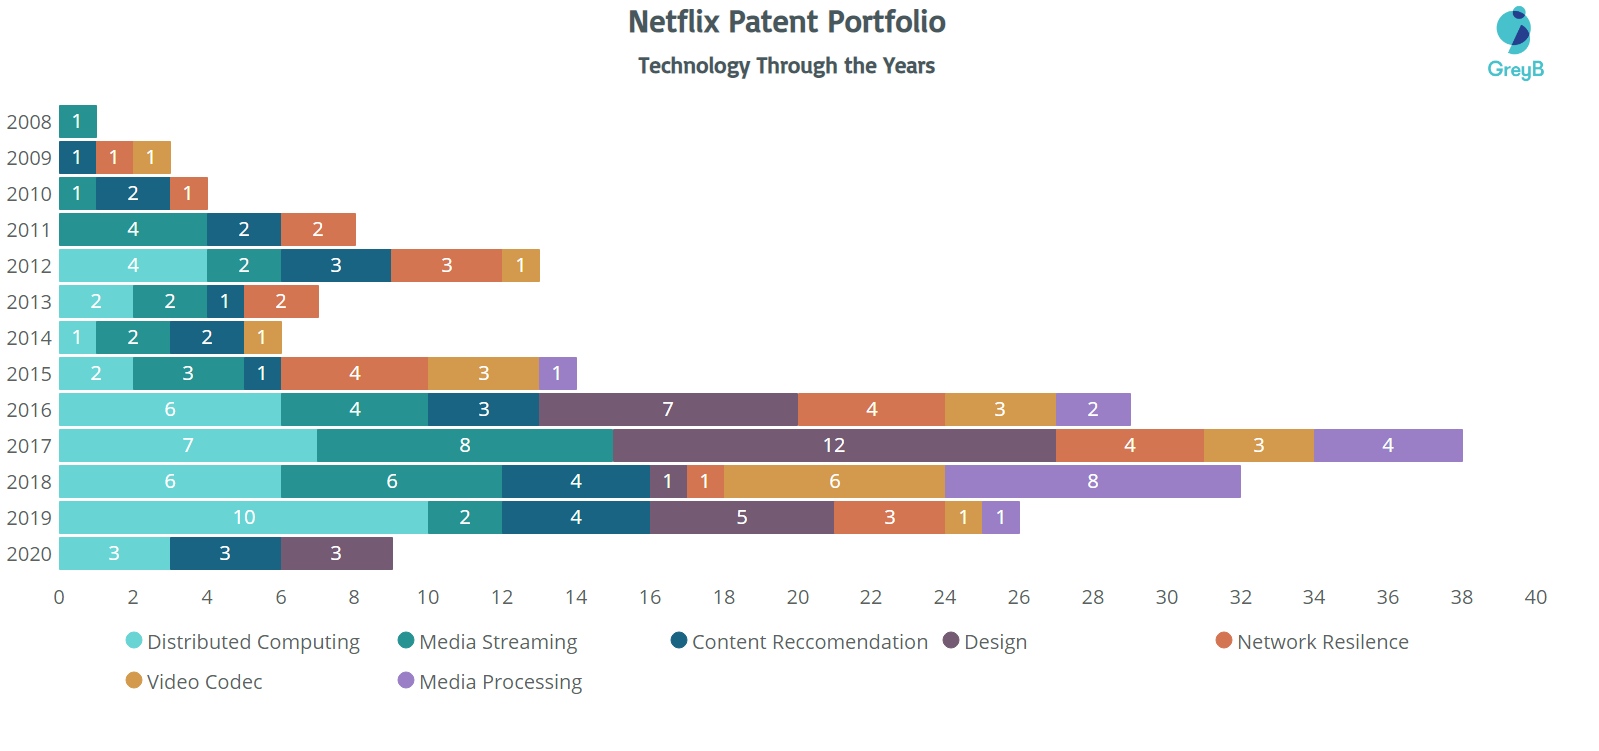
We have technical insights available for the period 2003 to 2021. To explore these insights in detail, fill out the form below to download the PDF report.
10 Best Netflix Patents
US9990499B2 is the most popular patent in the Netflix portfolio. It has received 240 citations so far from companies like Amazon, OneTrust and Walmart Apollo.
| Publication Number | Citation Count |
| US9990499B2 | 240 |
| US7403910B1 | 198 |
| US9338181B1 | 172 |
| US7024381B1 | 144 |
| US8386621B2 | 128 |
| US20150067724A1 | 120 |
| US8365235B2 | 102 |
| US20150319506A1 | 90 |
| US8963847B2 | 87 |
| US9021537B2 | 59 |
Which Companies are using Netflix’s Patents to Advance their Research?
If patents or patents from a particular technology area of a company receive a lot of citations, it implies that the technology is being followed and incrementally innovated by the citing companies. It also indicates that citing companies are working on similar and closely related technologies
The top-cited technologies in the Netflix patent portfolio are Media Streaming, Content Recommendation, and Distributed Computing. Google, IBM, and Microsoft as the top forward citing assignees.
| Company | Number of Patents |
| 53 | |
| IBM | 50 |
| Microsoft | 40 |
| Amazon | 35 |
| Samsung | 33 |
| Ericsson | 24 |
| Apple | 21 |
| At&T | 19 |
| Comcast Cable | 16 |
| Sony Interactive Entertainment | 14 |
How many inventions of other companies were rejected due to Netflix patents?
The statistics below share strategic R&D insights. It tells the companies that were trying to protect inventions similar to Netflix. They couldn’t because Netflix had them protected already.
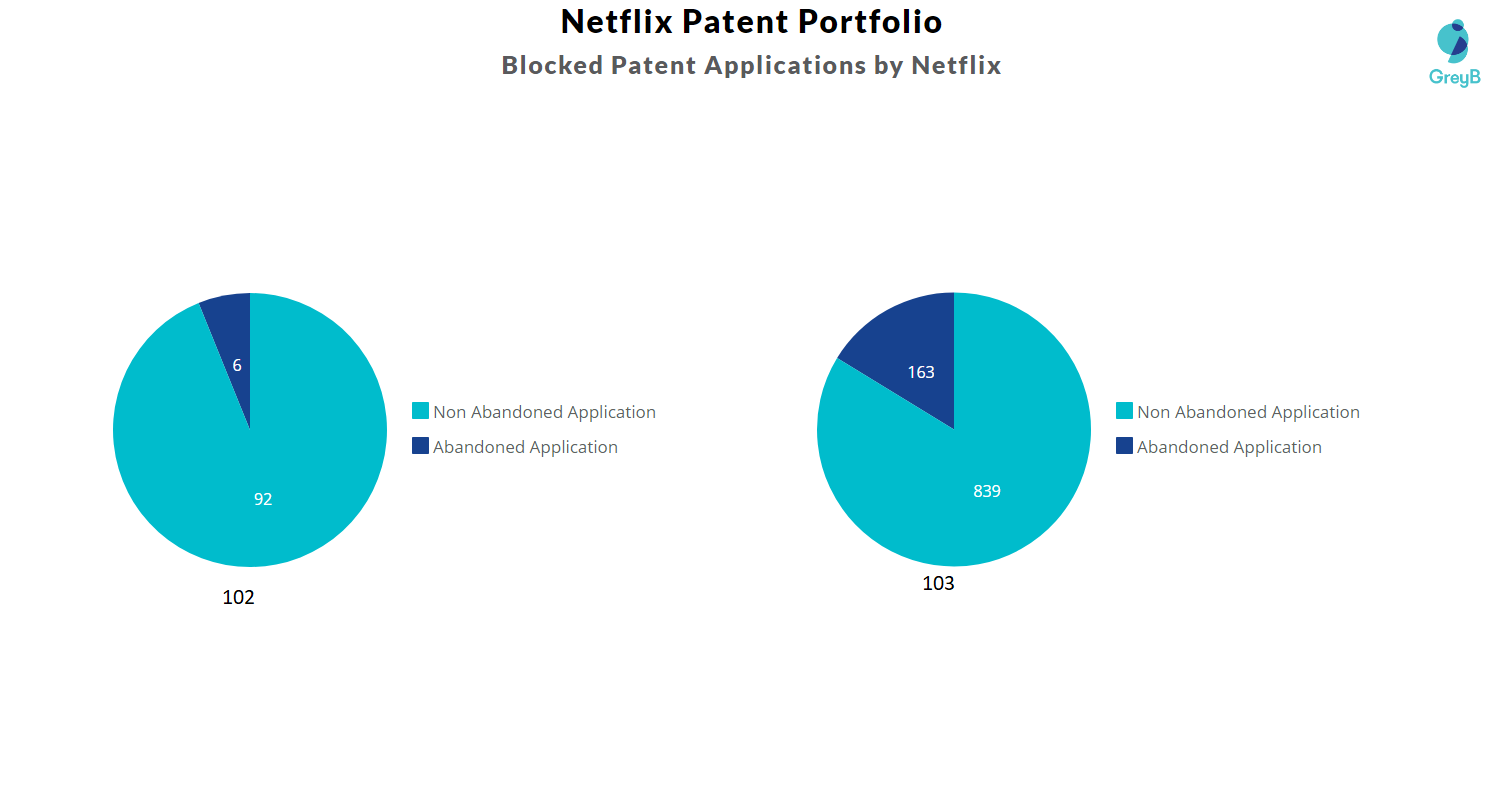
Examiners at the USPTO used 120 Netflix patents in 1100 rejections (35 USC § 102 or 35 USC § 103 types). Below is the distribution of the number of blocked patent applications vs the technology cluster of Netflix patents.
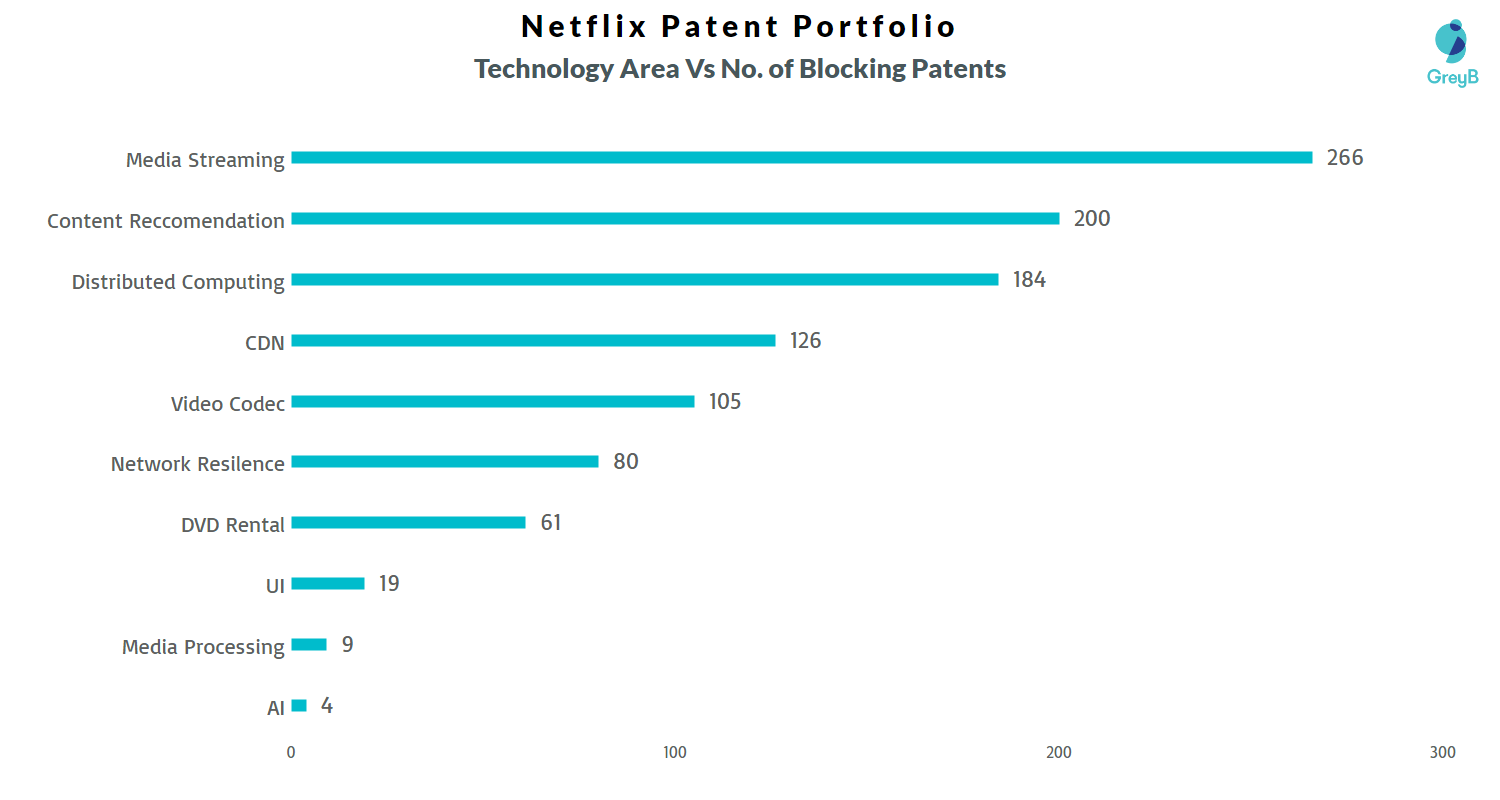
Count of 102 and 103 Type Rejections based on Netflix Patents
Which Companies’ Patent Applications were Rejected the Most?
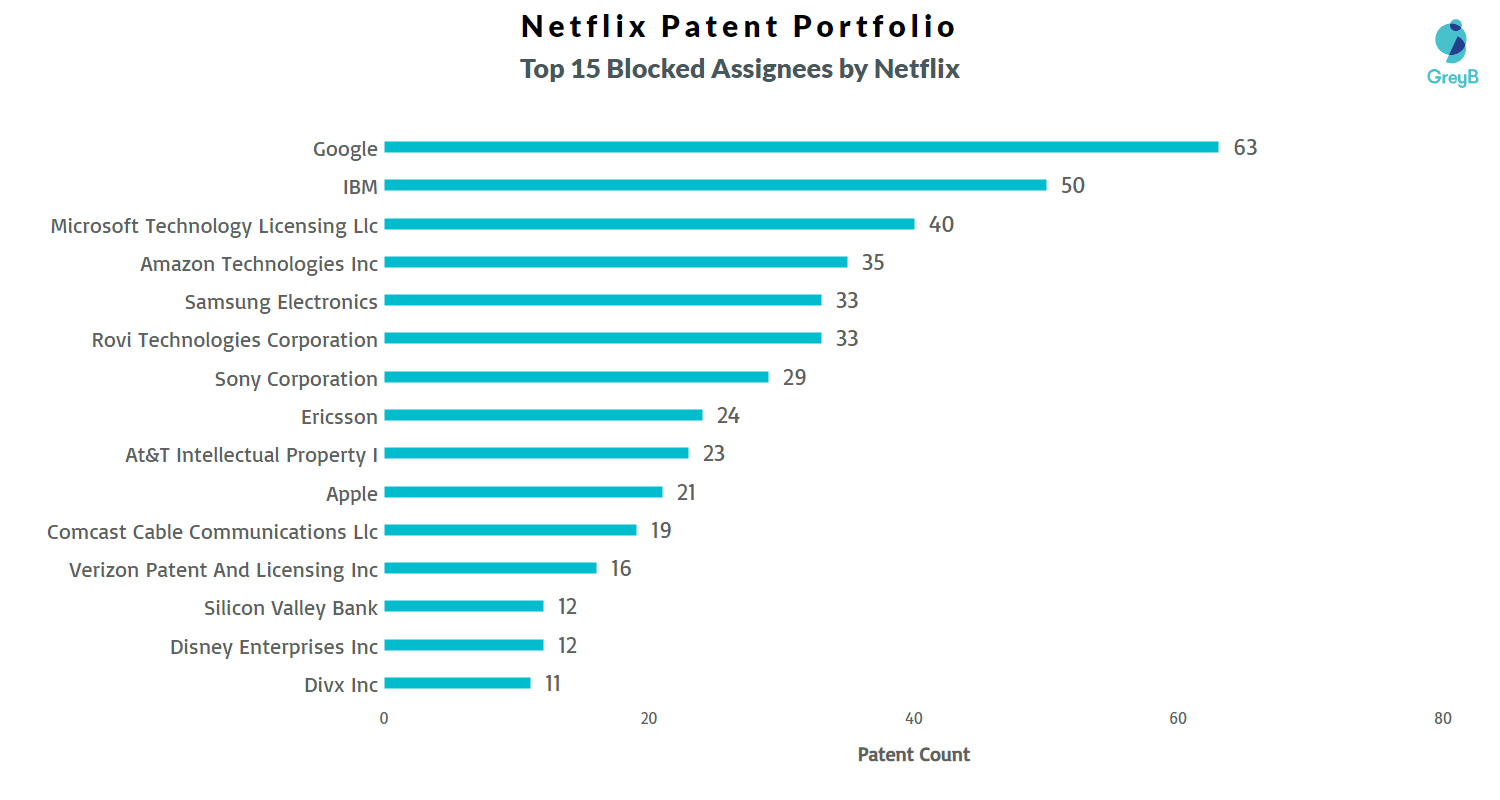
Top Netflix Patents used in Rejecting Most Patent Applications
| Patent Number | Count of Rejected Applications |
| US8954596B2 | 70 |
| US8271338B2 | 62 |
| US8365235B2 | 55 |
| US8386621B2 | 47 |
| US9613104B2 | 46 |
| US8837601B2 | 37 |
| US7631323B1 | 35 |
| US9009337B2 | 31 |
| US9225621B2 | 30 |
| US8315977B2 | 26 |
| US7403910B1 | 24 |
| US9973800B2 | 24 |
| US9699519B2 | 21 |
| US20140006474A1 | 21 |
| US7617127B2 | 20 |
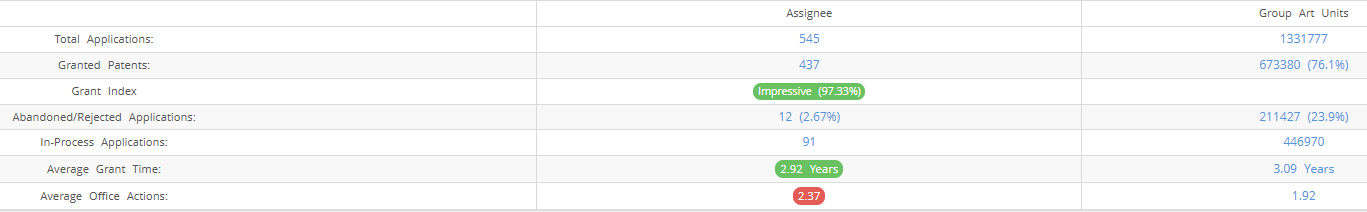
What Percentage of Netflix’s US Patent Applications were Granted?
Netflix has filed 545 patent applications at USPTO so far (Excluding Design and PCT applications). Out of these 437 have been granted leading to a grant rate of 97.33%.
Below are the key stats of Netflix’s patent prosecution at the USPTO. You can check the performance of FAANG at the USPTO here.
Which Law Firms are managing US Patents for Netflix?
| Law Firm | Total Applications | Success Rate |
| Artegis Law Group Llp | 418 | 98.88% |
| Greenberg Traurig Llp | 121 | 93.10% |
| Hickman Becker Bingham Ledesma Llp | 3 | 50.00% |
| Hickman Palermo Truong & Becker Llp | 1 | 0% |
| Netflix (Inhouse IP Dept.) | 1 | 0.00% |
| Patterson Sheridan Llp | 1 | 100.00% |
Looking for updated analysis and deeper insights? Fill out the form below to access the latest detailed report.