Fraser and Neave has a total of 157 patents globally, out of which 154 have been granted. Of these 157 patents, more than 64% patents are active. Singapore is where Fraser and Neave has filed the maximum number of patents, followed by Malaysia and Brunei. Parallelly, Singapore seems to be the main focused R&D center and also is the origin country of Fraser and Neave.
Fraser and Neave subpart of TCC Group was founded in 1883 by John Fraser and David Neave. Fraser and Neave is principally engaged in the food and beverage, and printing and publishing business. The Company’s principal activities include the production and sale of beverages, which includes soft drinks, beer, stout, and dairy products, and printing and publishing. As of June 2022, Fraser and Neave has a market cap of $1.94 Billion.
Do read about some of the most popular patents of Fraser and Neave which have been covered by us in this article and also you can find Fraser and Neave patents information, the worldwide patent filing activity and its patent filing trend over the years, and many other stats over Fraser and Neave patent portfolio.
How many patents does the Founder and CEO of Fraser and Neave have?
The Founder John Fraser and David Neave have 0 patents and the CEO Choon Kit Hui have 0 patents.
How many patents does Fraser and Neave have?
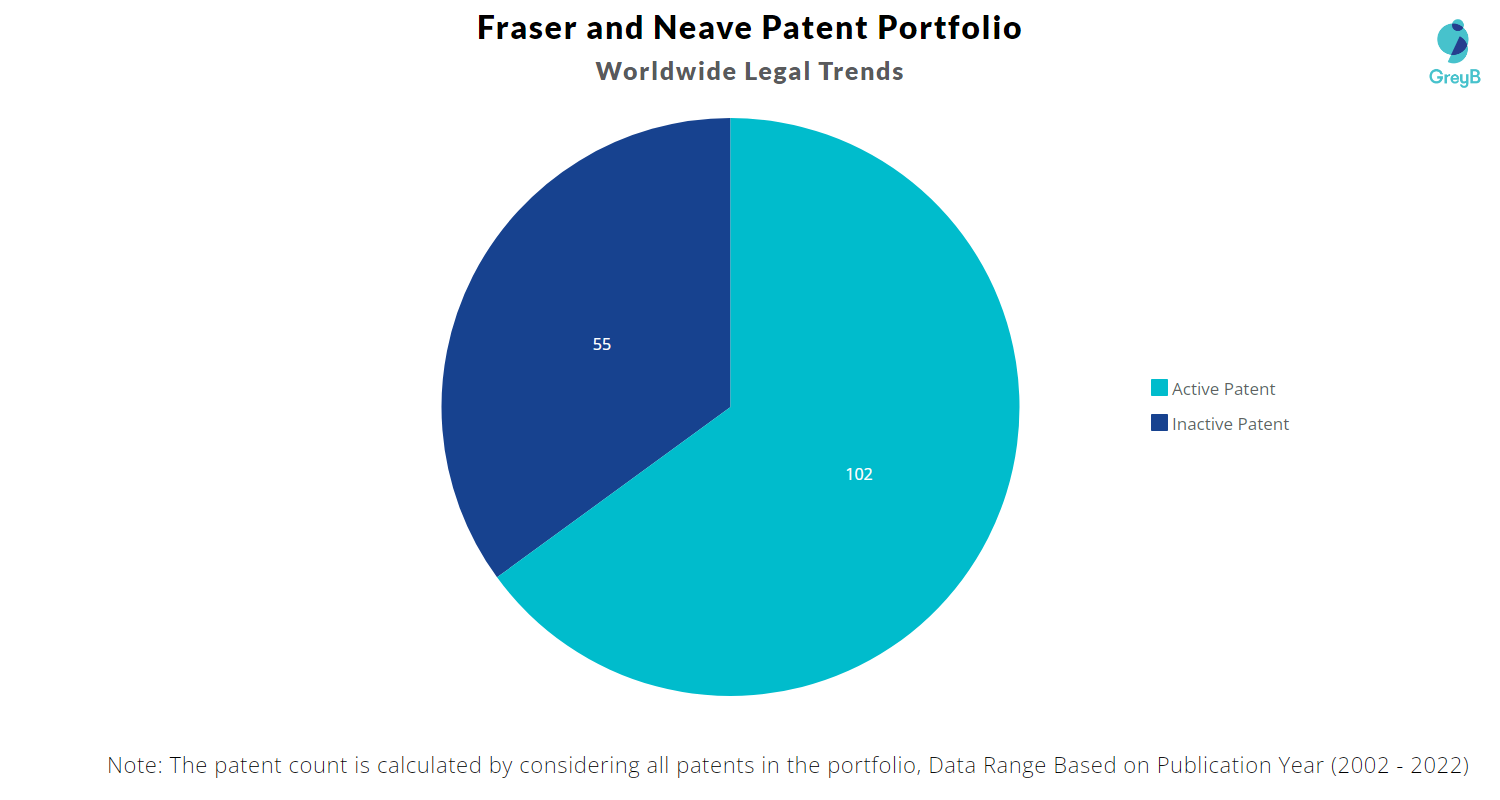
Fraser and Neave has a total of 157 patents globally. These patents belong to 110 unique patent families. Out of 157 patents, 102 patents are active.
How Many Patents did Fraser and Neave File Every Year?
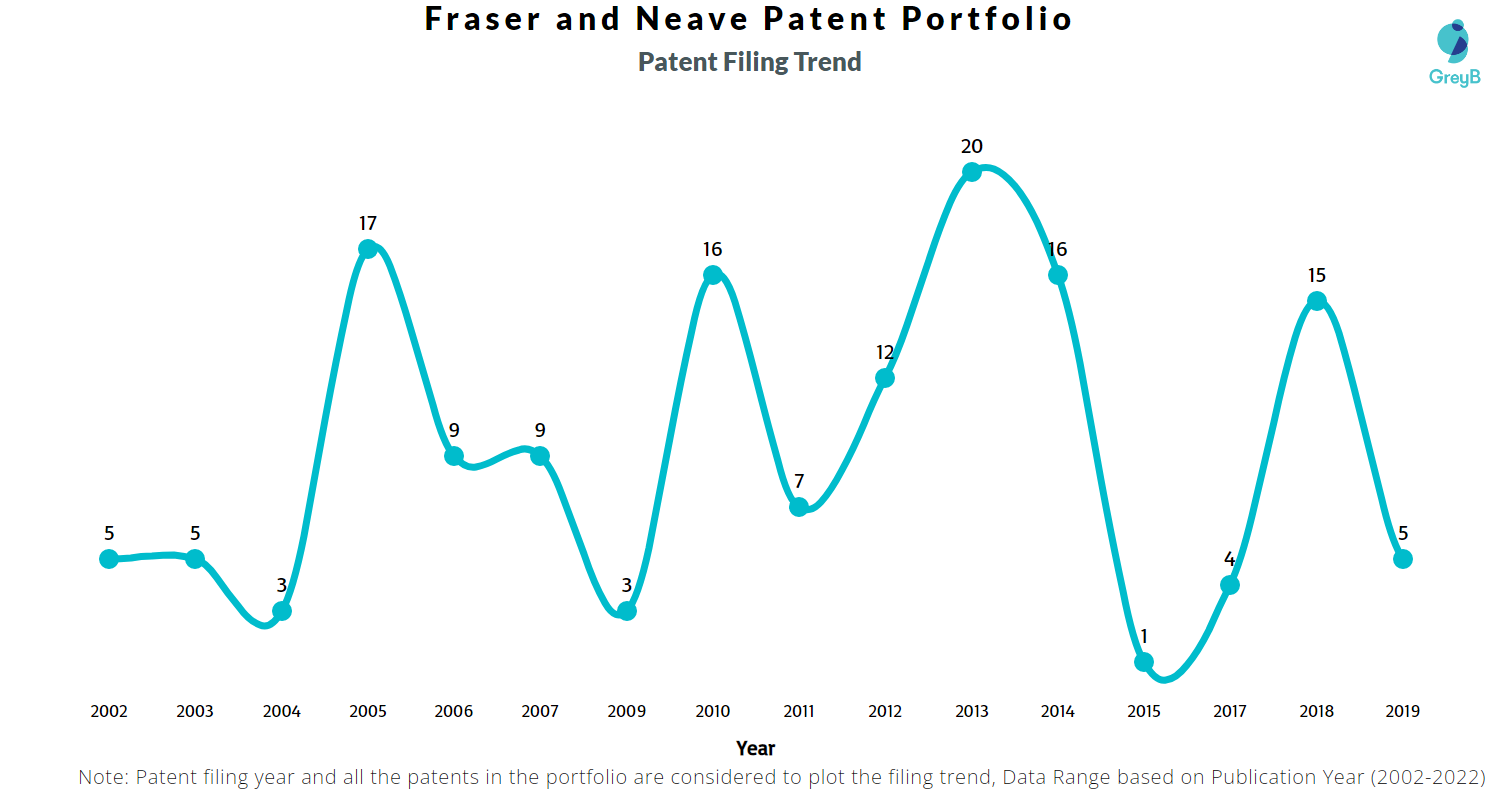
Are you wondering why there is a drop in patent filing for the last two years? It is because a patent application can take up to 18 months to get published. Certainly, it doesn’t suggest a decrease in the patent filing.
| Year of Patents Filing or Grant | Fraser and Neave Applications Filed | Fraser and Neave Patents Granted |
| 2011 | 7 | 8 |
| 2012 | 12 | 13 |
| 2013 | 20 | 10 |
| 2014 | 16 | 16 |
| 2015 | 1 | 12 |
| 2016 | – | 1 |
| 2017 | 4 | 4 |
| 2018 | 15 | 10 |
| 2019 | 5 | 8 |
| 2020 | – | 2 |
How many Fraser and Neave patents are Alive/Dead?
Worldwide Patents
How Many Patents did Fraser and Neave File in Different Countries?
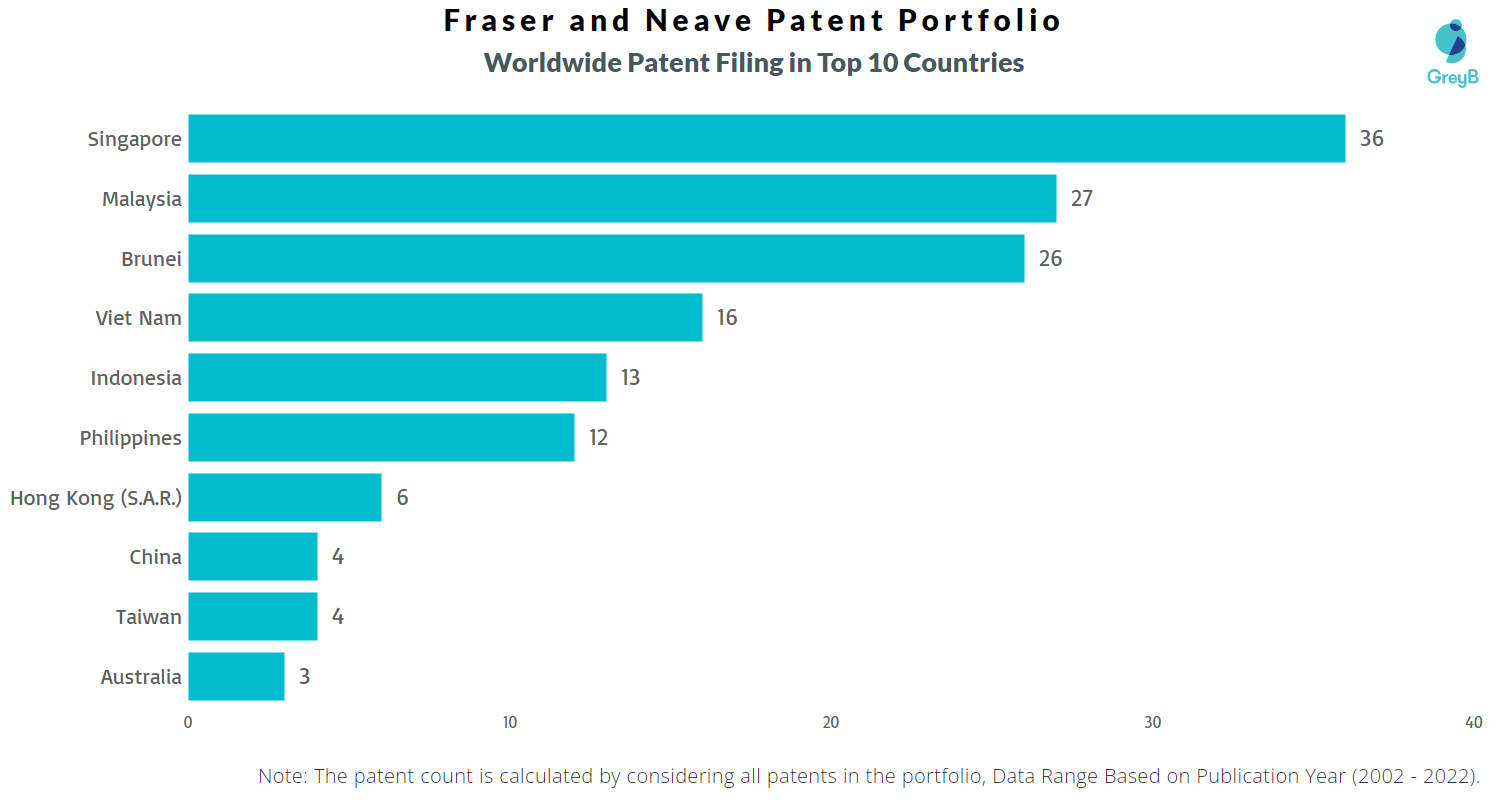
Countries in which Fraser and Neave Filed Patents
| Country | Patents |
| Singapore | 36 |
| Malaysia | 27 |
| Brunei | 26 |
| Viet Nam | 16 |
| Indonesia | 13 |
| Philippines | 12 |
| Hong Kong (S.A.R.) | 6 |
| China | 4 |
| Taiwan | 4 |
| Australia | 3 |
| Cambodia | 3 |
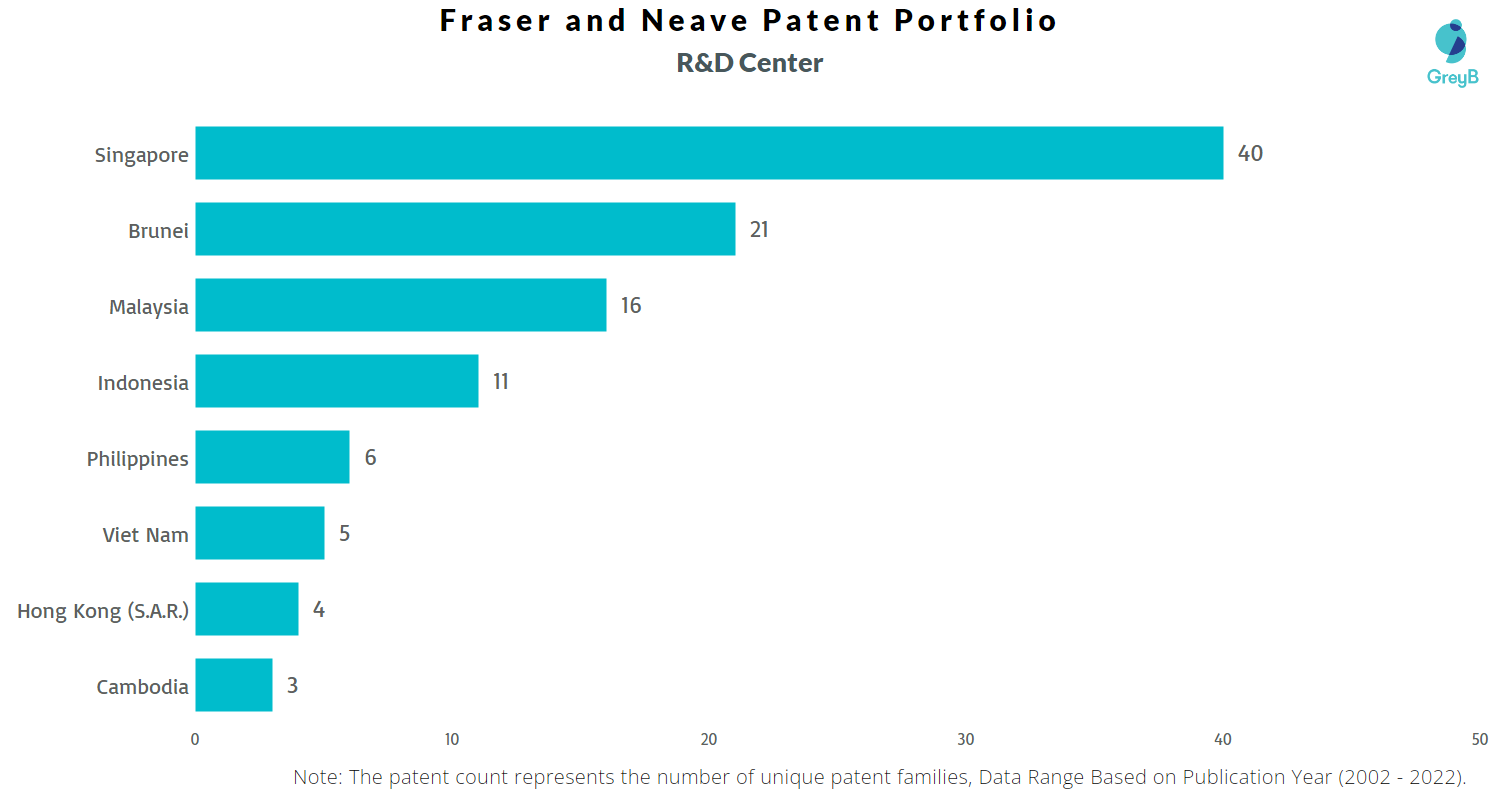
Where are Research Centers of Fraser and Neave Patents Located?
EXCLUSIVE INSIGHTS COMING SOON!