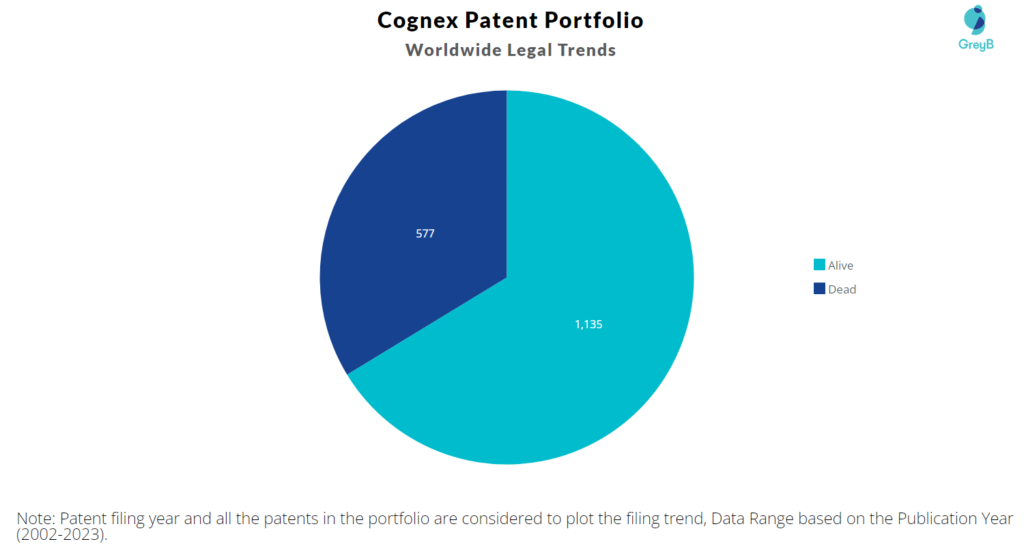
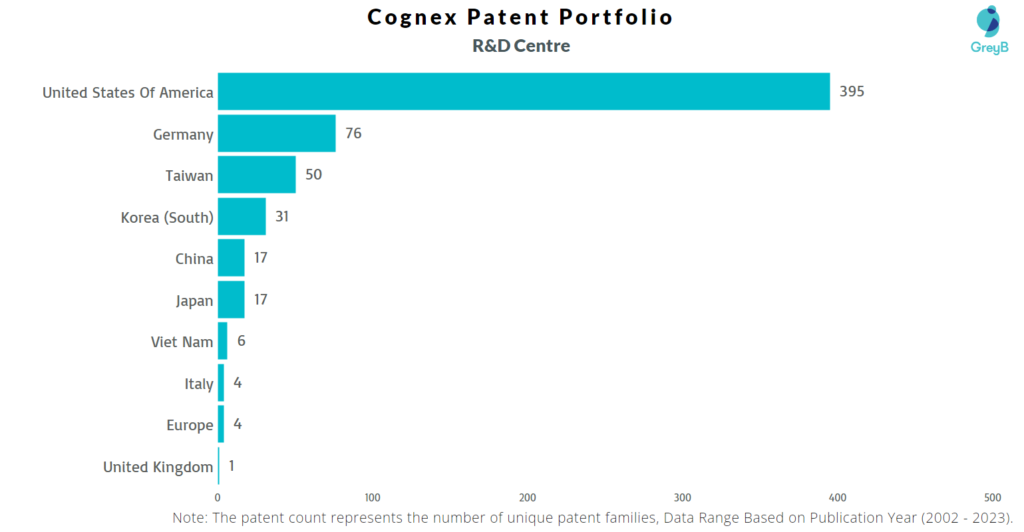
Cognex has a total of 1712 patents globally, out of which 1117 have been granted. Of these 1712 patents, more than 66% patents are active. United States of America is where Cognex has filed the maximum number of patents, followed by China and Japan. Parallelly, United States of America seems to be the main focused R&D centre and also is the origin country of Cognex.
Cognex was founded in the year 1981. The Company designs, develops, manufactures and markets machine vision systems. The Company’s systems are used to automate the manufacture of a variety of discrete items and to assure their quality.As of March 2023, the market cap of Cognex is $8.18 Billion.
Do read about some of the most popular patents of Cognex which have been covered by us in this article and also you can find Cognex patents information, the worldwide patent filing activity and its patent filing trend over the years, and many other stats over Cognex patent portfolio.
How many patents does the founder and the CEO of Cognex have?
The founders Marilyn Matz has 0 patent, Robert J. Shillman has 1 patent and William Silver has 31 patents. The CEO Robert Willett has 2 patents.
How many patents does Cognex have?
Cognex has a total of 1712 patents globally. These patents belong to 610 unique patent families. Out of 1712 patents, 1135 patents are active.
How Many Patents did Cognex File Every Year?
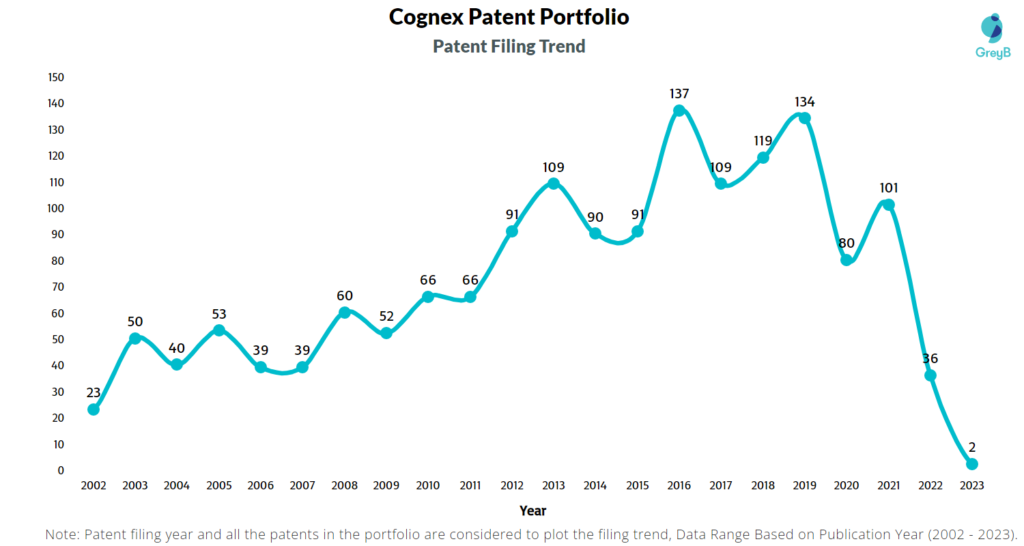
Are you wondering why there is a drop in patent filing for the last two years? It is because a patent application can take up to 18 months to get published. Certainly, it doesn’t suggest a decrease in the patent filing.
| Year of Patents Filing or Grant | Cognex Applications Filed | Cognex Patents Granted |
| 2023 | 2 | 29 |
| 2022 | 36 | 84 |
| 2021 | 101 | 127 |
| 2020 | 80 | 105 |
| 2019 | 134 | 88 |
| 2018 | 119 | 78 |
| 2017 | 109 | 64 |
| 2016 | 137 | 85 |
| 2015 | 91 | 61 |
| 2014 | 90 | 51 |
| 2013 | 109 | 45 |
| 2012 | 91 | 57 |
How many Cognex patents are Alive/Dead?
How Many Patents did Cognex File in Different Countries?
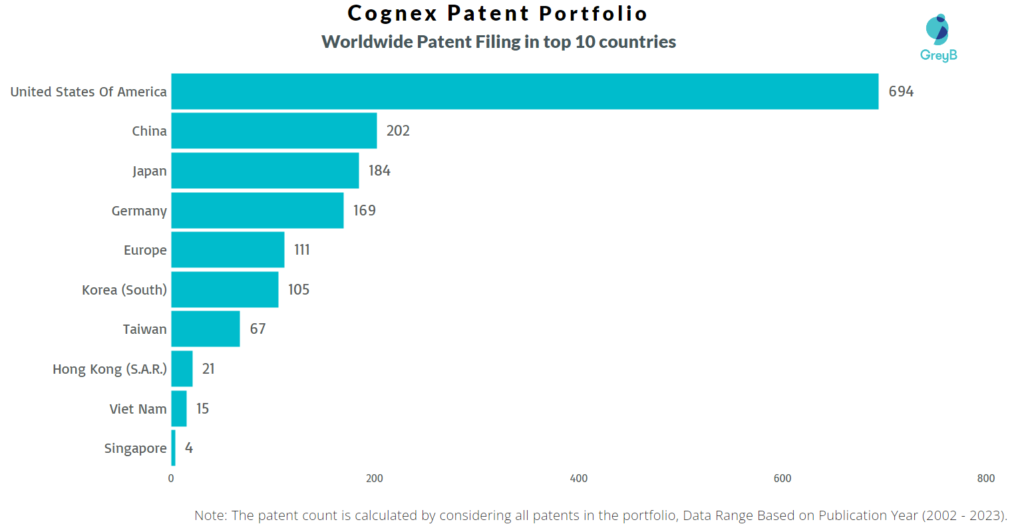
Countries in which Cognex Filed Patents
| Country | Patents |
| United States Of America | 694 |
| China | 202 |
| Japan | 184 |
| Germany | 169 |
| Europe | 111 |
| Korea (South) | 105 |
| Taiwan | 67 |
| Hong Kong (S.A.R.) | 21 |
| Viet Nam | 15 |
| Singapore | 4 |
| Italy | 4 |
| Australia | 4 |
| India | 3 |
| Austria | 2 |
| United Kingdom | 2 |
| Spain | 2 |
| Canada | 1 |
Where are Research Centres of Cognex Patents Located?
10 Best Cognex Patents
US6681151B1 is the most popular patent in the Cognex portfolio. It has received 325 citations so far from companies like Fanuc, Cyberoptics Corporation and Irobot Corporation.
Below is the list of 10 most cited patents of Cognex:
| Publication Number | Citation Count |
| US6681151B1 | 325 |
| US6819779B1 | 221 |
| US6408109B1 | 220 |
| US6362875B1 | 167 |
| US6728582B1 | 160 |
| US7305114B2 | 154 |
| US6678394B1 | 138 |
| US7016539B1 | 131 |
| US6658145B1 | 131 |
| US20110157373A1 | 131 |
How many inventions of other companies were rejected due to Cognex patents?
The statistics below share strategic R&D insights. It tells the companies that were trying to protect inventions similar to Cognex invention. They couldn’t because Cognex had protected those before them.
Examiners at the USPTO referred 257 Cognex patents in 1305 rejections (35 USC § 102 or 35 USC § 103 types).
The top citing companies in the Cognex patent portfolio are Samsung, Hand Held Products and Canon.
List of the Companies whose Patents were rejected citing Cognex –
| Company | Number of Patent Applications that faced Rejection Citing Cognex Patents | Number of Rejections (102 & 103) |
| Samsung | 22 | 44 |
| Hand Held Products | 18 | 40 |
| Canon | 16 | 29 |
| Datalogic Ip Tech | 12 | 29 |
| Boeing | 11 | 27 |
| Microsoft | 11 | 28 |
| Sony | 10 | 29 |
| Omron | 9 | 23 |
| Epson | 9 | 15 |
| The Code Corporation | 9 | 16 |
Count of 102 and 103 Type Rejections based on Cognex Patents
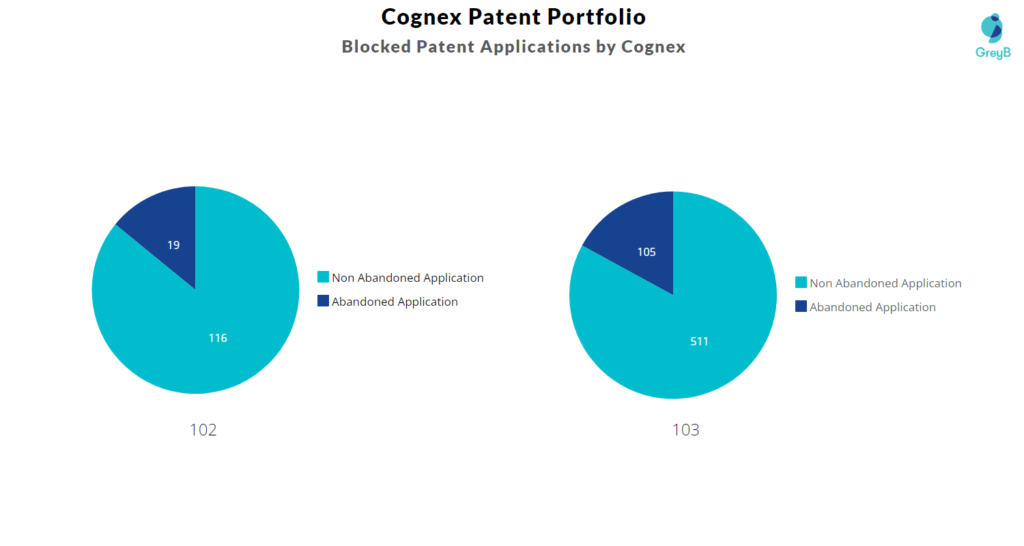
Top Cognex Patents used in Rejecting Most Patent Applications
| Patent Number | Count of Rejected Applications |
| US8531650B2 | 37 |
| US8233670B2 | 25 |
| US8442304B2 | 16 |
| US8199975B2 | 16 |
| US6681151B1 | 15 |
| US9393694B2 | 12 |
| US20050249382A1 | 11 |
| US20110157373A1 | 10 |
| US7874487B2 | 10 |
| US6819779B1 | 9 |
| US9286530B2 | 9 |
| US7623674B2 | 8 |
| US10154177B2 | 7 |
| US7167575B1 | 7 |
| US9189670B2 | 7 |
What Percentage of Cognex US Patent Applications were Granted?
Cognex (Excluding its subsidiaries) has filed 638 patent applications at USPTO so far (Excluding Design and PCT applications). Out of these 542 have been granted leading to a grant rate of 93.29%.
Below are the key stats of Cognex patent prosecution at the USPTO.

Which Law Firms Filed Most US Patents for Cognex?
| Law Firm | Total Applications | Success Rate |
| Cognex Corporation | 602 | 93.61% |
| Fish & Richardson | 11 | 90.00% |
| Ratnerprestia | 8 | 100.00% |
| Ip Practice Group | 2 | 100.00% |
| Island Patent | 2 | 100.00% |
| Smith Gambrell & Russell | 2 | 100.00% |
| Cypher Law Offices | 1 | 100.00% |
| F Scott Tierno | 1 | 100.00% |
| Fish & Richardson | 1 | 100.00% |
| Holland & Knight | 1 | 100.00% |
