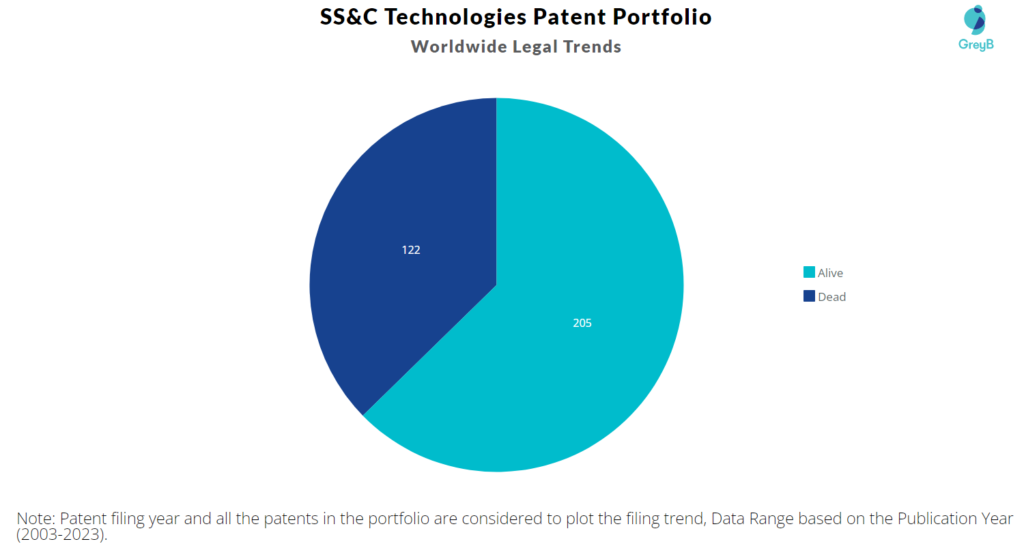
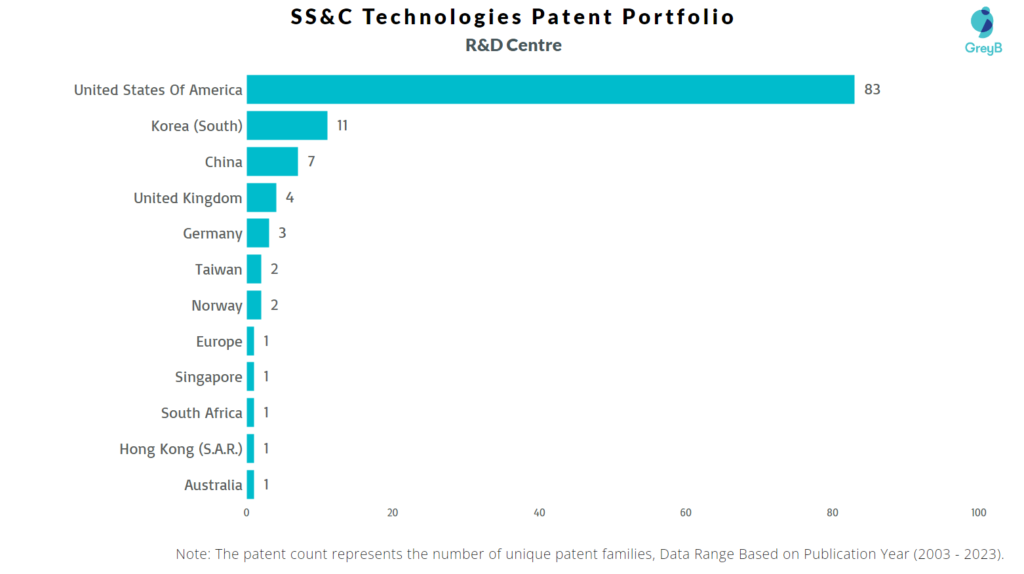
SS&C Technologies has a total of 327 patents globally, out of which 162 have been granted. Of these 327 patents, more than 62% patents are active. United States of America is where SS&C Technologies has filed the maximum number of patents, followed by Europe and Australia. Parallelly, United States of America seems to be the main focused R&D centre and also is the origin country of SS&C Technologies.
SS&C Technologies was founded in the year 1986. The Company develops financial software solutions. The Company provides fund administration, consulting, managed and professional services, as well as offers technology and operations outsourcing. As of June 2023, the market cap of SS&C Technologies is $14.13 Billion.
Do read about some of the most popular patents of SS&C Technologies which have been covered by us in this article and also you can find SS&C Technologies patents information, the worldwide patent filing activity and its patent filing trend over the years, and many other stats over SS&C Technologies patent portfolio.
How many patents does the founder and the CEO of SS&C Technologies have?
The founder Bill Stone has 0 patent and CEO William C. Stone has 58 patents.
How many patents does SS&C Technologies have?
SS&C Technologies has a total of 327 patents globally. These patents belong to 119 unique patent families. Out of 327 patents, 205 patents are active.
How Many Patents did SS&C Technologies File Every Year?
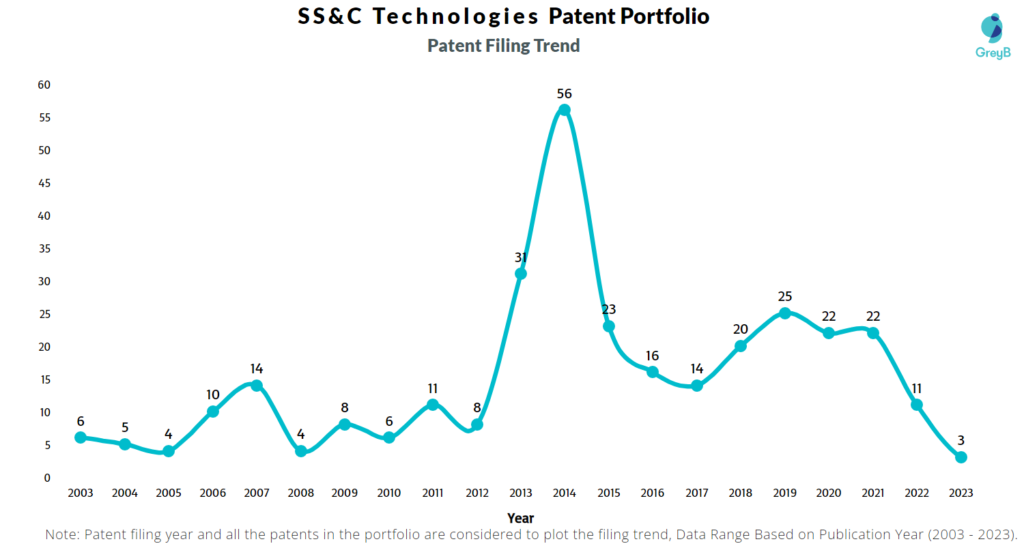
Are you wondering why there is a drop in patent filing for the last two years? It is because a patent application can take up to 18 months to get published. Certainly, it doesn’t suggest a decrease in the patent filing.
| Year of Patents Filing or Grant | SS&C Technologies Applications Filed | SS&C Technologies Patents Granted |
| 2023 | 3 | 8 |
| 2022 | 11 | 10 |
| 2021 | 22 | 12 |
| 2020 | 22 | 16 |
| 2019 | 25 | 17 |
| 2018 | 20 | 20 |
| 2017 | 14 | 11 |
| 2016 | 16 | 15 |
| 2015 | 23 | 13 |
| 2014 | 56 | 10 |
| 2013 | 31 | 4 |
| 2012 | 8 | 4 |
How many SS&C Technologies patents are Alive/Dead?
How Many Patents did SS&C Technologies File in Different Countries?
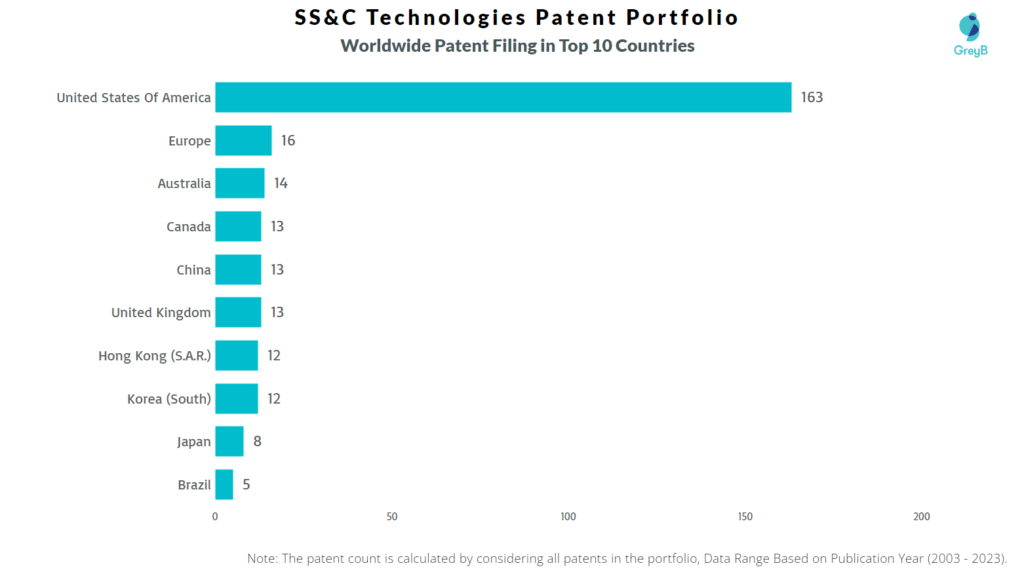
Countries in which SS&C Technologies Filed Patents
| Country | Patents |
| United States Of America | 163 |
| Europe | 16 |
| Australia | 14 |
| Canada | 13 |
| China | 13 |
| United Kingdom | 13 |
| Hong Kong (S.A.R.) | 12 |
| Korea (South) | 12 |
| Japan | 8 |
| Brazil | 5 |
| South Africa | 5 |
| India | 5 |
| Taiwan | 4 |
| Singapore | 3 |
| Germany | 3 |
| Spain | 2 |
| Norway | 2 |
| New Zealand | 2 |
| Denmark | 1 |
| Chile | 1 |
| Mexico | 1 |
| Poland | 1 |
Where are Research Centres of SS&C Technologies Patents Located?
10 Best SS&C Technologies Patents
US20150163206A1 is the most popular patent in the SS&C Technologies portfolio. It has received 442 citations so far from companies like Yahoo, IBM and Intralinks.
Below is the list of 10 most cited patents of SS&C Technologies:
| Publication Number | Citation Count |
| US20150163206A1 | 442 |
| US9762553B2 | 283 |
| US6678698B2 | 205 |
| US20030225663A1 | 205 |
| US20140304836A1 | 130 |
| US20030225662A1 | 129 |
| US20120296716A1 | 127 |
| US7644088B2 | 112 |
| US9613190B2 | 106 |
| US7200563B1 | 97 |
How many inventions of other companies were rejected due to SS&C Technologies patents?
The statistics below share strategic R&D insights. It tells the companies that were trying to protect inventions similar to SS&C Technologies invention. They couldn’t because SS&C Technologies had protected those before them.
Examiners at the USPTO referred 78 SS&C Technologies patents in 778 rejections (35 USC § 102 or 35 USC § 103 types).
The top citing companies in the SS&C Technologies patent portfolio are Microsoft, IBM and Silicon Valley.
List of the Companies whose Patents were rejected citing SS&C Technologies –
| Company | Number of Patent Applications that faced Rejection Citing SS&C Technologies Patents | Number of Rejections (102 & 103) |
| Microsoft | 25 | 61 |
| IBM | 19 | 35 |
| Silicon Valley | 10 | 15 |
| Chase Bank | 10 | 27 |
| Bank Of America | 9 | 21 |
| Dell Products | 8 | 16 |
| Amazon | 8 | 9 |
| Chicago Mercantile Exchange | 6 | 13 |
| Fujifilm Business Innovation | 5 | 7 |
| Emc Ip Holding | 5 | 16 |
Count of 102 and 103 Type Rejections based on SS&C Technologies Patents
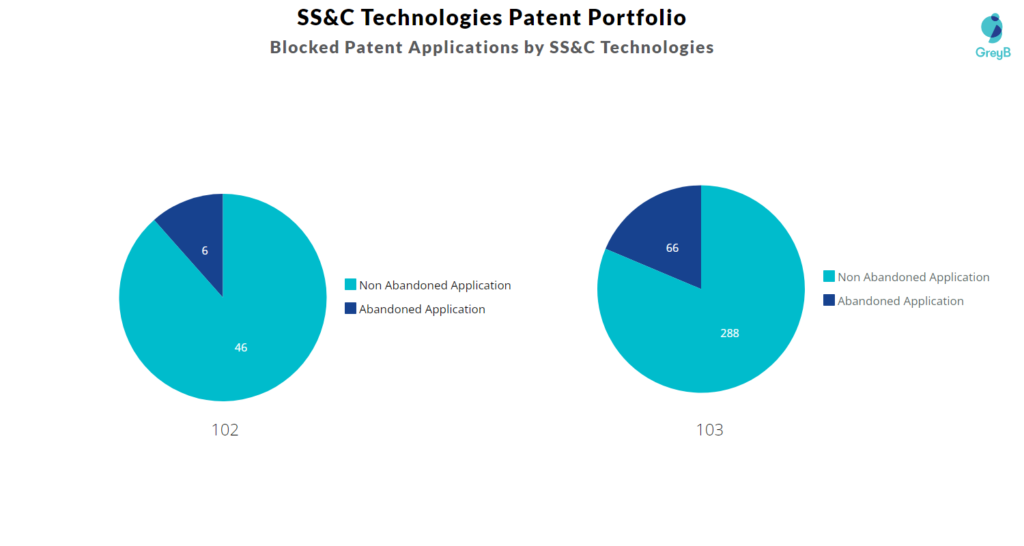
Top SS&C Technologies Patents used in Rejecting Most Patent Applications
| Patent Number | Count of Rejected Applications |
| US10033702B2 | 57 |
| US9613190B2 | 47 |
| US20150163206A1 | 28 |
| US9514327B2 | 14 |
| US8600173B2 | 13 |
| US6678698B2 | 13 |
| US8725711B2 | 12 |
| US9253176B2 | 10 |
| US7752123B2 | 9 |
| US9762553B2 | 8 |
| US20070038641A1 | 7 |
| US7925561B2 | 7 |
| US8832853B2 | 7 |
| US7634520B1 | 6 |
| US20050108024A1 | 6 |
What Percentage of SS&C Technologies US Patent Applications were Granted?
SS&C Technologies (Excluding its subsidiaries) has filed 13 patent applications at USPTO so far (Excluding Design and PCT applications). Out of these 11 have been granted leading to a grant rate of 84.62%.
Below are the key stats of SS&C Technologies patent prosecution at the USPTO.

Which Law Firms Filed Most US Patents for SS&C Technologies?
| Law Firm | Total Applications | Success Rate |
| Edell Shapiro & Finnan | 5 | 100.00% |
| Akerman | 2 | 50.00% |
| IBM Corporation | 2 | 100.00% |
| Wilmerhale Boston | 2 | 100.00% |
| Ibm Corporation Patent Center | 1 | 100.00% |
| Morgan Lewis & Bockius | 1 | 0.00% |
What are SS&C Technologies‘s key innovation segments?
What Technologies are Covered by SS&C Technologies?
The chart below distributes patents filed by SS&C Technologies
