AGCO has a total of 6068 patents globally, out of which 2360 have been granted. Of these 6068 patents, more than 55% patents are active. United States of America is where AGCO has filed the maximum number of patents, followed by Europe (EPO) and United Kingdom. Parallelly, United States of America seems to be the main focused R&D centre and also is the origin country of AGCO.
AGCO was founded in the year 1990. The company manufactures and distributes agricultural equipment. The Company sells a wide range of agricultural equipment and related replacement parts, including tractors, combines, hay tools, sprayers, and forage equipment.
Do read about some of the most popular patents of AGCO which have been covered by us in this article and also you can find AGCO patents information, the worldwide patent filing activity and its patent filing trend over the years, and many other stats over AGCO patent portfolio.
How many patents does AGCO have?
AGCO has a total of 6068 patents globally. These patents belong to 3119 unique patent families. Out of 6068 patents, 3380 patents are active.
How Many Patents did AGCO File Every Year?

Are you wondering why there is a drop in patent filing for the last two years? It is because a patent application can take up to 18 months to get published. Certainly, it doesn’t suggest a decrease in the patent filing.
| Year of Patents Filing or Grant | AGCO Applications Filed | AGCO Patents Granted |
| 2025 | 6 | 64 |
| 2024 | 353 | 162 |
| 2023 | 390 | 171 |
| 2022 | 471 | 110 |
| 2021 | 417 | 182 |
| 2020 | 450 | 213 |
| 2019 | 274 | 159 |
| 2018 | 354 | 184 |
| 2017 | 308 | 133 |
| 2016 | 304 | 131 |
| 2015 | 233 | 131 |
| 2014 | 240 | 115 |
How many AGCO patents are Alive/Dead?
Worldwide Patents

How Many Patents did AGCO File in Different Countries?

Countries in which AGCO Filed Patents
| Country | Patents |
| United States of America | 1647 |
| Europe (EPO) | 1136 |
| United Kingdom | 947 |
| Brazil | 481 |
| Canada | 207 |
| Germany | 133 |
| China | 105 |
| Australia | 68 |
| Poland | 65 |
| Ireland | 62 |
| Austria | 42 |
| Russia | 34 |
| Argentina | 26 |
| South Africa | 21 |
| Denmark | 19 |
| Malaysia | 17 |
| Netherlands | 17 |
| Ukraine | 12 |
| Slovenia | 11 |
| Spain | 10 |
| India | 8 |
| Japan | 7 |
| Hungary | 6 |
| Turkey | 6 |
| Korea (South) | 6 |
| Hong Kong (S.A.R.) | 3 |
| Czech Republic | 3 |
| Lithuania | 3 |
| Romania | 2 |
| Indonesia | 2 |
| France | 2 |
| Finland | 2 |
| New Zealand | 2 |
| Mexico | 1 |
| Philippines | 1 |
| Italy | 1 |
| Thailand | 1 |
| Taiwan | 1 |
What Percentage of AGCO US Patent Applications were Granted?
AGCO (Excluding its subsidiaries) has filed 1186 patent applications at USPTO so far (Excluding Design and PCT applications). Out of these 853 have been granted leading to a grant rate of 79.42%.
Below are the key stats of AGCO patent prosecution at the USPTO.

Which Law Firms are managing US Patents for AGCO?
| Law Firm | Total Applications | Success Rate |
| AGCO Corporation (Inhouse IP Dept.) | 615 | 83.27% |
| Hovey Williams Llp | 175 | 95.23% |
| Charles L Schwab | 47 | 100.00% |
| Arthur L Nelson | 33 | 100.00% |
| Troutman Pepper Hamilton Sanders Llp | 30 | 66.67% |
| Merchant & Gould | 28 | 25.00% |
| Kinney & Lange PA | 28 | 98.08% |
| Schmidt Johnson Hovey & Williams | 22 | 100.00% |
| Macmillan Sobanski & Todd | 13 | 95.84% |
| Robert L Farris | 13 | 100.00% |
What are AGCO key innovation segments?
What Technologies are Covered by AGCO?
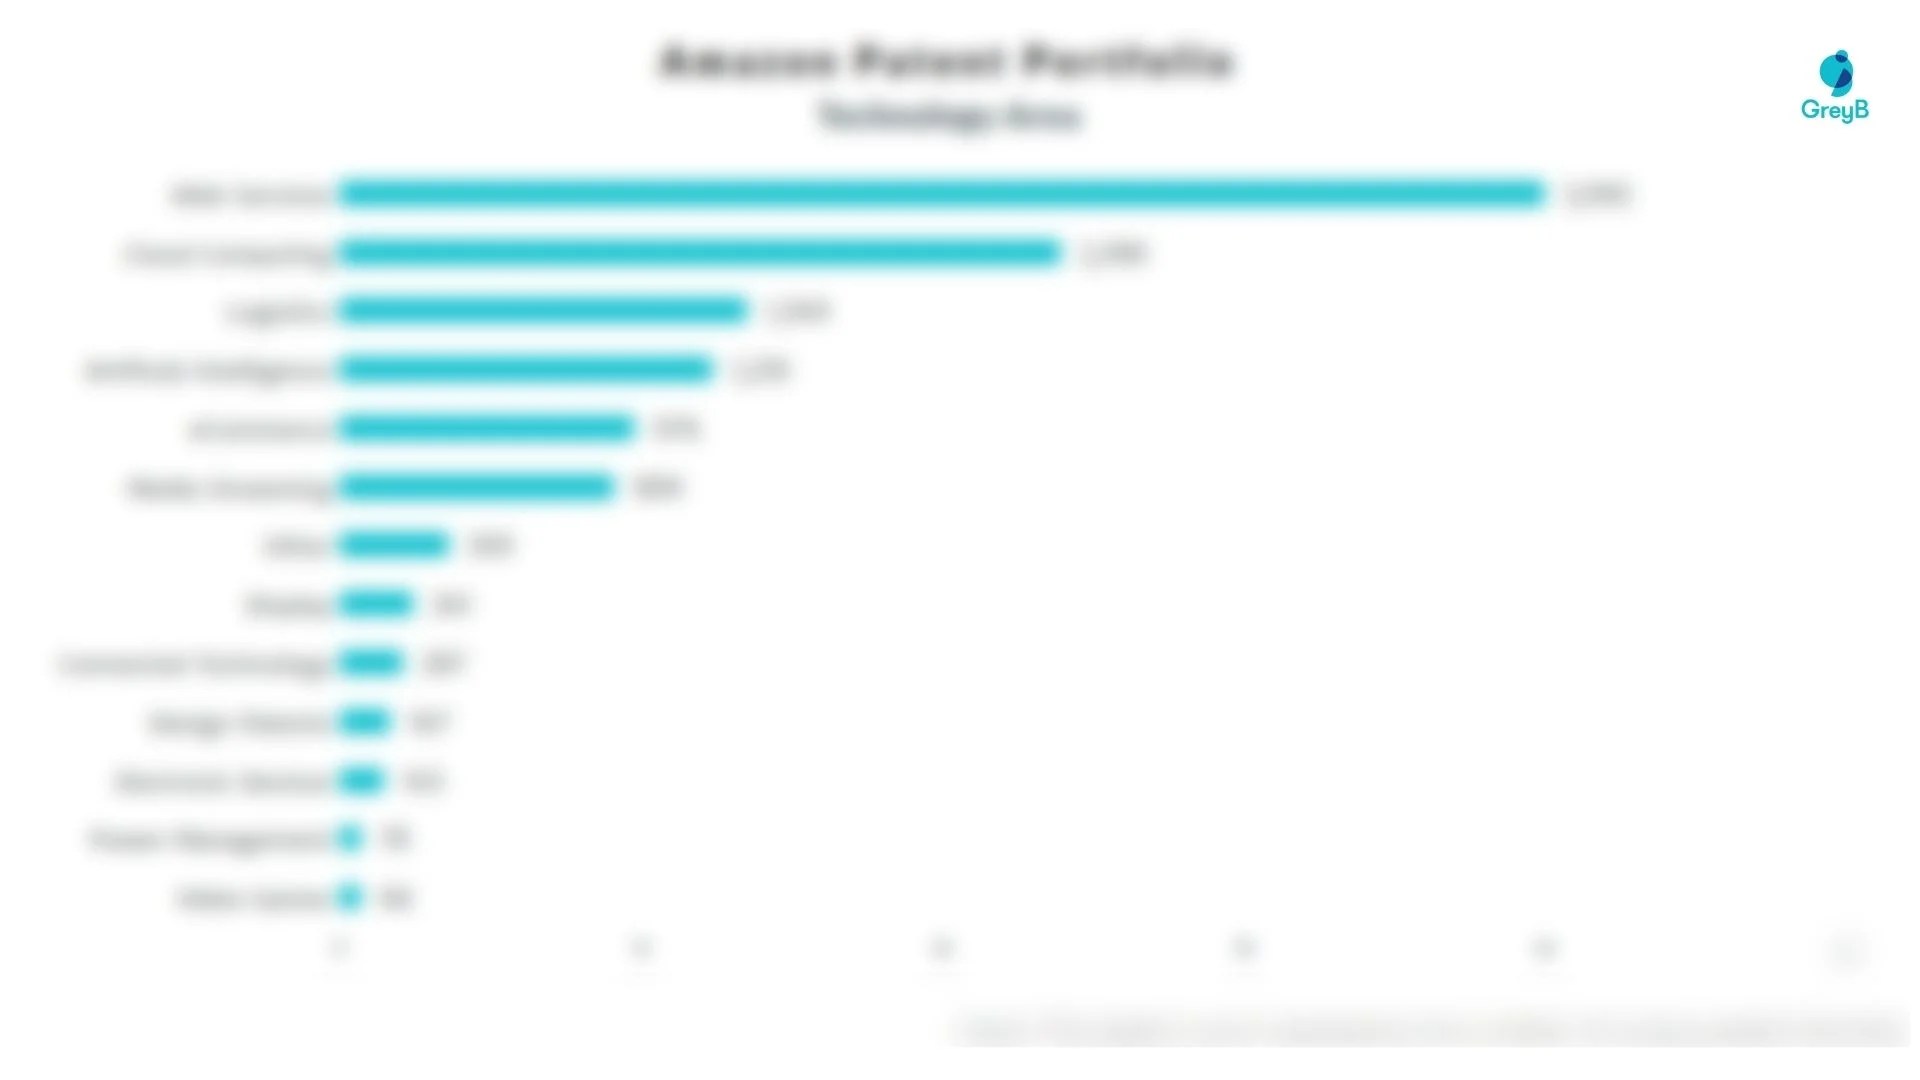
The chart below distributes patents filed by AGCO in different countries on the basis of the technology protected in patents. It also represents the markets where AGCO thinks it’s important to protect particular technological inventions.

R&D Focus: How has AGCO search focus changed over the years?

EXCLUSIVE INSIGHTS COMING SOON!
Interested in knowing about the areas of innovation that are being protected by AGCO?
