Apple is founded in 1976 by Steve Jobs, Steve Wozniak, Ronald Wayne and operates as a consumer electronics company. Find Apple patents information, top technological areas of Apple, worldwide patent filing of Apple and patent filing trend over the years and find so many other stats over the Apple patents portfolio. Do read about some interesting highlights of the Apple Smart Ring, Apple Foldable Phone and Apple Facial Recognition portfolio:
Apple Innovation Prediction Roadmap: 2025-2030
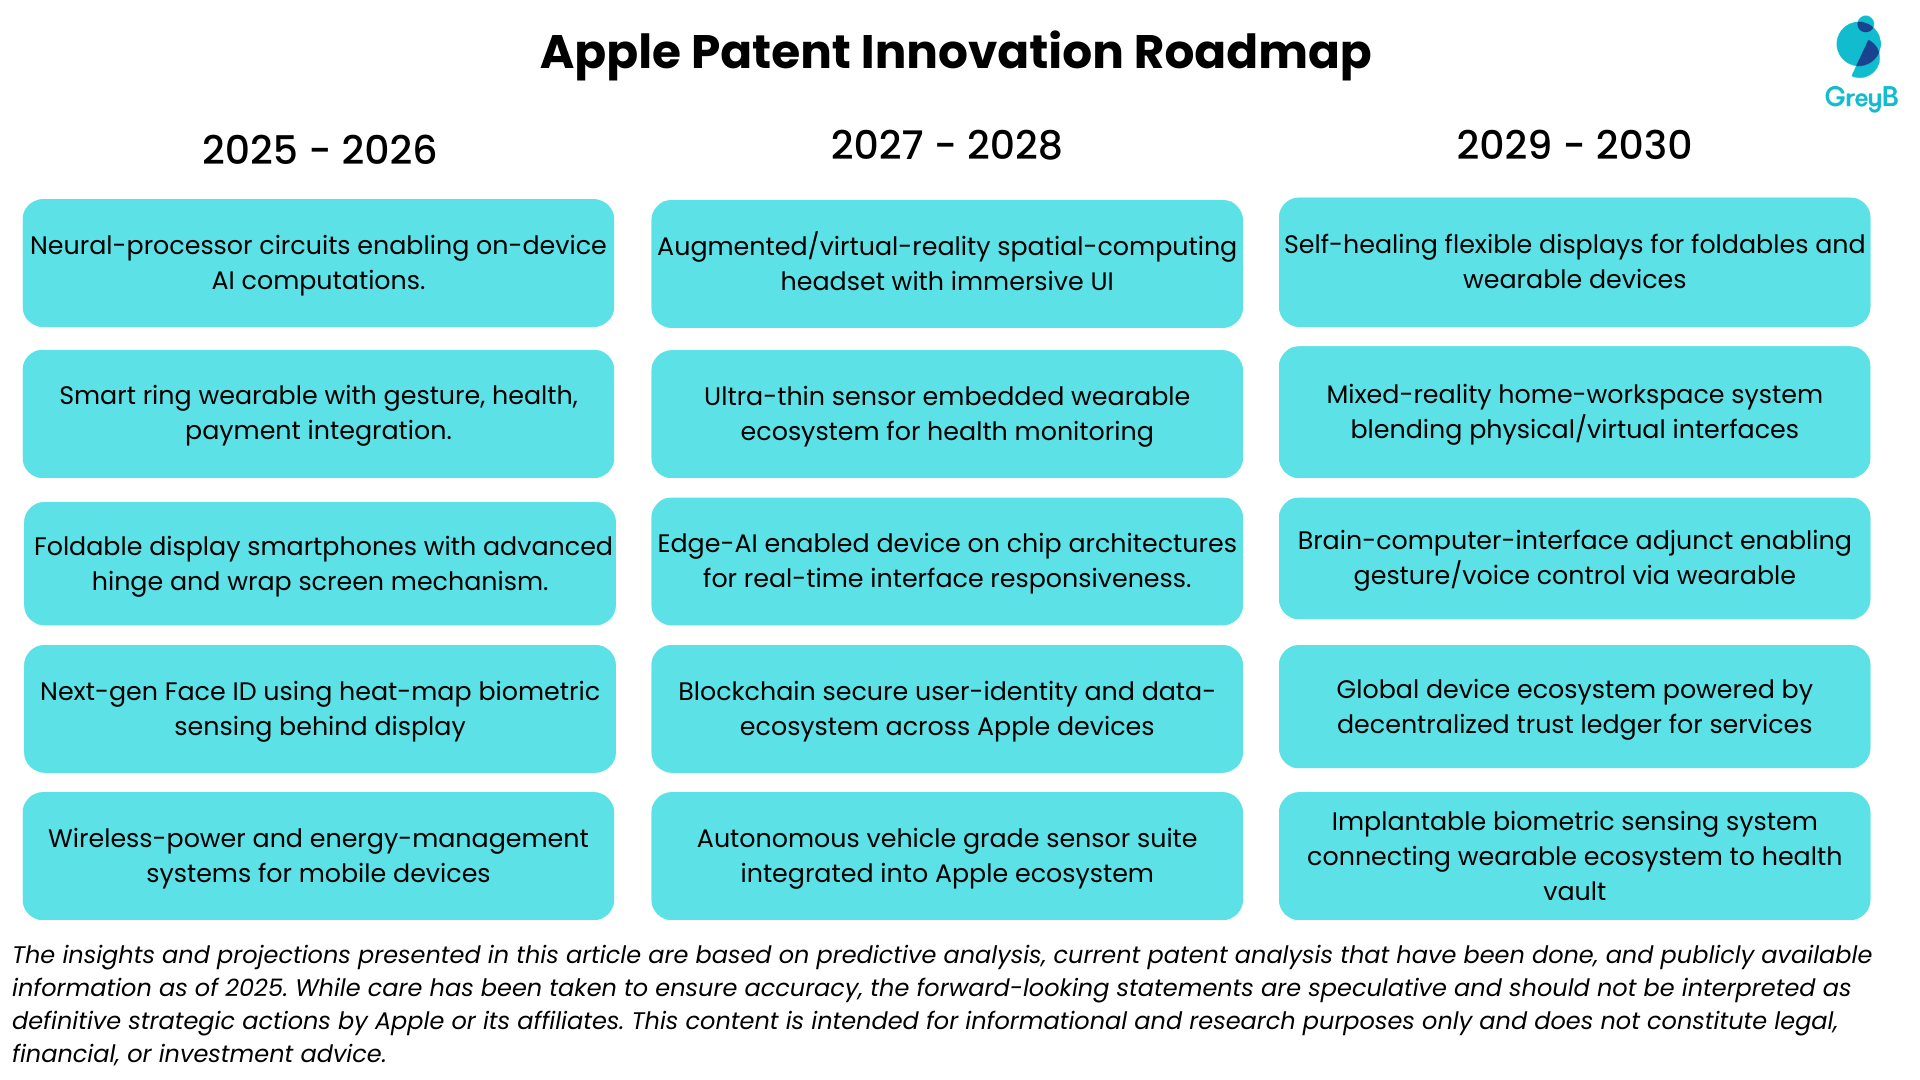
The insights and projections presented in this article are based on predictive analysis, current patent analysis that have been done, and publicly available information as of 2025. While care has been taken to ensure accuracy, the forward-looking statements are speculative and should not be interpreted as definitive strategic actions by Apple or its affiliates. This content is intended for informational and research purposes only and does not constitute legal, financial, or investment advice.
Keep track of every patent move and monitor competitor activity in real-time. Click here for full insights:
How many patents does Apple have?
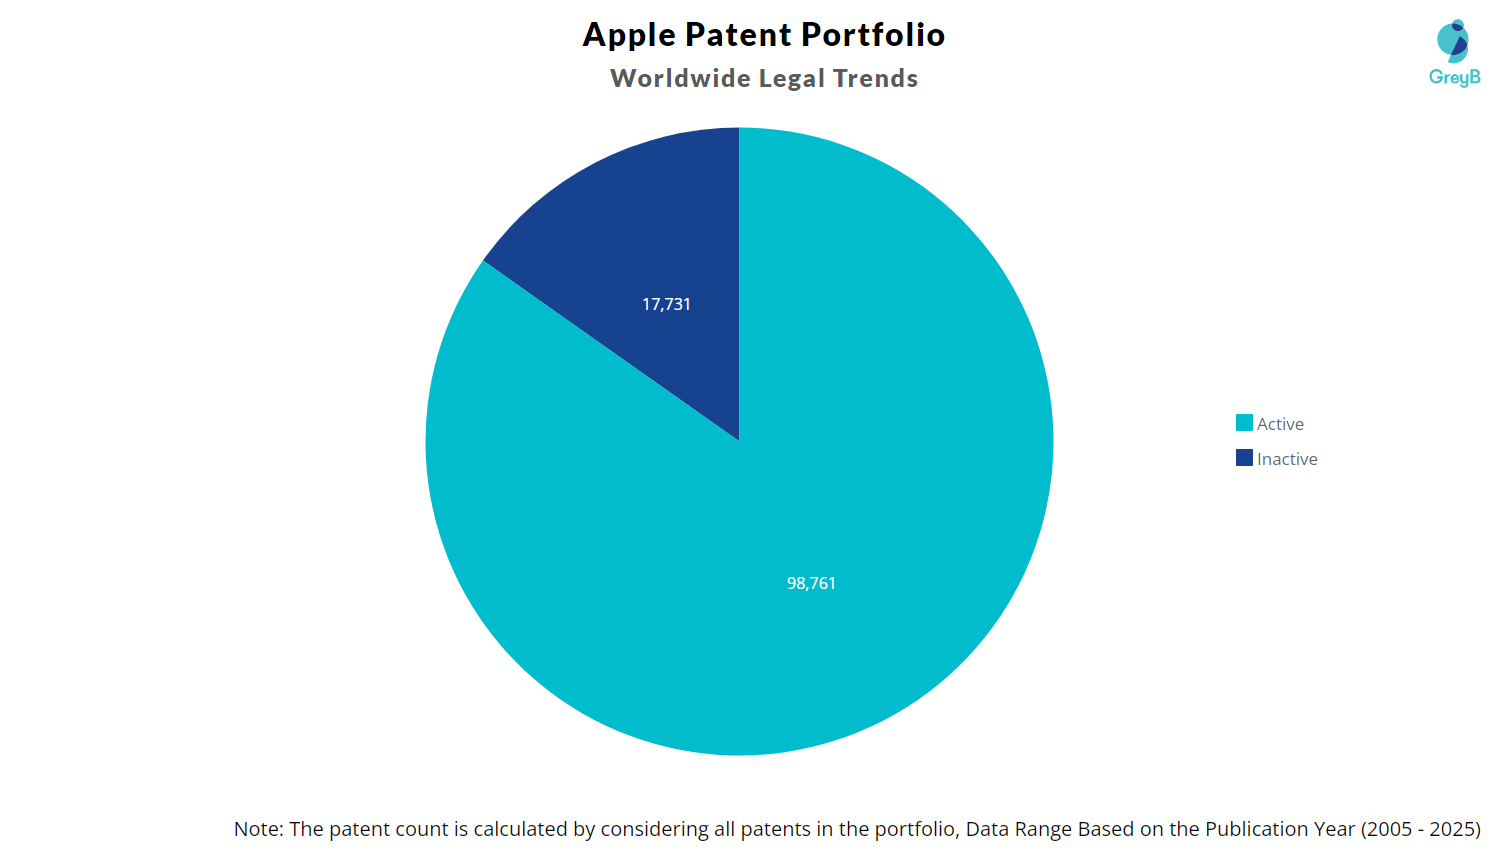
Apple has a total of 116492 patents globally. These patents belong to 50015 unique patent families. Out of 116492 patents, 98761 patents are active.
Want to stay ahead in your key focus areas and surface high-value patents? Start patent monitoring that tracks what truly matters.
How many Apple patents are Alive/Dead?
Worldwide Patents
How Many Patents did Apple File Every Year?
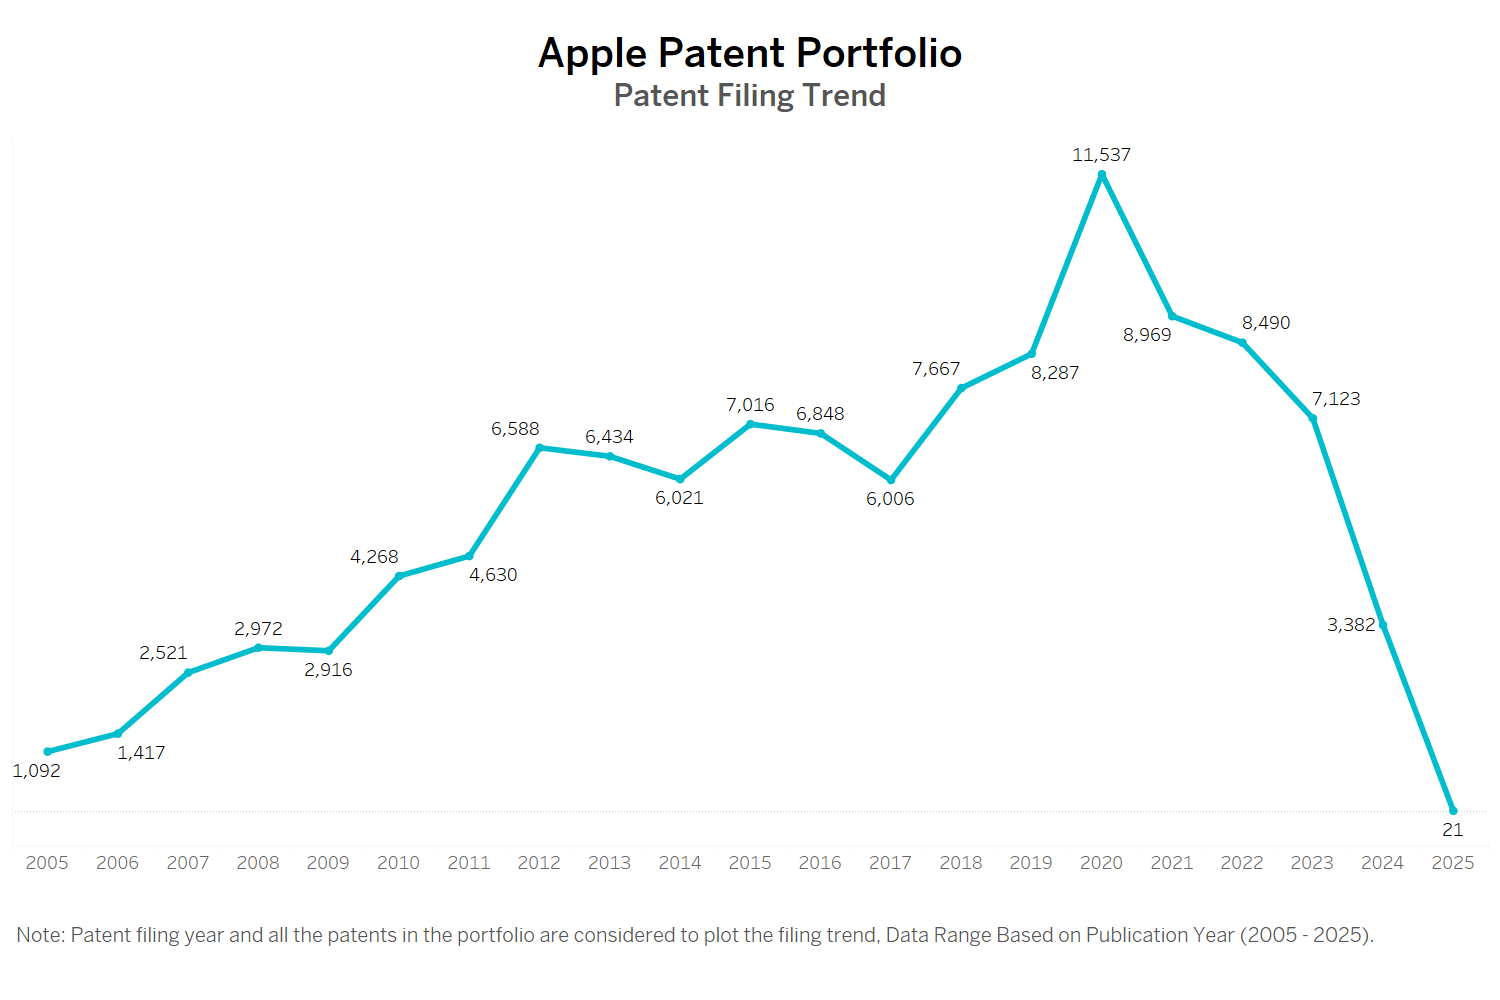
Are you wondering why there is a drop in patent filing for the last two years? It is because a patent application can take up to 18 months to get published. Certainly, it doesn’t suggest a decrease in the patent filing.
| Year of Patents Filing or Grant | Apple Applications Filed | Apple Patents Granted |
| 2025 | 21 | 1157 |
| 2024 | 3382 | 7161 |
| 2023 | 7123 | 5562 |
| 2022 | 8490 | 5796 |
| 2021 | 8969 | 6614 |
| 2020 | 11537 | 5217 |
| 2019 | 8287 | 4922 |
| 2018 | 7667 | 4581 |
| 2017 | 6006 | 4949 |
| 2016 | 6848 | 5297 |
| 2015 | 7016 | 4756 |
| 2014 | 6021 | 4228 |
How Many Patents did Apple File in Different Countries?
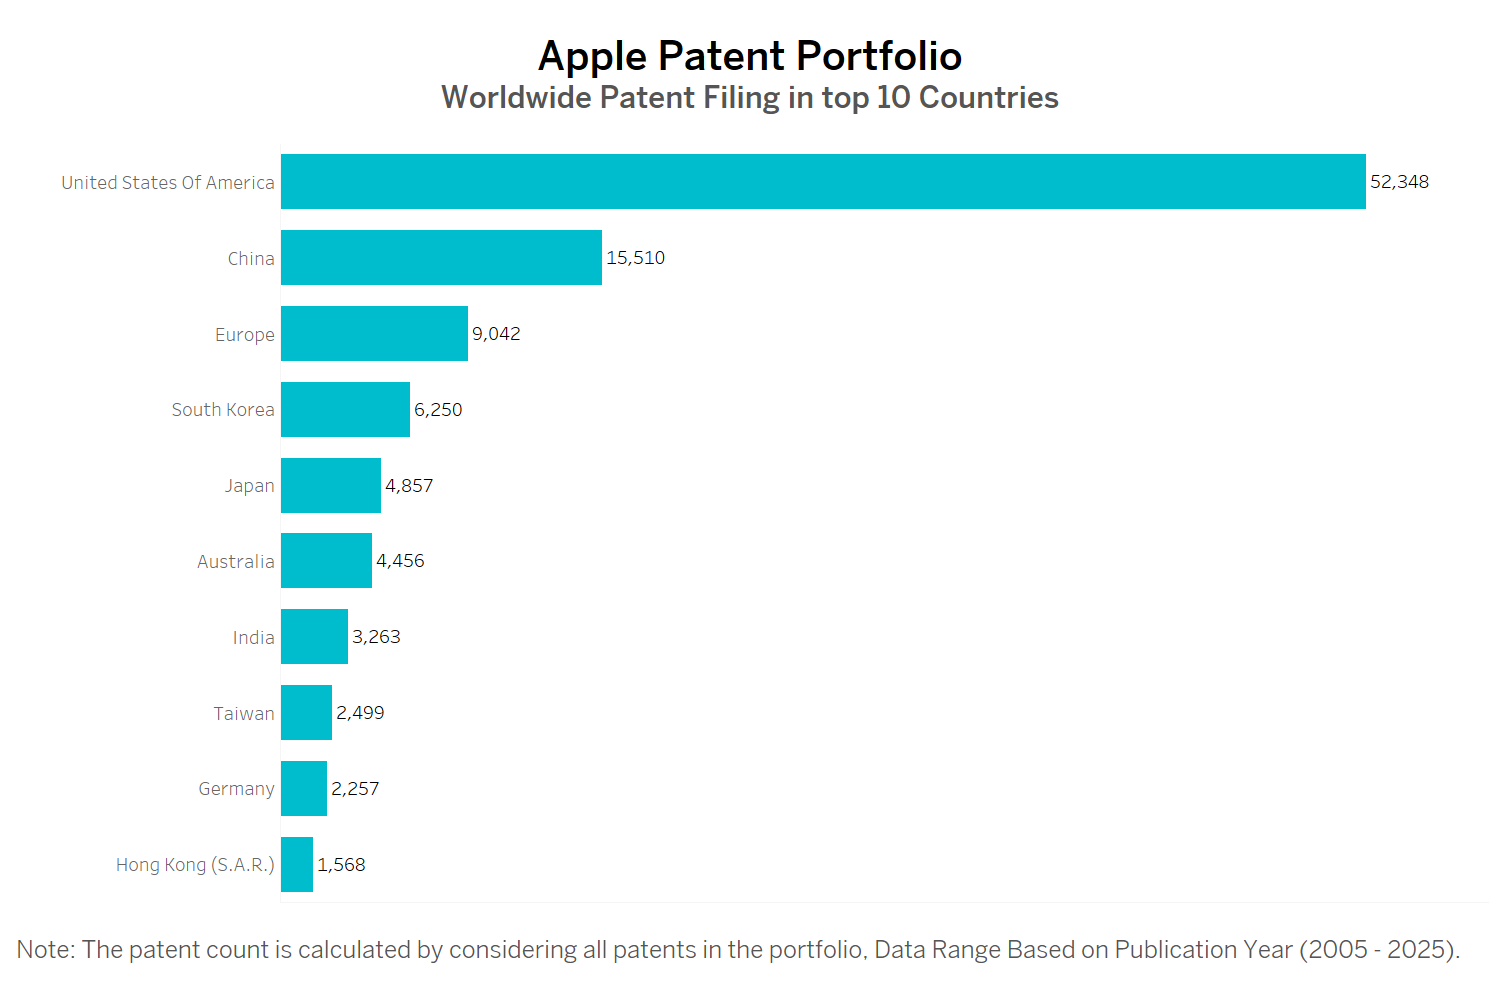
Countries in which Apple Filed Patents
| Country | Patents |
| United States Of America | 52348 |
| China | 15510 |
| Europe (EPO) | 9042 |
| South Korea | 6250 |
| Japan | 4857 |
| Australia | 4456 |
| India | 3263 |
| Taiwan | 2499 |
| Germany | 2257 |
| Hong Kong (S.A.R.) | 1568 |
| United Kingdom | 1328 |
| Canada | 1287 |
| Brazil | 828 |
| Denmark | 453 |
| Mexico | 348 |
| Singapore | 159 |
| Russia | 152 |
| Viet Nam | 128 |
| Netherlands | 118 |
| Spain | 84 |
| Austria | 76 |
| Indonesia | 69 |
| Chile | 61 |
| South Africa | 51 |
| Finland | 47 |
| Malaysia | 43 |
| Thailand | 39 |
| Colombia | 38 |
| New Zealand | 37 |
| Israel | 36 |
| France | 33 |
| Uruguay | 30 |
| Poland | 30 |
| Argentina | 24 |
| Philippines | 24 |
| Sweden | 22 |
| Norway | 22 |
| Turkey | 16 |
| United Arab Emirates | 12 |
| Switzerland | 7 |
| Saudi Arabia | 6 |
| Ecuador | 5 |
| Portugal | 5 |
| Guatemala | 4 |
| Italy | 3 |
| Bosnia And Herzegovina | 1 |
| Montenegro | 1 |
| Belgium | 1 |
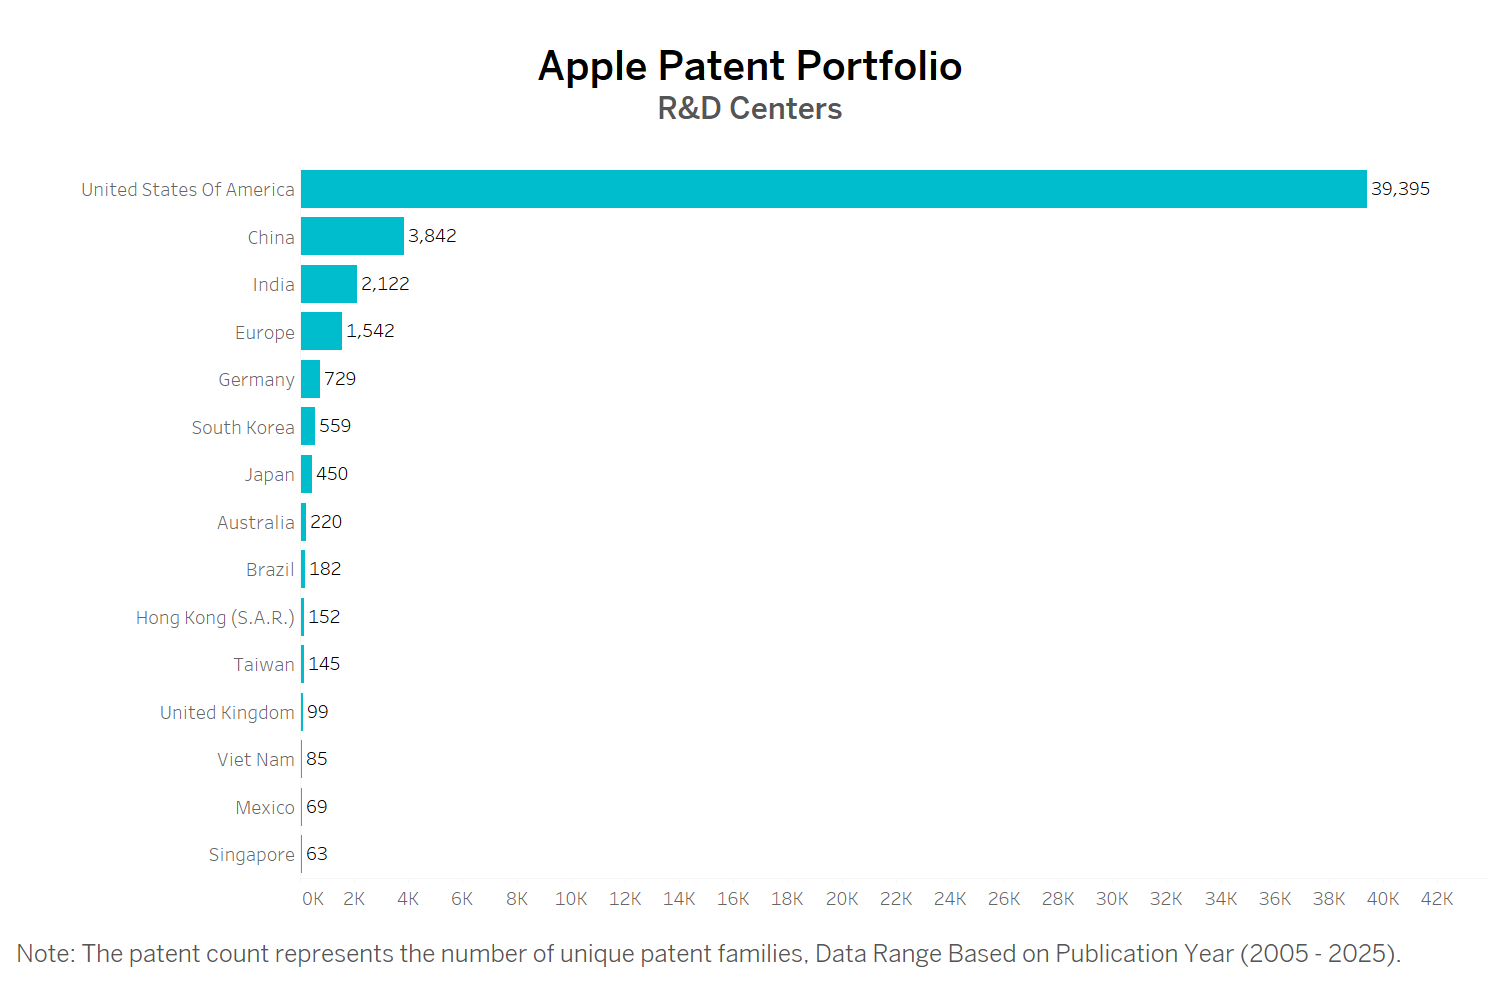
Where are Research Centres of Apple Patents Located?
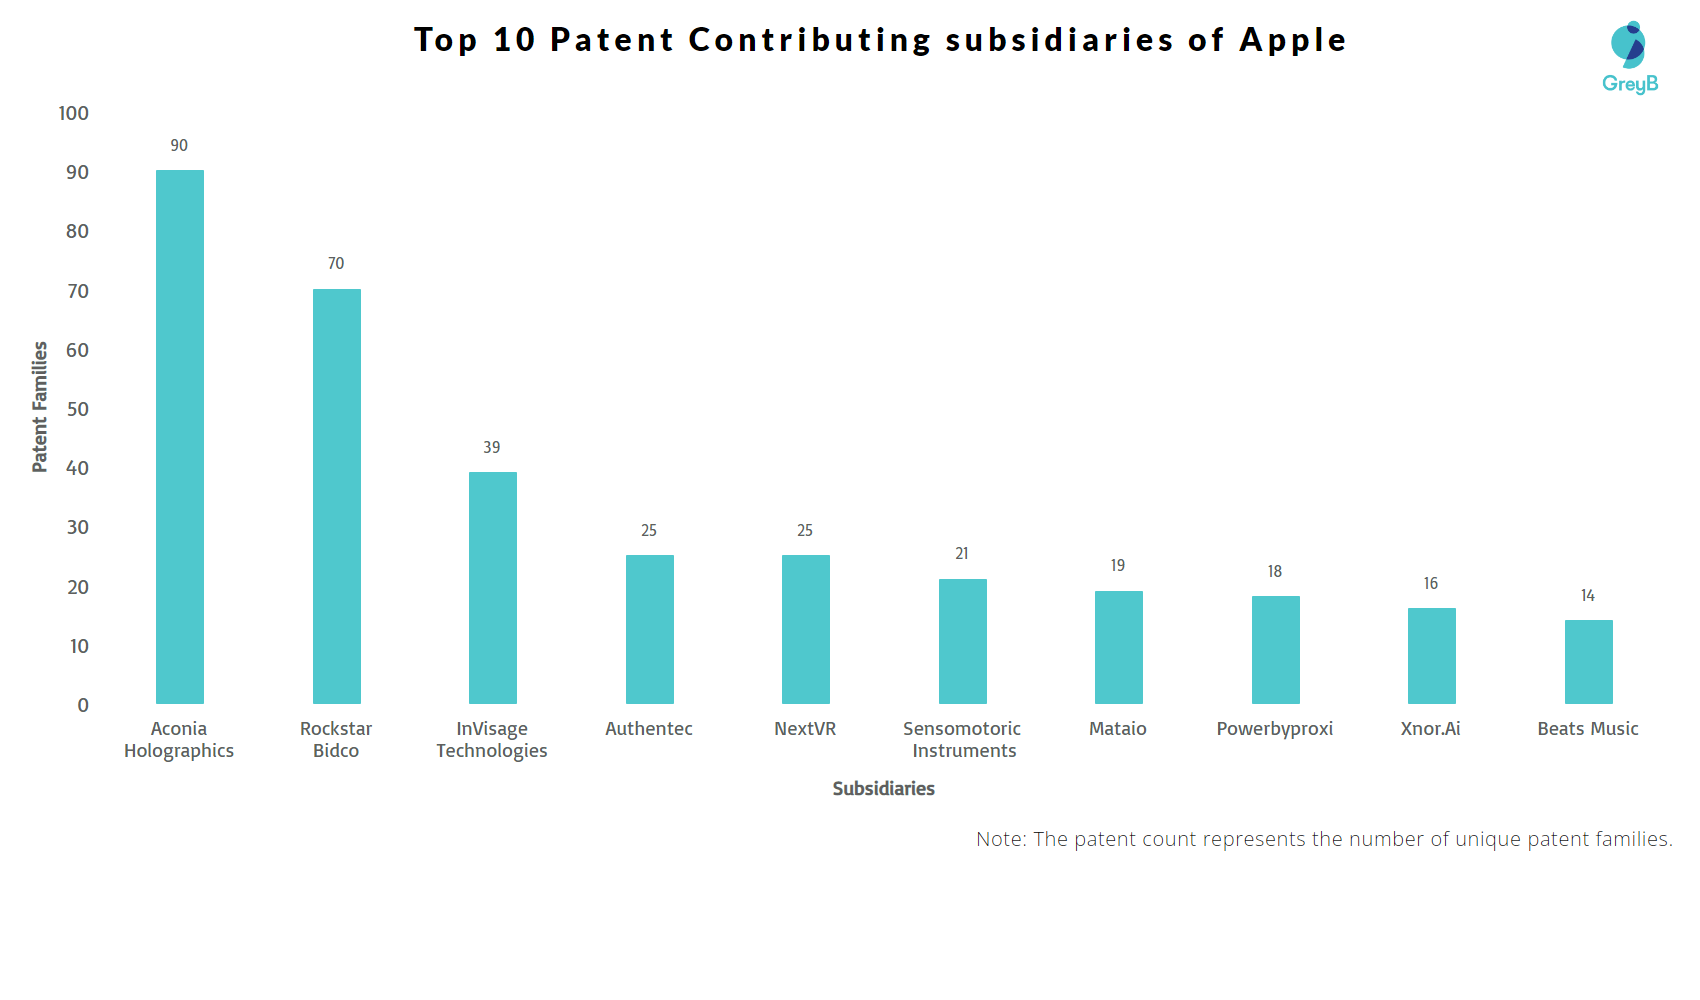
Top Patents Contributing subsidiaries of Apple?
What Technologies are Covered by Apple Patents?
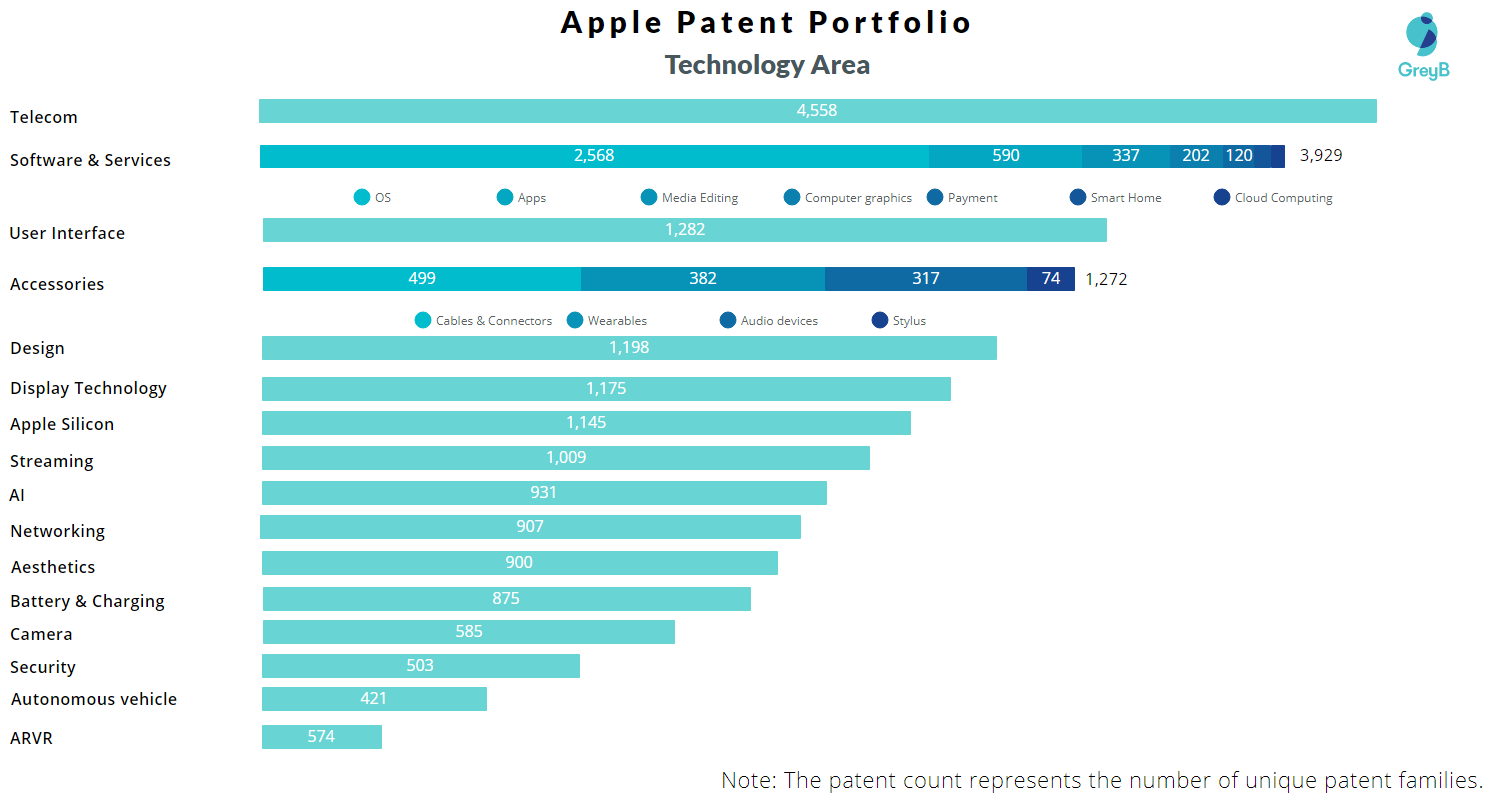
Note: The technology analysis has been done considering the patent data of Apple published till 2022)
Do read our analysis on Apple Facial Recognition!
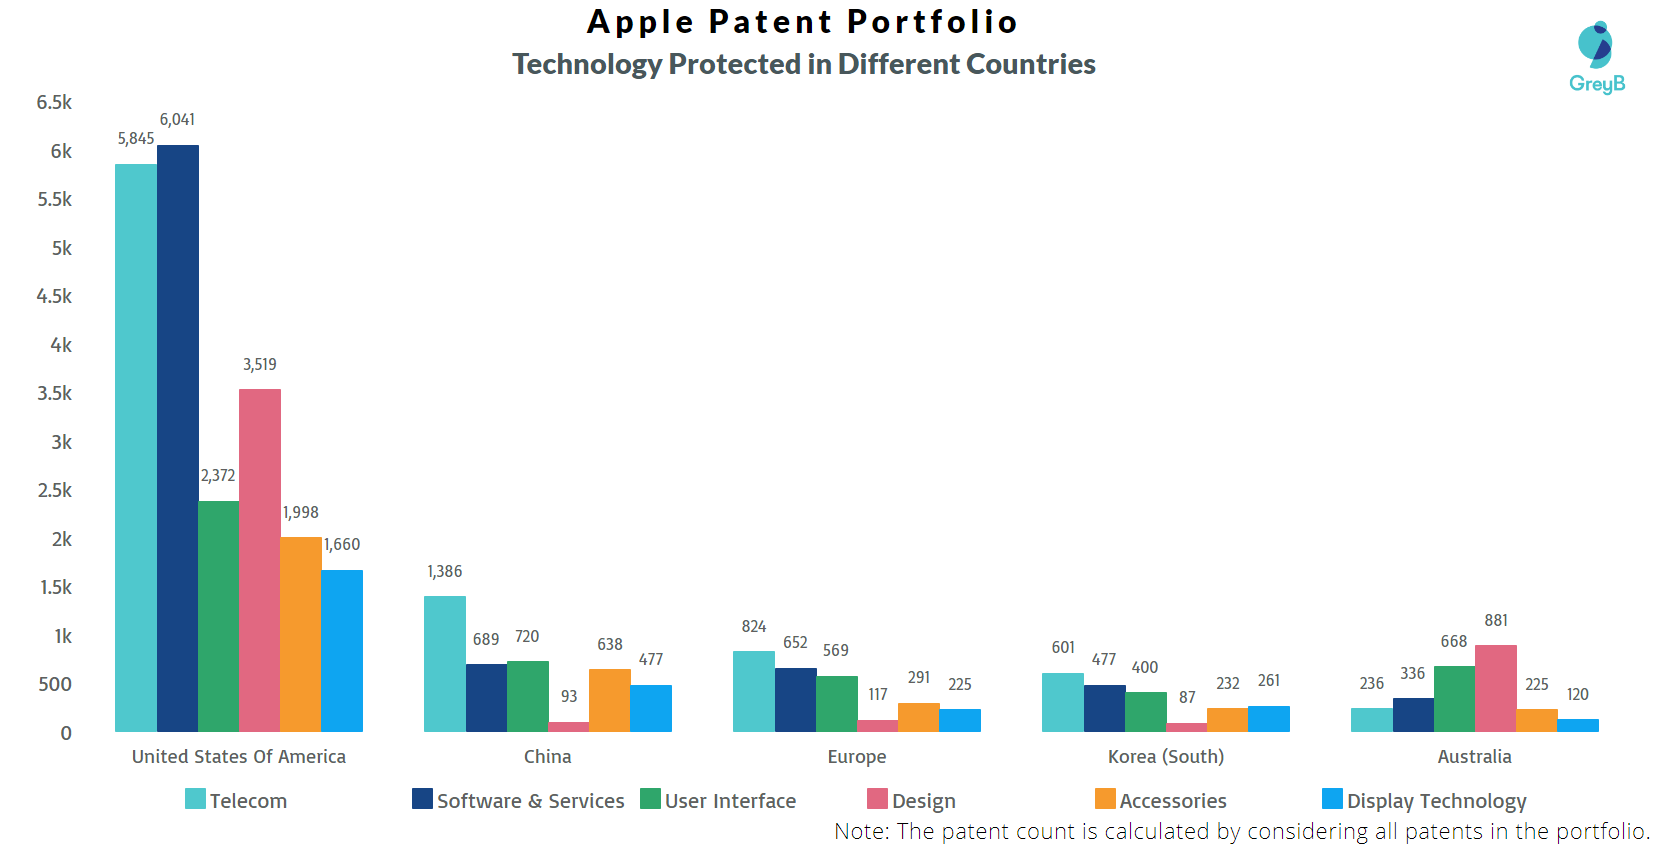
The chart below distributes patents filed by Apple in different countries based on the technology protected in patents. It also represents the markets where Apple thinks it’s important to protect particular technology inventions.
Where are Research Centers of Apple Located?

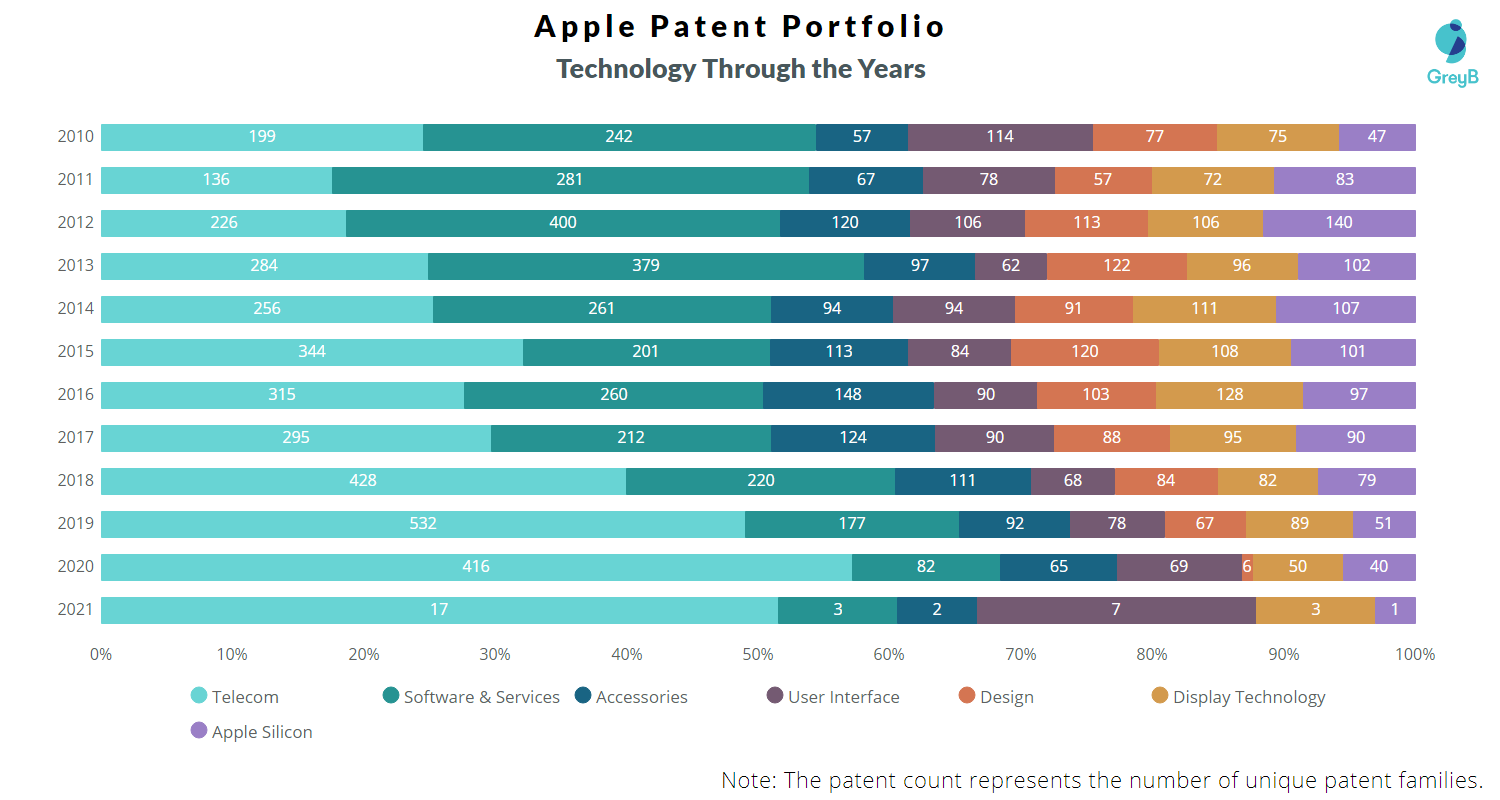
R&D Focus: How Apple Research Focus Changed Over the Years?
10 Best Apple Patents
US20060197753A1 is the most popular patent in the Apple portfolio. It has received 5493 citations so far from companies like Elographics Inc, and Mattel Inc.
Below is the list of 10 most cited patents of Apple:
| Publication Number | Citation Count |
| US20060197753A1 | 5493 |
| US7663607B2 | 3761 |
| US7657849B2 | 3489 |
| US20060033724A1 | 3001 |
| US7614008B2 | 2684 |
| US8279180B2 | 2448 |
| US7479949B2 | 2272 |
| US8239784B2 | 2230 |
| US7844914B2 | 2168 |
| US8479122B2 | 1986 |
Which Companies are using Apple Patents to Advance their Research?
If patents or patents from a particular technology area of a company receive a lot of citations, it implies that the technology is being followed and incrementally innovated by the citing companies. It also indicates that citing companies are working on similar and closely related technologies.
The top-cited technologies in the Apple patent portfolio are Software & Services, Telecom & User Interface. Samsung, Microsoft, and Qualcomm as the top forward citing assignees.
| Company | Number of Patents |
| Samsung | 5016 |
| Microsoft | 2573 |
| Qualcomm | 2034 |
| 1824 | |
| Sony | 1556 |
| LG | 1492 |
| IBM | 1483 |
| Intel | 1309 |
| Blackberry | 872 |
| Nokia | 819 |
| Huawei | 770 |
| Canon | 574 |
| Amazon | 469 |
| BOE | 450 |
| 422 |
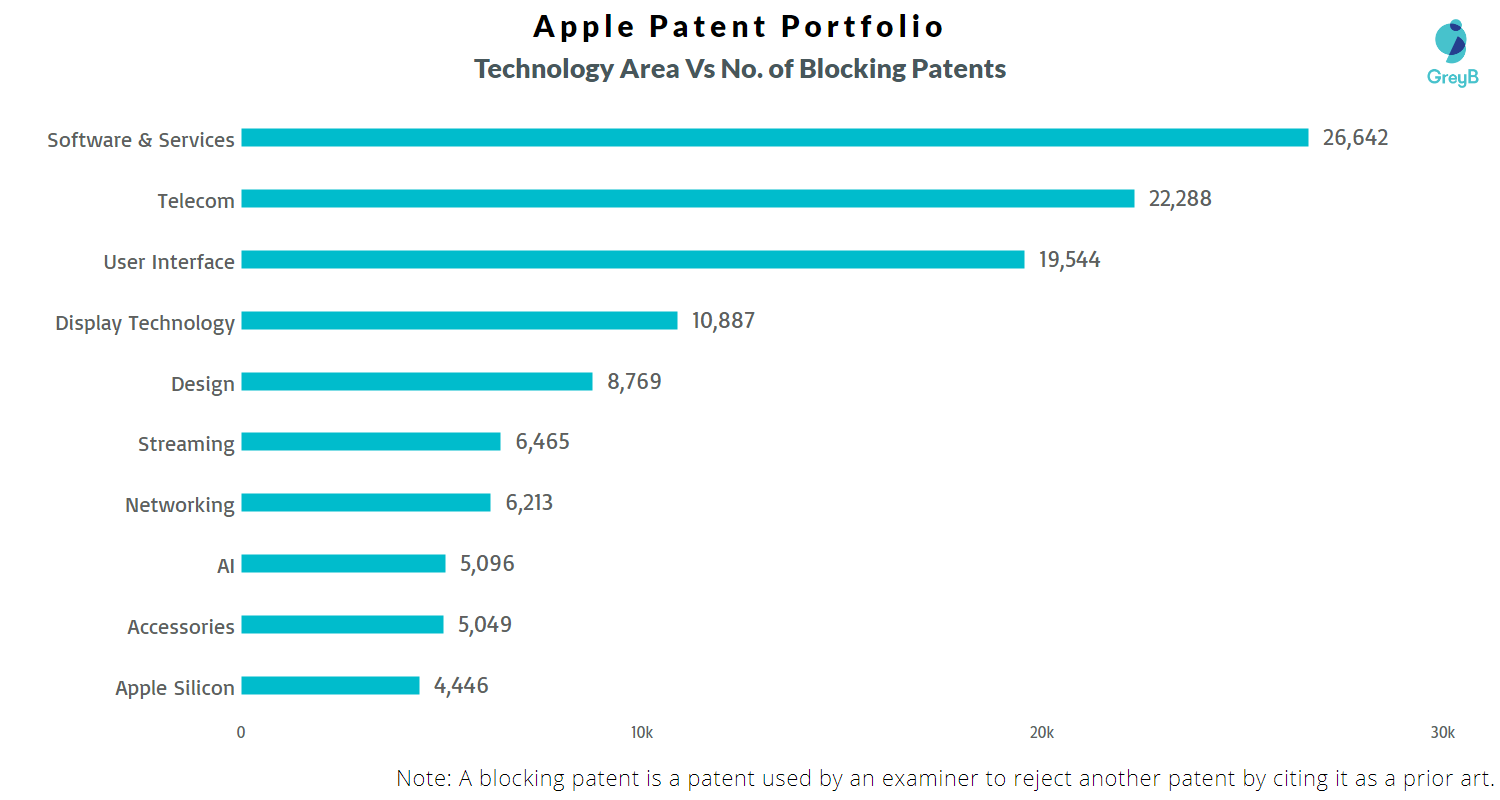
How many inventions of other companies were rejected due to Apple patents?
The statistics below share strategic R&D insights. It tells the companies that were trying to protect inventions similar to Apple. They couldn’t because Apple had protected those before them.
Examiners at the USPTO used 16073 Apple patents in 147239 rejections (35 USC § 102 or 35 USC § 103 types). Below is the distribution of the number of blocked patent applications vs the technology cluster of Apple patents.
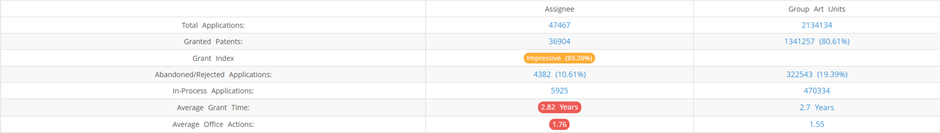
What Percentage of Apple US Patent Applications were Granted?
Apple (Excluding its subsidiaries) has filed 47467 patent applications at USPTO so far (Excluding Design and PCT applications). Out of these 36904 have been granted leading to a grant rate of 89.39%.
Below are the key stats of Apple patent prosecution at the USPTO.
Which Law Firms Filed Most US Patents for Apple?
| Law Firm | Total Applications | Success Rate |
| Kowert Hood Munyon Rankin & Goetzel | 7872 | 89.28% |
| Treyz Law Group | 3536 | 90.43% |
| Womble Bond Dickinson US Llp | 3051 | 94.84% |
| Kilpatrick Townsend & Stockton Llp | 2848 | 88.62% |
| Dla Piper Llp | 2514 | 88.88% |
| Dickinson Wright Rllp | 2045 | 88.55% |
| Brownstein | 2023 | 88.36% |
| Blank Rome Llp | 1778 | 83.08% |
| Bakerhostetler | 1701 | 75.91% |
| Fish & Richardson Pc | 1692 | 86.43% |
| Kubota & Basol Llp | 1554 | 94.14% |
| Fletcher | 1545 | 87.98% |
| Sterne Kessler Goldstein & Fox Pllc | 1337 | 92.17% |
One more thing, We have converted this entire analysis in PDF form that you can download and save for later reading (or sharing with your friends). You can download it using the form below: