Boston University (BU) is recognized globally for its commitment to innovation and research excellence. With a robust patent portfolio spanning multiple industries and geographies, BU’s intellectual property (IP) landscape highlights its contributions to solving global challenges. This report provides an updated analysis of Boston University’s patent portfolio as of 2024, covering trends, collaboration opportunities, and emerging focus areas.
Snapshot of Boston University’s Patent Portfolio
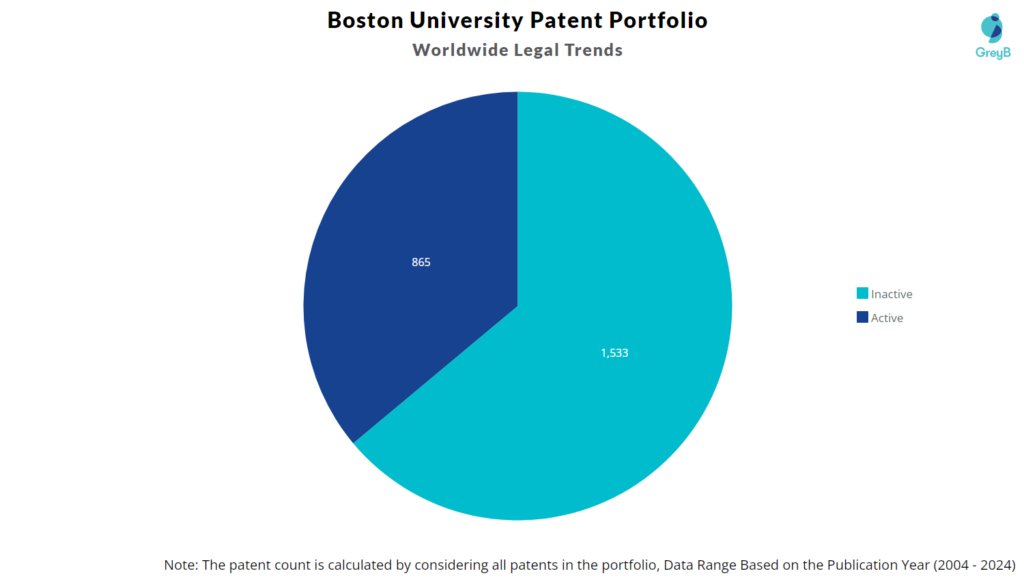
- Total Patents: 2,398 (Globally)
- Granted Patents: 914
- Active Patents: 865 (~36%)
- Unique Patent Families: 663
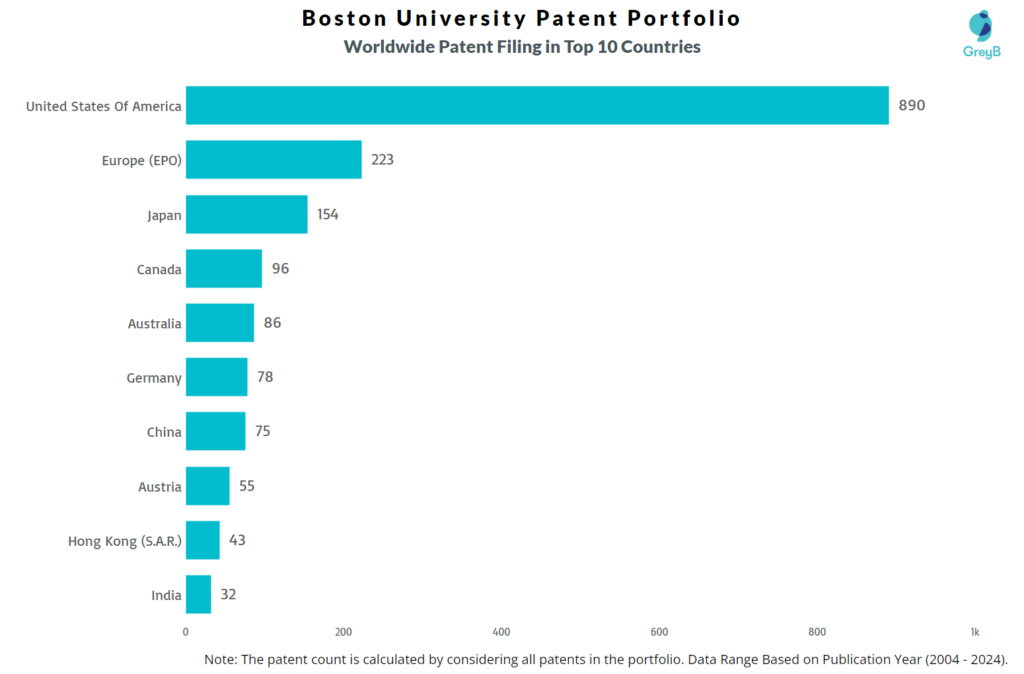
- Most Active Jurisdiction: United States (890 patents filed)
With 36% of its patents classified as active, Boston University demonstrates a solid focus on innovation longevity, suggesting a balanced mix of exploratory and commercially viable R&D initiatives.
How Many Patents did Boston University File Every Year?
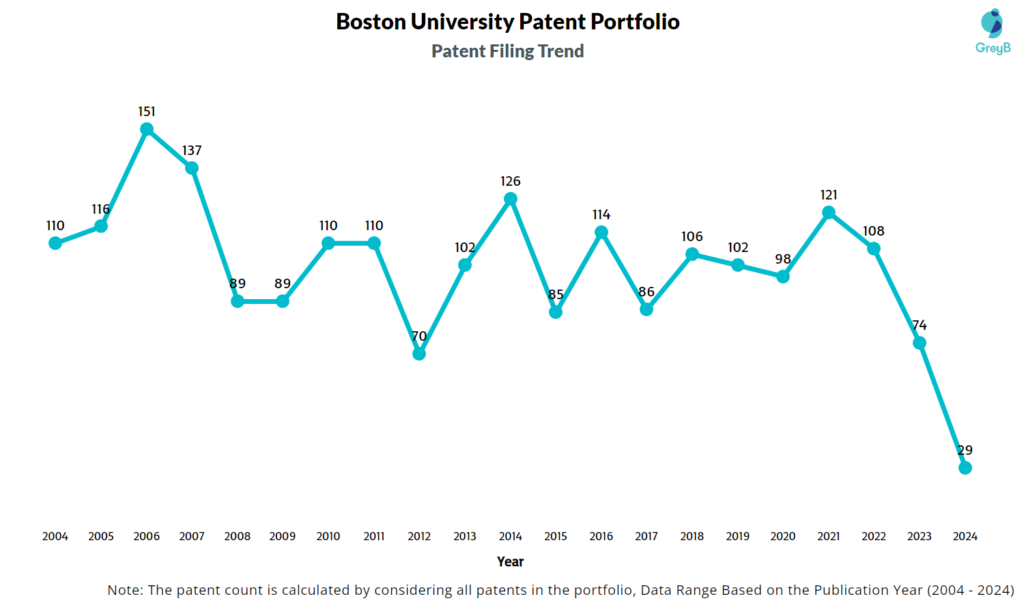
Are you wondering why there is a drop in patent filing for the last two years? It is because a patent application can take up to 18 months to get published. Certainly, it doesn’t suggest a decrease in the patent filing.
| Year of Patents Filing or Grant | Boston University Applications Filed | Boston University Patents Granted |
| 2024 | 29 | 58 |
| 2023 | 74 | 71 |
| 2022 | 108 | 71 |
| 2021 | 121 | 61 |
| 2020 | 98 | 80 |
| 2019 | 102 | 66 |
| 2018 | 106 | 40 |
| 2017 | 86 | 46 |
| 2016 | 114 | 32 |
| 2015 | 85 | 36 |
| 2014 | 126 | 26 |
How many Boston University patents are Alive/Dead?
Worldwide Patents
How Many Patents did Boston University File in Different Countries?
Countries in which Boston University Filed Patents
| Country | Patents |
| United States Of America | 890 |
| Europe (EPO) | 223 |
| Japan | 154 |
| Canada | 96 |
| Australia | 86 |
| Germany | 78 |
| China | 75 |
| Austria | 55 |
| Hong Kong (S.A.R.) | 43 |
| India | 32 |
| Israel | 27 |
| Spain | 20 |
| Mexico | 20 |
| Brazil | 17 |
| Singapore | 13 |
| Denmark | 9 |
| South Africa | 7 |
| Taiwan | 6 |
| Italy | 6 |
| Portugal | 5 |
| New Zealand | 4 |
| Russia | 3 |
| United Kingdom | 2 |
| Turkey | 2 |
| Norway | 2 |
| Saudi Arabia | 2 |
| Indonesia | 1 |
| Eurasia | 1 |
| Hungary | 1 |
| Philippines | 1 |
| Gulf Cooperation Council | 1 |
| Korea (South) | 1 |
| Tunisia | 1 |
| Chile | 1 |
| Morocco | 1 |
| Slovenia | 1 |
| Estonia | 1 |
| Costa Rica | 1 |
| Slovakia | 1 |
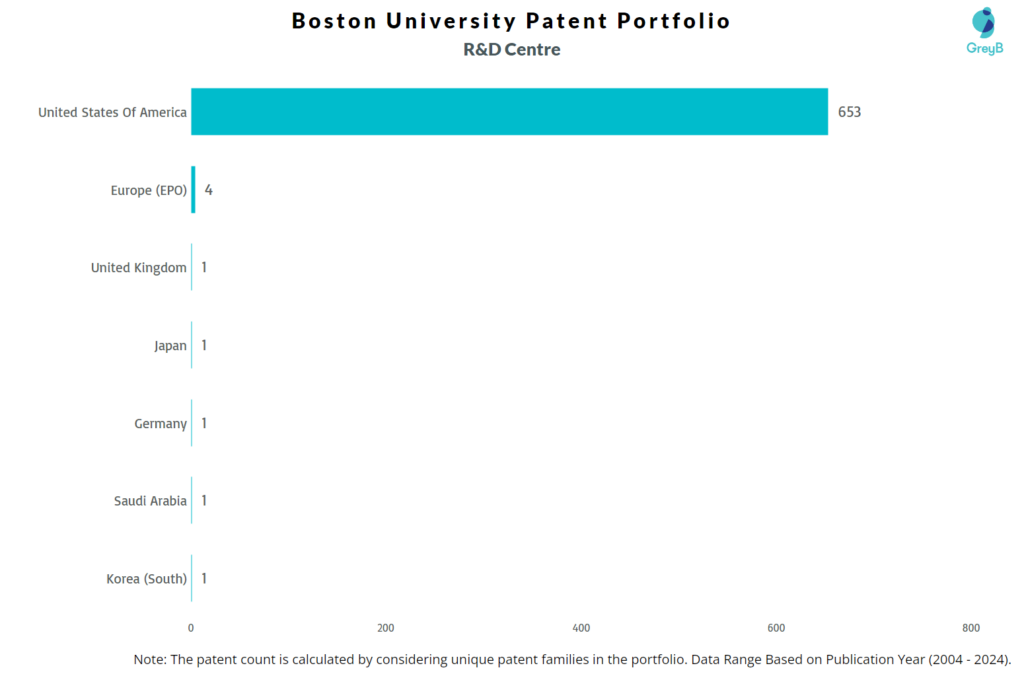
Where are Research Centers of Boston University Patents Located?
10 Best Boston University Patents
US7883475B2 is the most popular patent in the Boston University portfolio. It has received 291 citations so far from companies like Valtech Cardio, Ltd, Auris Health, Inc and Ethicon Llc.
Below is the list of 10 most cited patents of Boston University:
| Publication Number | Citation Count | Technology Area |
| US7883475B2 | 291 | Medical Devices |
| US20080077192A1 | 283 | Cardiac Imaging |
| US20070207466A1 | 278 | Biomedical Engineering |
| US7645576B2 | 260 | Tissue Engineering |
| US7700325B2 | 205 | Biotechnology |
| US7251609B1 | 187 | Healthcare Imaging |
| US6840117B2 | 177 | Drug Delivery Systems |
| US20100179428A1 | 168 | Medical Diagnostics |
| US7806854B2 | 161 | Nanotechnology |
| US20090306509A1 | 153 | Neuroscience |
Collaborations and Industry Engagement
Boston University collaborates with industry leaders, showcasing the practical applicability of its research. Collaborative patents represent partnerships across a diverse range of industries, including healthcare, biotechnology, and advanced materials.
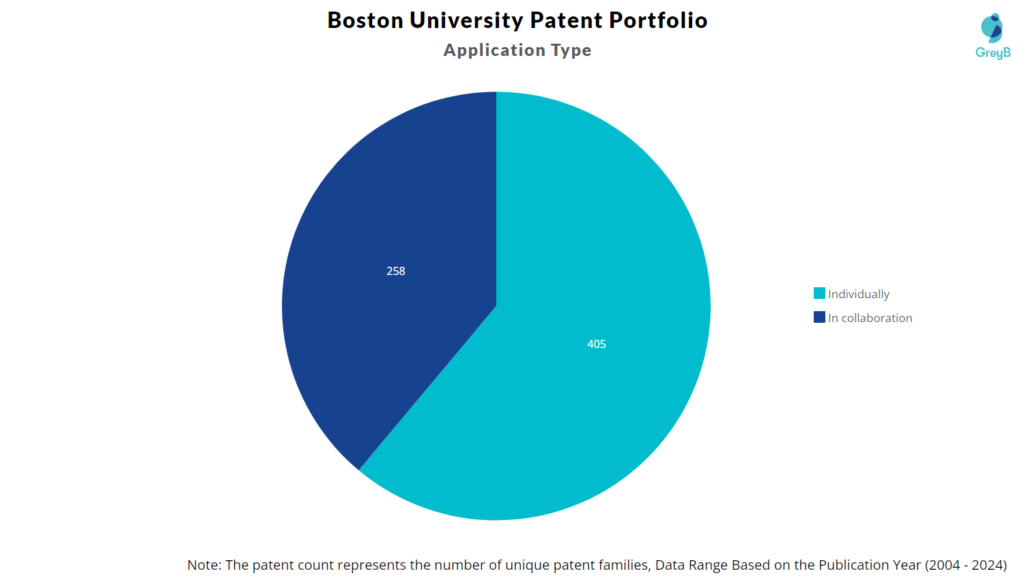
List of Collaborators by Patent Families
| Collaborator | Patent Families |
| Fraunhofer Usa Inc | 13 |
| Beta Bionics Inc | 4 |
| Boston Medical Center Corporation | 3 |
| Sartorius Stedim Biotech Gmbh | 3 |
| Neurala Llc | 2 |
| Modular Genetics Inc | 2 |
| Kos Pharmaceuticals Inc | 2 |
| Senti Biosciences Inc | 2 |
| Sri International | 2 |
| Infinium Inc | 2 |
| Nanovalent Pharmaceuticals Inc | 2 |
| Scion Pharmaceuticasl Inc | 1 |
| Protiva Biotherapeutics Inc | 1 |
| Viracta Subsidiary Inc | 1 |
| Emd Millipore Corporation | 1 |
| Samsung Electronics Co Ltd | 1 |
| Bg Negev Technologies And Applications Ltd | 1 |
| Sumitomo Chemical Company | 1 |
| Galvani Bioelectronics Limited | 1 |
| Pacgen Biopharmaceuticals Corporation | 1 |
| Hemanext Llc | 1 |
| Saint-Gobain Ceramics & Plastics Inc | 1 |
| Hemaquest Pharmaceuticals Inc | 1 |
| Saudi Arabian Oil Company | 1 |
| Imperial Innovations Limited | 1 |
| Siemens Healthineers Ag | 1 |
| Bornio Inc | 1 |
| Triad National Security Llc | 1 |
| International Business Machines Corporation | 1 |
| Elucid Bioimaging Inc | 1 |
| Kazak Composites Incorporated | 1 |
| Periodontix Inc | 1 |
| Koninklijke Philips Nv | 1 |
| Remodeless Cv Ltd | 1 |
| Bank Of America Corporation | 1 |
| Salesforcecom Inc | 1 |
| Microfabrica Inc | 1 |
| Carl Zeiss Microscopy Gmbh | 1 |
| Boston Scientific Scimed Inc | 1 |
| Schlumberger Technology Corporation | 1 |
| Aquinnah Pharmaceuticals Inc | 1 |
| Cyber Materials Llc | 1 |
| Nanoview Biosciences Inc | 1 |
| Eip Pharma Inc | 1 |
| National Technology & Engineering Solutions Of Sandia Llc | 1 |
| The Braun Corporation | 1 |
| Btu International Inc | 1 |
| Unchained Labs | 1 |
| Nitromed Inc | 1 |
| Yeda Research And Development Co Ltd | 1 |
| Optech Ventures Llc | 1 |
| Osram Opto Semiconductors Gmbh | 1 |
Opportunity for Partners: Companies seeking collaboration in healthcare, AI/ML, and biotechnology can benefit from BU’s established partnerships and its expansive IP in these domains.
Focus Areas: Technology Domains
Breakdown of Technology Areas by Patent Families
| Technology | Families |
| Healthcare | 184 |
| Measurement devices | 22 |
| Image analysis | 13 |
| Biotechnology | 7 |
| Quantum computing | 3 |
| AI/ML | 3 |
| Data processing | 3 |
| Metal production | 2 |
| Construction | 2 |
| Nanotechnology | 2 |
| Communication | 2 |
| Energy generation | 2 |
| Electrode thermal treatment | 1 |
| Light management technologies | 1 |
| Organ storage | 1 |
| 3D printing | 1 |
| Batteries | 1 |
| Safety & security | 1 |
| Energy minimization | 1 |
| Error correction/detection | 1 |
Healthcare and biotechnology dominate Boston University’s patent portfolio, reinforcing its leadership in addressing critical challenges like medical diagnostics and therapeutics. Emerging fields such as quantum computing and AI/ML reflect the university’s forward-looking innovation agenda.
Key Takeaways
· Global Patent Leader: With 2,398 patents globally, Boston University is a prominent player in academic research commercialization.
· Strength in Healthcare: 184 patent families in healthcare signal BU’s expertise in solving critical medical challenges.
· Emerging Focus Areas: Fields like quantum computing and AI/ML indicate BU’s alignment with next-generation technologies.
· Industry Collaborations: Partnerships with organizations like Fraunhofer USA and Samsung highlight BU’s ability to translate academic research into practical innovations.
What are Boston University key innovation segments?
R&D Focus: How has Boston University search focus changed over the years?
EXCLUSIVE INSIGHTS COMING SOON!
Interested in knowing about the areas of innovation that are being protected by Boston University?
