The definitive landscape of global innovation. We analyzed 60M+ patents across 150+ countries to reveal the structural shifts in AI, Green Tech, and Geopolitics.
A curated glimpse into the data driving the 2026 global landscape.
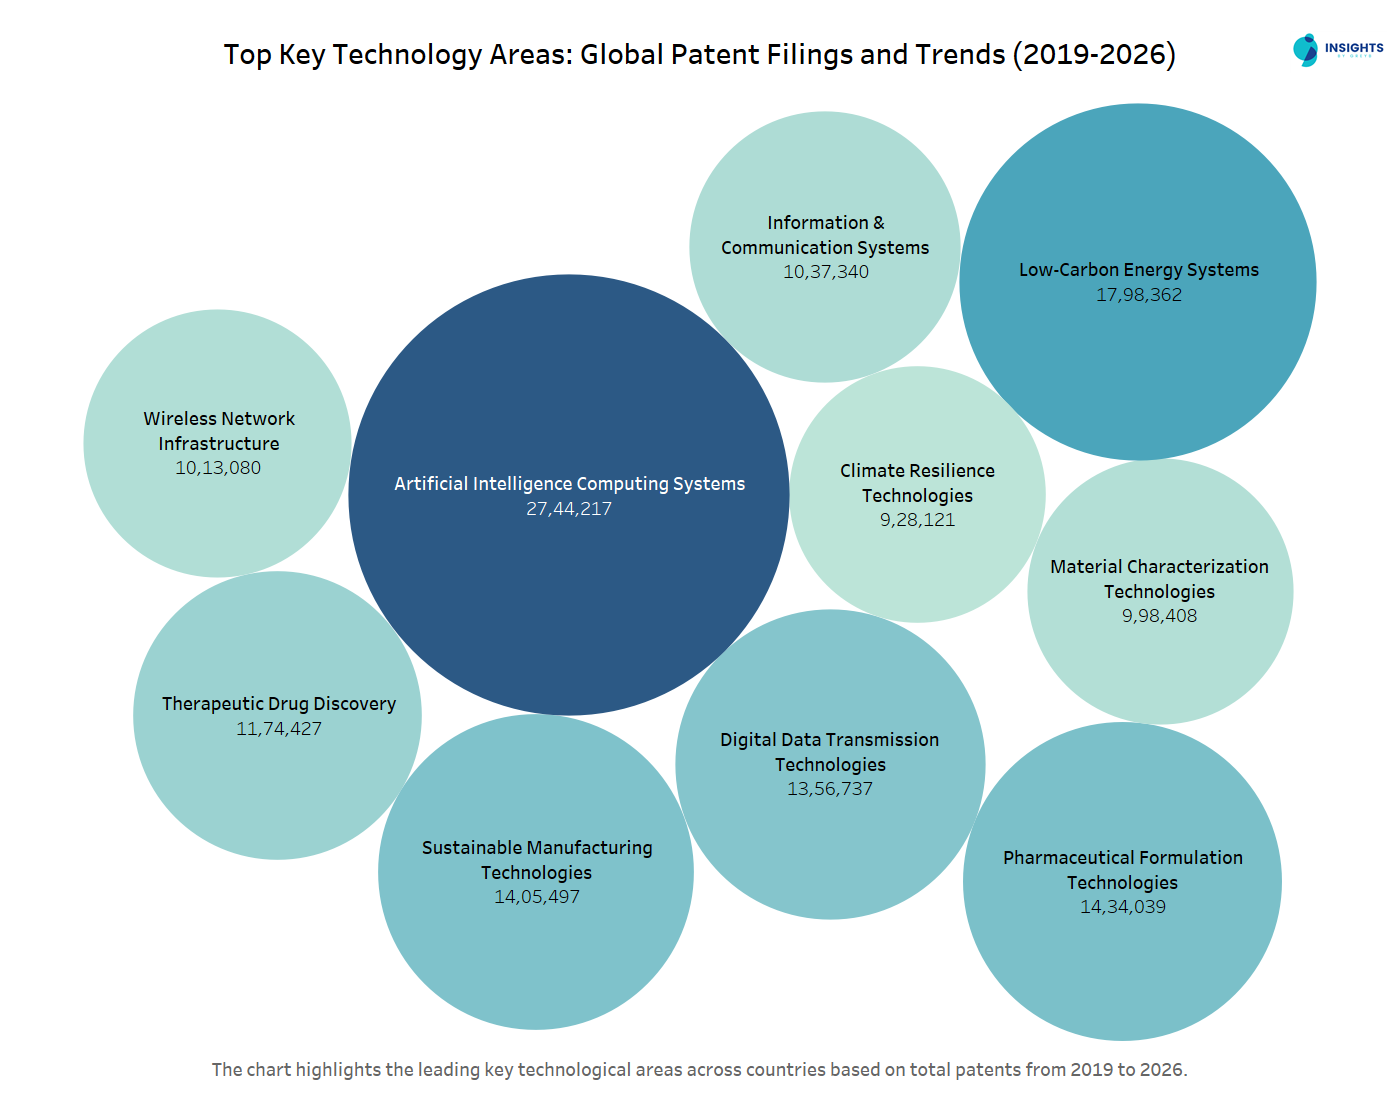
AI Computing Systems (2.7M+ patents) is the defining structural reality, with Generative AI publications surging over 800% since 2014. This is followed by Low-Carbon Energy (1.7M+) and Sustainable Manufacturing (1.4M+), both driven by aggressive global policy mandates and a 106% single-year jump in industrial R&D.
China exhibits structural dominance with 33.9M patents, though 96% remain domestic-only. Meanwhile, India has emerged as the only major economy with 10 consecutive years of growth, with resident filings now accounting for 61.79% of total submissions, signaling a maturing domestic ecosystem.
US patent litigation has rebounded to 5.2K cases. Most critically, Non-Practicing Entities (NPEs) have crossed a structural threshold, now driving 56.1% of all US district court cases. In the high-tech sector specifically, NPEs were responsible for a staggering 90.3% of all litigation in 2025.
The University-Corporate Alliance is the hidden engine. Tsinghua University has surpassed MIT and Harvard in global AI output. Samsung and Huawei maintain the most institutionally embedded partnerships, sitting at the heart of their respective national AI and clean energy ecosystems.
Quantifying the patent landscape through multi-dimensional analysis of companies, countries, and technology sectors.
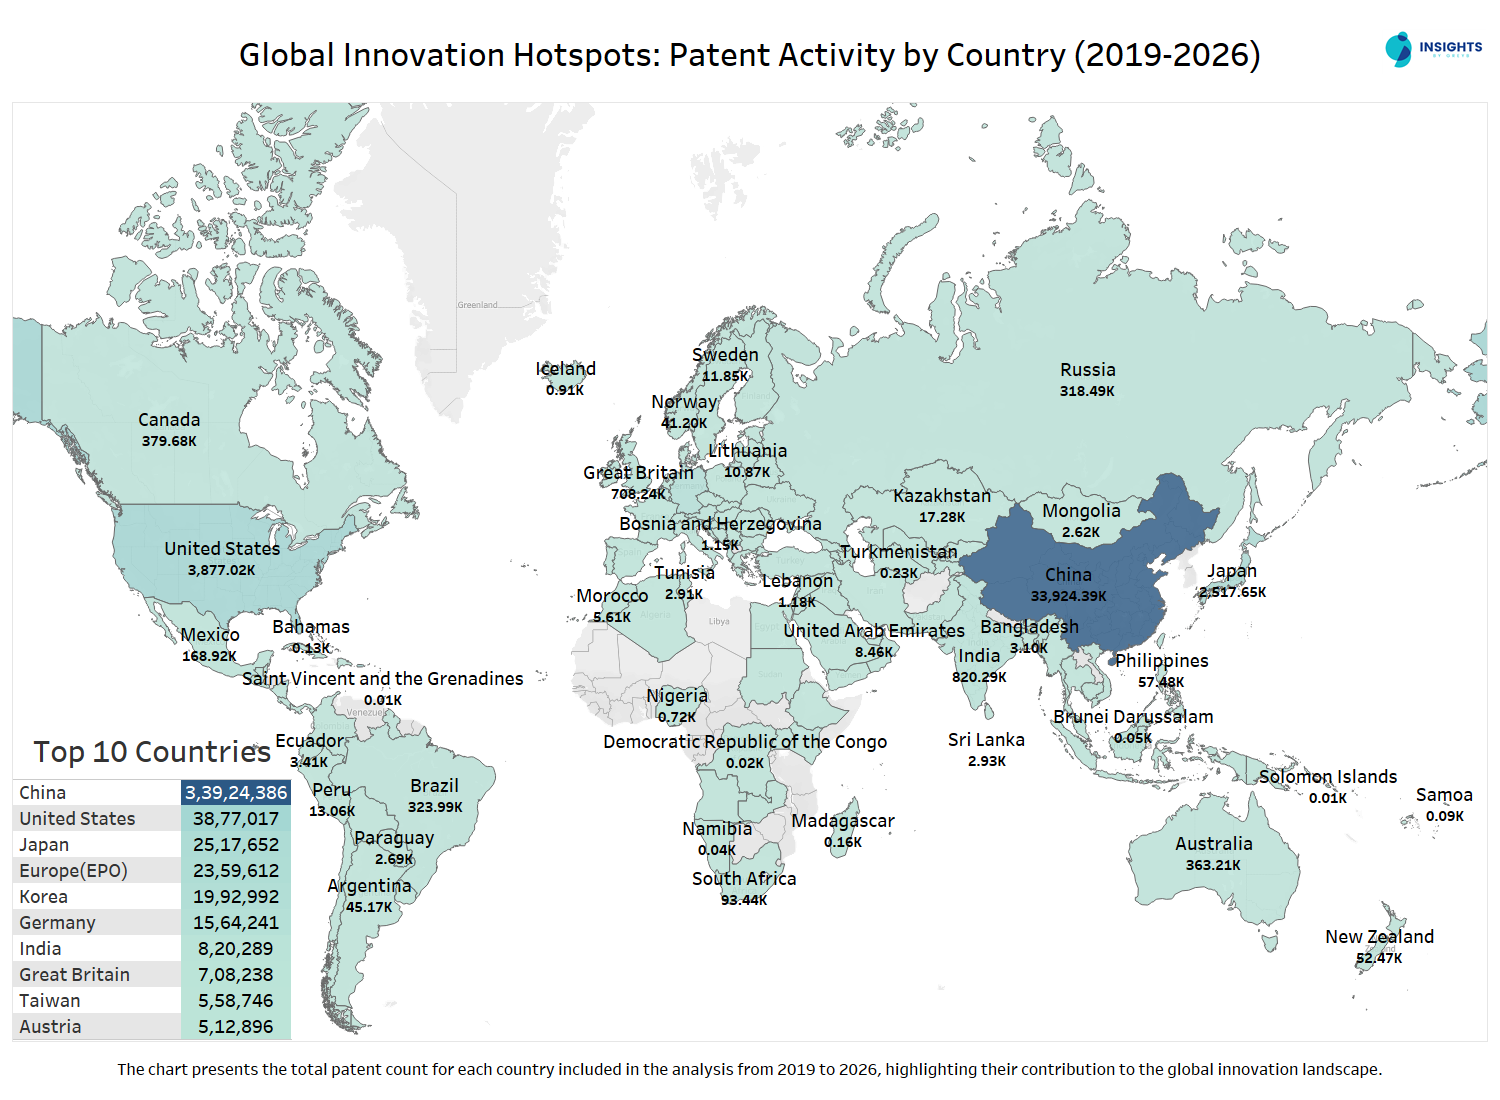
The global patent landscape now has multiple centers of innovation rather than a single dominant leader.
China leads by scale, filing around 1.8 million patent applications in 2024-nearly half the global total and more than three times that of the United States.
However, 96% of these filings are domestic, indicating a focus on local protection rather than global expansion. Only a small group of Chinese firms actively pursue international patents.
The United States ranks second in volume but continues to lead in quality, with strong influence in high-impact innovations and foundational technologies. Europe, along with Germany, the UK, and South Korea, maintains a stable and competitive presence.
India is emerging as a key growth driver. With over 820K patents filed between 2019 and 2026, it has recorded six consecutive years of double-digit growth-the only major economy to do so.
Notably, domestic participation has surged, with resident filings rising from 28% in 2014 to over 60% in 2024, reflecting a maturing innovation ecosystem.
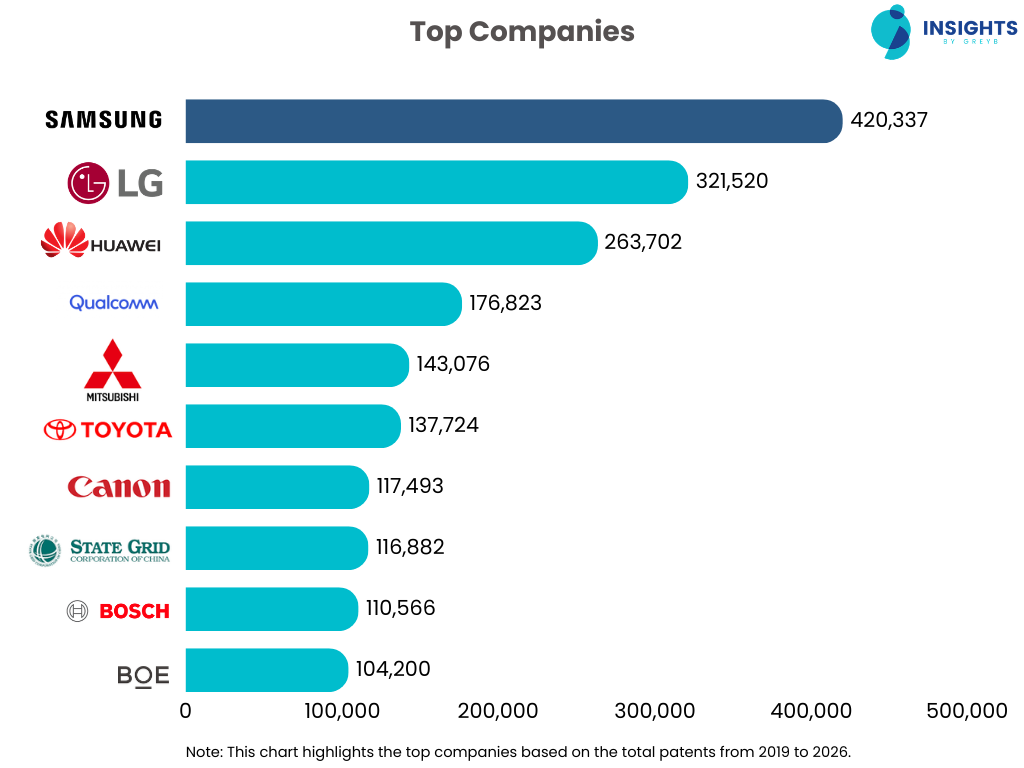
This chart highlights the top companies shaping global patent activity and their strategic focus.
Samsung leads with over 420K patents (2019–2026), driven by AI, semiconductors, and strong R&D investment. LG and Huawei follow with distinct approaches-LG focuses on clean energy and consumer electronics, while Huawei continues aggressive filings in 5G and emerging 6G technologies despite geopolitical challenges.
Qualcomm stands out for its focused, high-value patents in connectivity. Meanwhile, Mitsubishi and Toyota reflect a major shift: the automotive sector is now highly patent-intensive, especially in electric, hybrid, and hydrogen technologies aligned with sustainability goals.
State Grid of China, though lower in total patents, is among the most active recent filers.
Overall, patent strategy is not just about volume but also where companies file, revealing their commercial priorities and long-term competitive positioning.
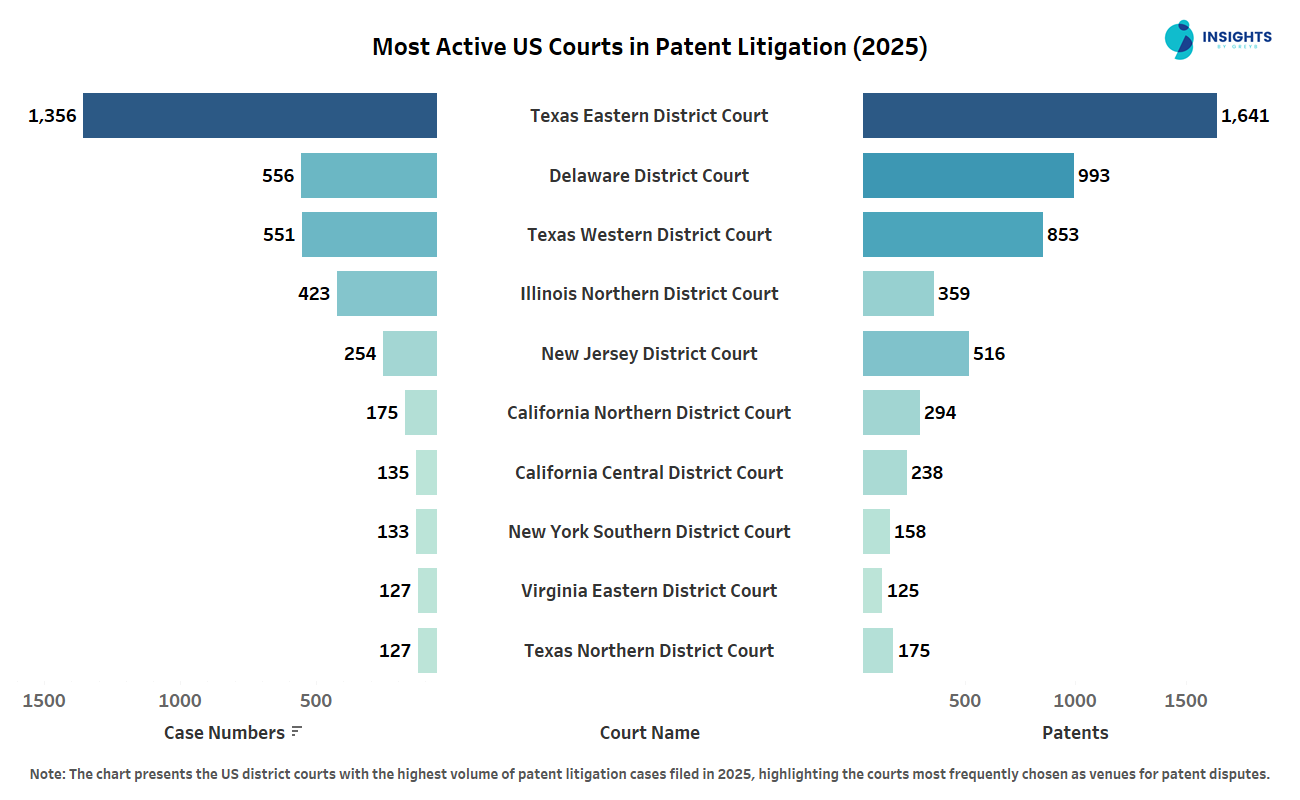
The 2025 court data highlights not just case volume but also dispute complexity, measured by patents per case.
The Eastern District of Texas (EDTX) leads with 1,356 cases and 1,641 patents (1.21 per case), indicating simpler disputes, often driven by single-patent NPE claims. In contrast, Delaware handled fewer cases (556) but more patents per case (1.79), reflecting complex, multi-patent disputes between operating companies.
The Western District of Texas falls in between, handling a mix of both dispute types. Meanwhile, Northern District of Illinois and New Jersey see fewer but more complex cases with higher commercial stakes.
Overall, US patent litigation shows a two-tier system: high-volume, lower-complexity cases in EDTX and WDTX, and lower-volume, higher-complexity disputes in Delaware and similar courts.
This chart reveals how global R&D is now centered around two major forces: artificial intelligence and the energy transition.
AI Computing Systems lead the landscape, with generative AI patents rising over 800% (2014–2023). China dominates with over 38,000 patents-six times more than the US-making AI a defining driver of innovation.
Low-Carbon Energy Systems follow, reflecting strong policy push. Green patent filings grew ~20% in 2025, with China leading low-carbon filings.
Next are Sustainable Manufacturing, Pharmaceuticals, and Digital Data-key pillars of manufacturing, healthcare, and digital infrastructure.
Other important areas include drug discovery, communication systems, wireless networks, climate technologies, and materials science.
Overall, global innovation is focused on intelligence, sustainability, and health, supported by strong communication networks.
We go beyond simple patent counts. Our 2026 report maps the complexity of 150+ countries and 7 years of data.
150+ countries, including East Asia, analyzed as a single, interconnected innovation ecosystem.
Year-on-year insight evolution so you can track what’s moved, accelerated, and faded since 2025.
Dedicated analysis of non-practicing entity activity, key players, and what it means for your IP strategy.
Identify which countries and companies own the most critical terrain across every major technology class.
Insights into university-corporate alliances producing the patents that will define the next product cycle.
Equipping teams with the data needed to navigate competitive landscapes and identify innovation hotspots.
A comprehensive patent landscape based on 5 years patent innovation study over the 55+ Million patents worldwide.
Let’s compare the innovation shift with 2026 GGPILR report.
Generative AI patent publications surged by over 800% between 2014 and 2023, with WIPO expecting further acceleration.
China’s total social investment in R&D exceeded 3.6 trillion yuan in 2024, a research economy larger than the entire GDP of many G20 nations.
Despite China’s volume dominance, American AI patents are cited nearly seven times more often on average than Chinese AI patents.
Download the 2026 Executive Summary and get instant access to the complete 100+ page leadership report.
We provide end-to-end intelligence and scouting services to help you navigate the complex innovation landscape and stay ahead of the competition.
Ready to explore a custom project?
Our analysts are ready to help you build your innovation roadmap.