Scientific Games Corporation has a total of 6922 patents globally, out of which 3941 have been granted. Of these 6922 patents, more than 33% patents are active. The United States of America is where Scientific Games Corporation has filed the maximum number of patents, followed by Australia and Europe. Parallelly, the United States of America seems to be the main focused R&D center and also is the origin country of Scientific Games Corporation.
Scientific Games Corporation now known as Light & Wonder Inc was founded in 1973. Scientific Games provides lottery games and wagering systems. The Company offers instant game product management, lottery systems, gaming terminals, licensed properties, marketing research, and analytics services. Scientific Games International serves clients worldwide. As of October 2022, Scientific Games Corporation has a market cap of $5.07 Billion.
Do read about some of the most popular patents of Scientific Games Corporation which have been covered by us in this article and also you can find Scientific Games Corporation patents information, the worldwide patent filing activity and its patent filing trend over the years, and many other stats over Scientific Games Corporation patent portfolio.
How many patents does the Founder and CEO of Scientific Games Corporation have?
The Founder John Koza has 69 patents and the CEO Barry Cottle has 0 patents.
How many patents does Scientific Games Corporation have?
Scientific Games Corporation has a total of 6922 patents globally. These patents belong to 2550 unique patent families. Out of 6922 patents, 2308 patents are active.
How Many Patents did Scientific Games Corporation File Every Year?
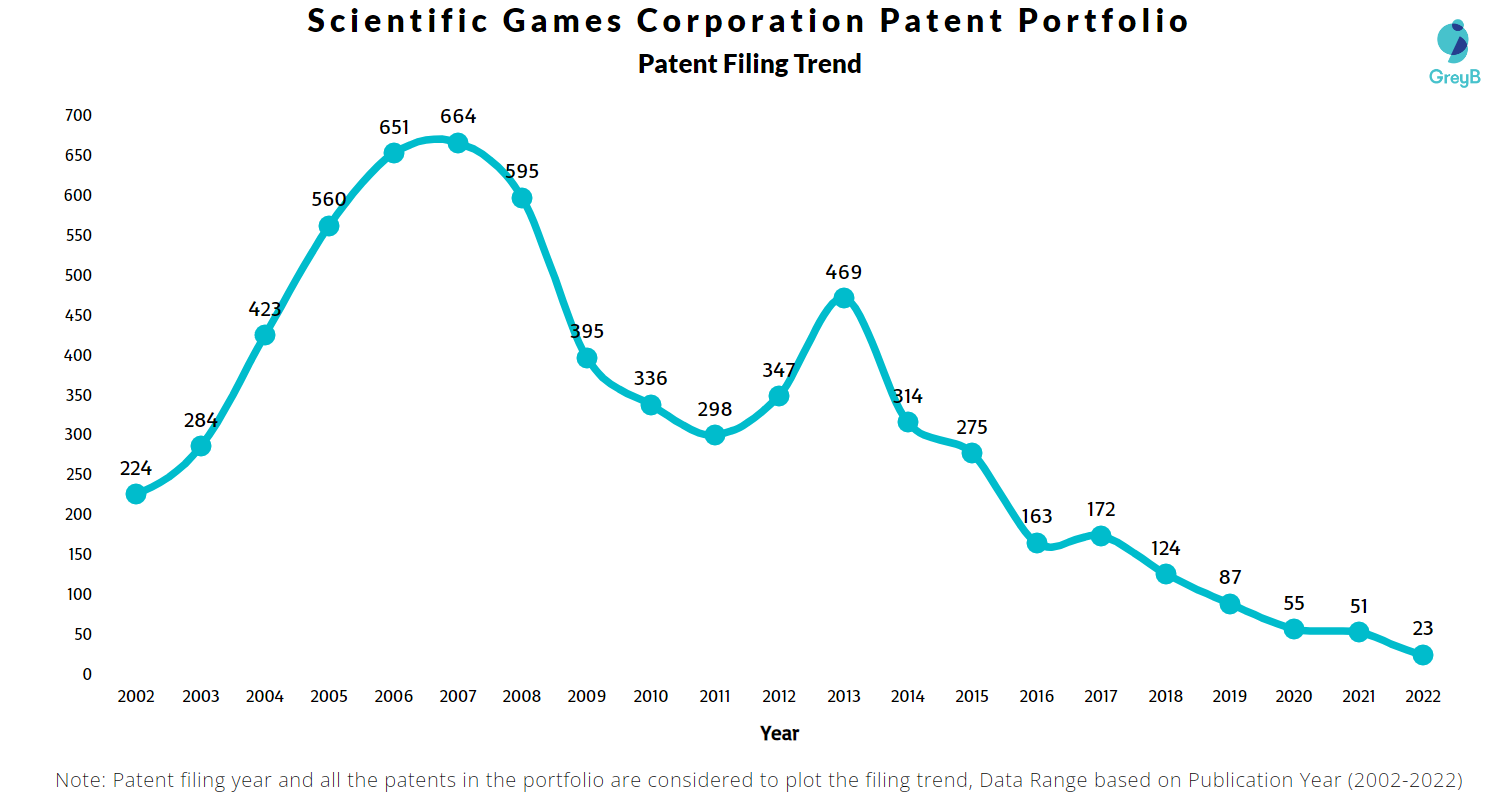
Are you wondering why there is a drop in patent filing for the last two years? It is because a patent application can take up to 18 months to get published. Certainly, it doesn’t suggest a decrease in the patent filing.
| Year of Patents Filing or Grant | Scientific Games Corporation Applications Filed | Scientific Games Corporation Patents Granted |
| 2011 | 298 | 242 |
| 2012 | 347 | 437 |
| 2013 | 469 | 432 |
| 2014 | 314 | 362 |
| 2015 | 275 | 323 |
| 2016 | 163 | 292 |
| 2017 | 172 | 236 |
| 2018 | 124 | 158 |
| 2019 | 87 | 171 |
| 2020 | 55 | 115 |
| 2021 | 51 | 67 |
| 2022 | 23 | 47 |
How many Scientific Games Corporation patents are Alive/Dead?
Worldwide Patents

How Many Patents did Scientific Games Corporation File in Different Countries?

Countries in which Scientific Games Corporation Filed Patents
| Country | Patents |
| United States Of America | 3807 |
| Australia | 608 |
| Europe | 397 |
| Canada | 313 |
| South Africa | 138 |
| United Kingdom | 131 |
| China | 122 |
| Macao | 97 |
| Germany | 86 |
| Spain | 43 |
| Mexico | 43 |
| Austria | 32 |
| Singapore | 32 |
| New Zealand | 25 |
| Japan | 25 |
| Korea (South) | 23 |
| Norway | 20 |
| Taiwan | 20 |
| Philippines | 20 |
| Malaysia | 17 |
| Portugal | 11 |
| Argentina | 9 |
| Chile | 8 |
| Russia | 6 |
| Brazil | 4 |
| Hong Kong (S.A.R.) | 3 |
| Israel | 2 |
| India | 2 |
| Denmark | 2 |
| Poland | 2 |
| Czech Republic | 1 |
| Italy | 1 |
| Finland | 1 |
| Peru | 1 |
| Cyprus | 1 |
| Romania | 1 |
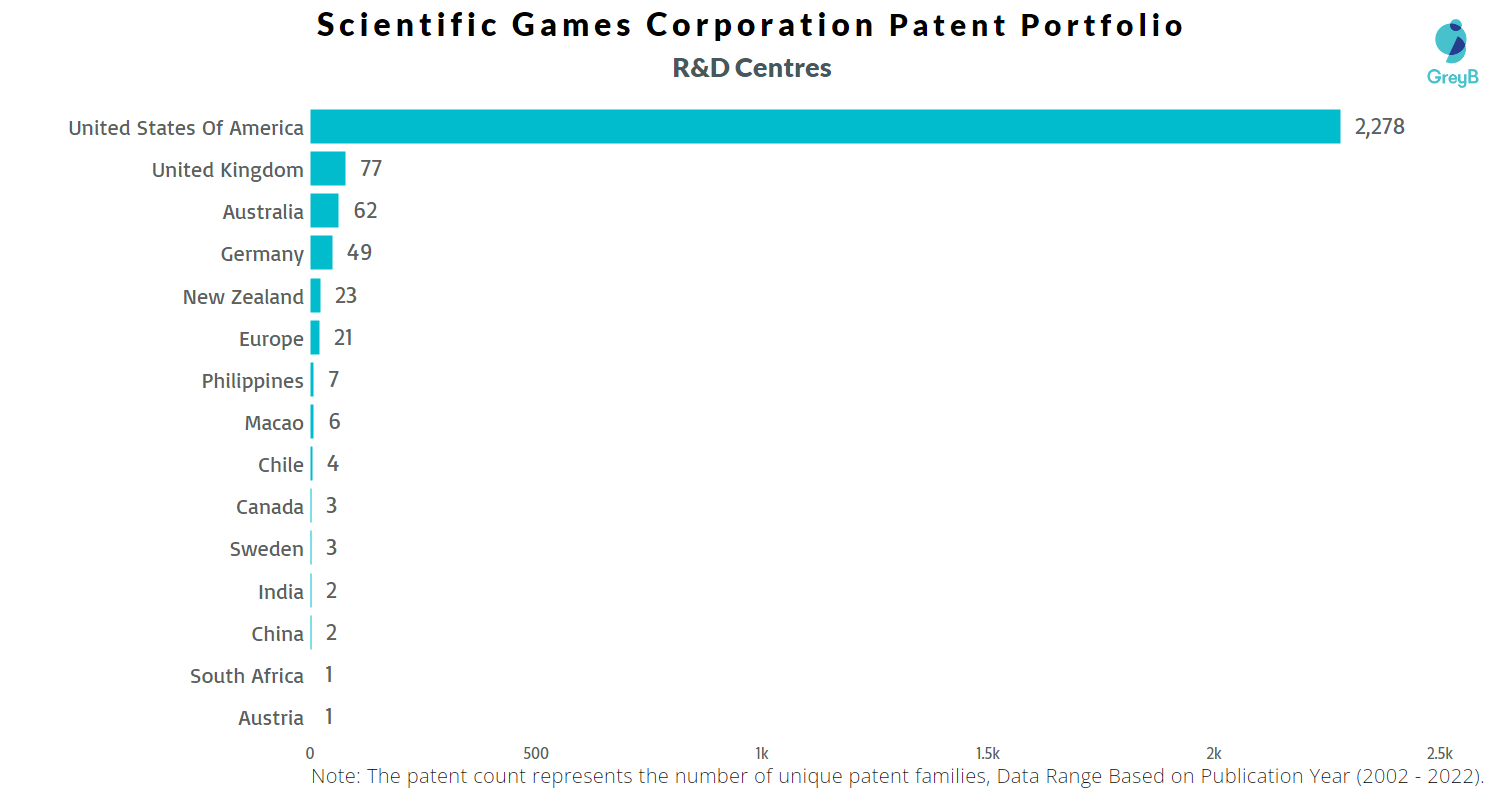
Where are Research Centers of Scientific Games Corporation Patents Located?
10 Best Scientific Games Corporation Patents
US6347996B1 is the most popular patent in the Scientific Games Corporation portfolio. It has received 1347 citations so far from companies like IGT, Aruze Corp and Kabam.
Below is the list of 10 most cited patents of Scientific Games Corporation:
| Publication Number | Citation Count |
| US6347996B1 | 1347 |
| US6517433B2 | 1011 |
| US6537150B1 | 840 |
| US6364766B1 | 823 |
| US6443837B1 | 680 |
| US6749510B2 | 669 |
| US6517432B1 | 629 |
| US6346044B1 | 609 |
| US6561904B2 | 602 |
| US6398644B1 | 601 |
Which Companies are using Scientific Games Corporation Patents to Advance their Research?
If patents or patents from a particular technology area of a company receive a lot of citations, it implies that the technology is being followed and incrementally innovated by the citing companies. It also indicates that citing companies are working on similar and closely related technologies.
The top citing companies in the Scientific Games Corporation patent portfolio are UBS, Universal Entertainment Corporation and Aruze Gaming America Inc.
List of the top forward citing Companies –
| Company | Number of Patents |
| Ubs Ag | 202 |
| Universal Entertainment Corporation | 152 |
| Aruze Gaming America Inc | 104 |
| Jefferies Finance Llc | 85 |
| Aristocrat Technologies Australia Pty Limited | 85 |
| Konami Gaming Inc | 74 |
| Microsoft | 59 |
| Spv 47 Llc | 57 |
| Ags Llc | 47 |
| IBM | 43 |
Count of 102 and 103 Type Rejections based on Scientific Games Corporation Patents
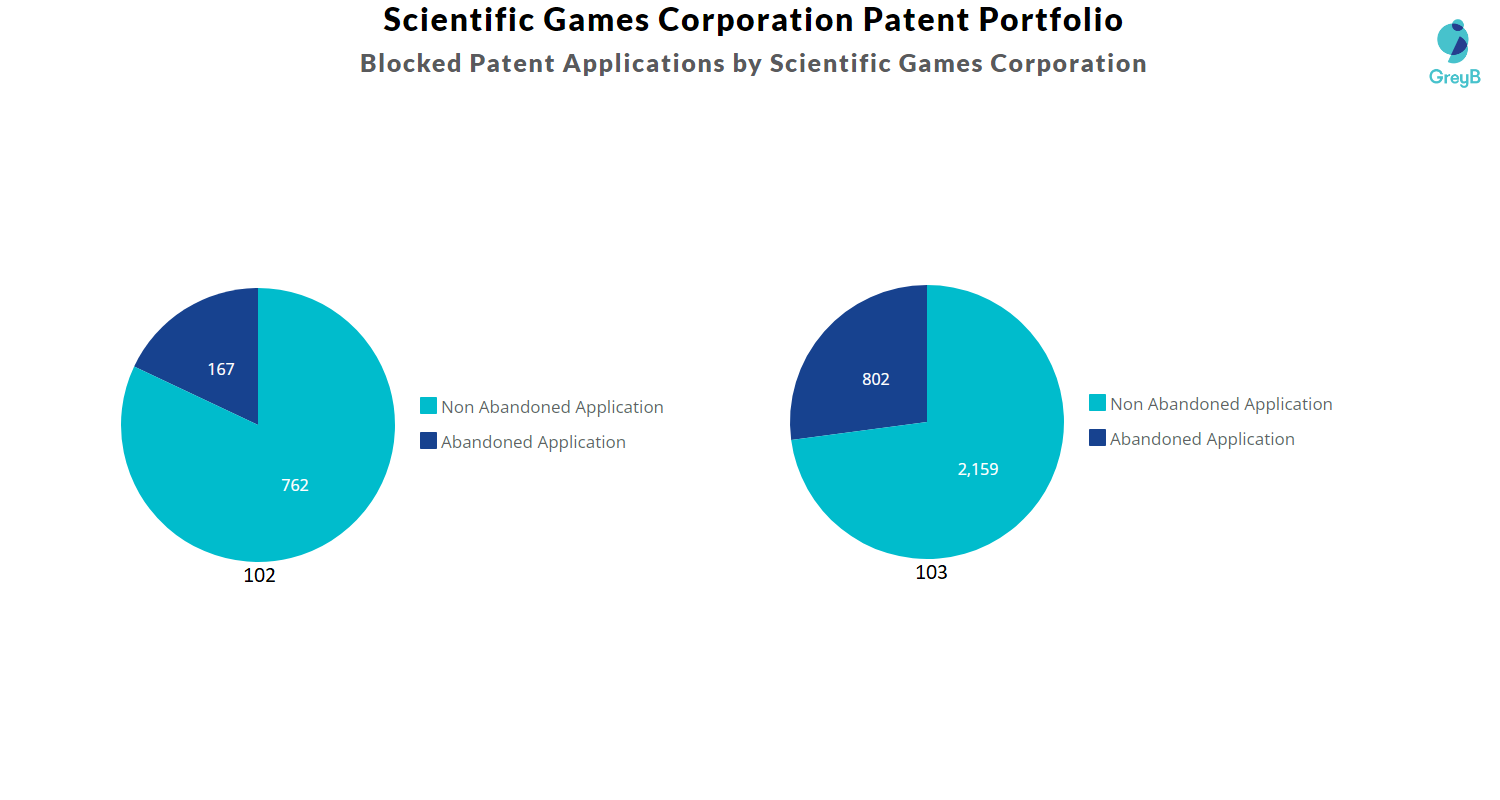
Top Scientific Games Corporation Patents used in Rejecting Most Patent Applications
| Patent Number | Count of Rejected Applications |
| US8308562B2 | 35 |
| US8393948B2 | 33 |
| US8840462B2 | 30 |
| US20040266533A1 | 30 |
| US8758102B2 | 23 |
| US8972299B2 | 21 |
| US10235827B2 | 21 |
| US8147316B2 | 20 |
| US8360862B2 | 17 |
| US8282489B2 | 17 |
| US9235956B2 | 15 |
| US8678902B2 | 15 |
| US8282490B2 | 14 |
| US6582301B2 | 14 |
| US8337300B2 | 13 |
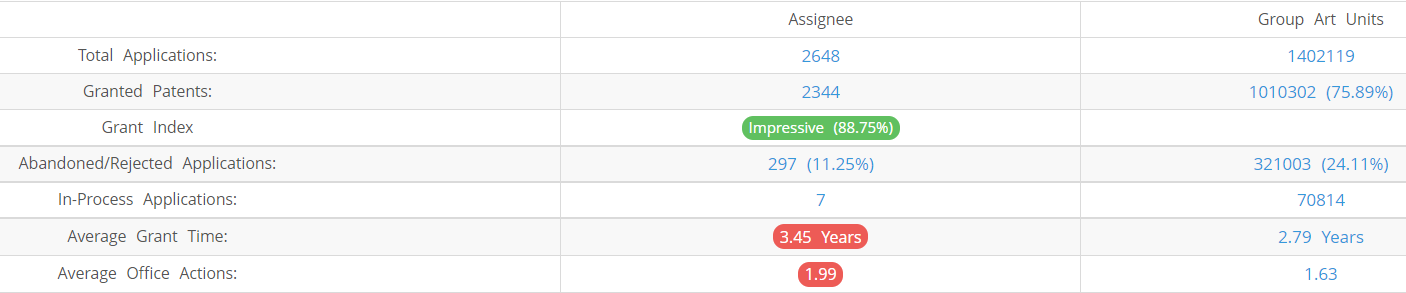
What Percentage of Scientific Games Corporation US Patent Applications were Granted?
Scientific Games Corporation (Excluding its subsidiaries) has filed 2648 patent applications at USPTO so far (Excluding Design and PCT applications). Out of these 2344 have been granted leading to a grant rate of 88.7%.
Below are the key stats of Scientific Games Corporation’s patent prosecution at the USPTO.
Which Law Firms Filed Most US Patents for Scientific Games Corporation?
| Law Firm | Total Applications | Success Rate |
| Nixon Peabody Llp | 960 | 90.20% |
| Sg Gaming Inc | 684 | 87.86% |
| Seed Ip Law Group Llp | 347 | 98.57% |
| Traskbritt Pc | 330 | 84.55% |
| Dority & Manning Pa | 235 | 83.19% |
| Miller Matthias & Hull Llp | 15 | 46.67% |
| Weide & Miller Ltd | 7 | 57.14% |
| Duane Morris Llp | 5 | 20.00% |
| Michael B Mcmurry | 4 | 100.00% |
| Watov & Kipnes Pc | 4 | 100.00% |