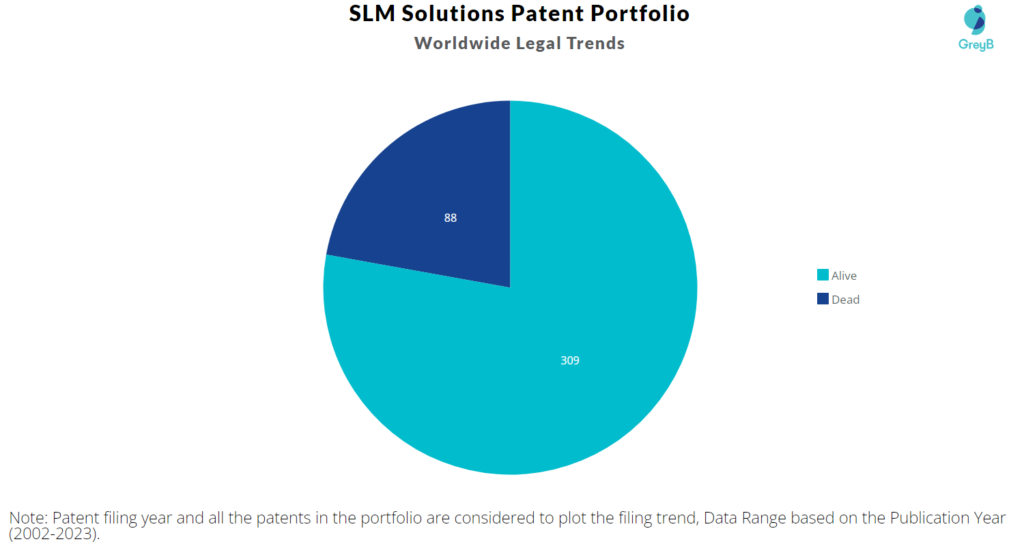
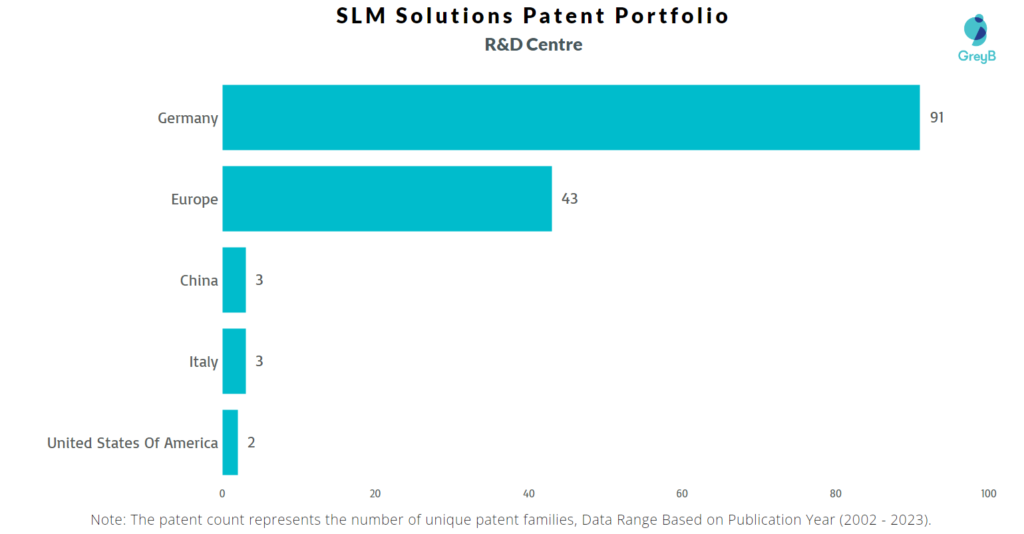
SLM Solutions has a total of 397 patents globally, out of which 223 have been granted. Of these 397 patents, more than 77% patents are active. Europe is where SLM Solutions has filed the maximum number of patents, followed by the United States of America and Germany. Parallelly, Germany seems to be the main focused R&D centre and also is the origin country of SLM Solutions.
SLM Solutions was founded in the year 2006. The Company provides 3-D printing technology. The Company supplies metal-based additive manufacturing technologies for use by the aerospace, energy, automotive and healthcare industries. SLM Solutions offers its products and services around the world. As of March 2023, the market cap of SLM Solutions is $525.72 Million.
Do read about some of the most popular patents of SLM Solutions which have been covered by us in this article and also you can find SLM Solutions patents information, the worldwide patent filing activity and its patent filing trend over the years, and many other stats over SLM Solutions patent portfolio.
How many patents does the CEO of SLM Solutions have?
The CEO Sam O’Leary has 0 patents.
How many patents does SLM Solutions have?
SLM Solutions has a total of 397 patents globally. These patents belong to 143 unique patent families. Out of 397 patents, 309 patents are active.
How Many Patents did SLM Solutions File Every Year?
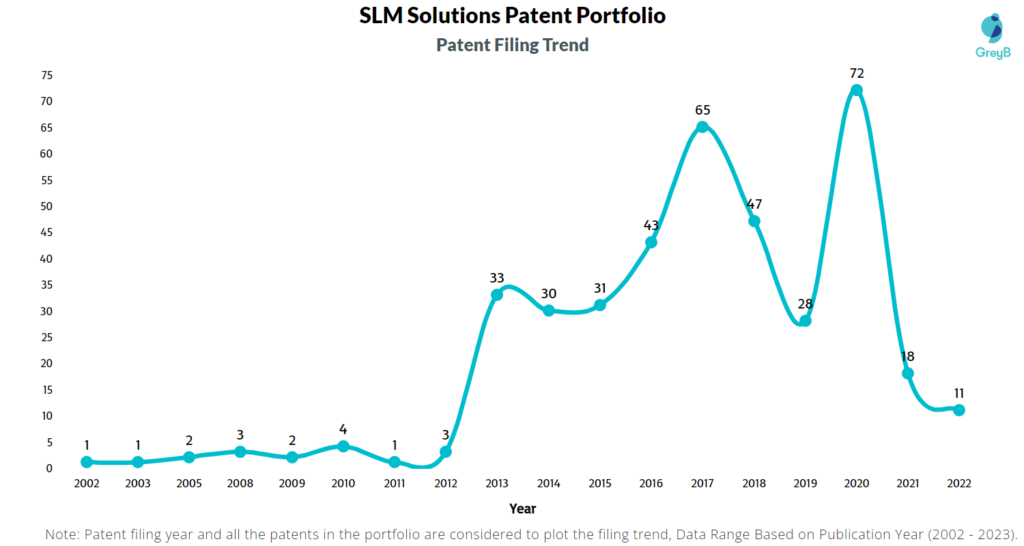
Are you wondering why there is a drop in patent filing for the last two years? It is because a patent application can take up to 18 months to get published. Certainly, it doesn’t suggest a decrease in the patent filing.
| Year of Patents Filing or Grant | SLM Solutions Applications Filed | SLM Solutions Patents Granted |
| 2023 | – | 7 |
| 2022 | 11 | 27 |
| 2021 | 18 | 41 |
| 2020 | 72 | 30 |
| 2019 | 28 | 42 |
| 2018 | 47 | 37 |
| 2017 | 65 | 18 |
| 2016 | 43 | 8 |
| 2015 | 31 | 4 |
| 2014 | 30 | 6 |
| 2013 | 33 | – |
| 2012 | 3 | 1 |
How many SLM Solutions patents are Alive/Dead?
How Many Patents did SLM Solutions File in Different Countries?
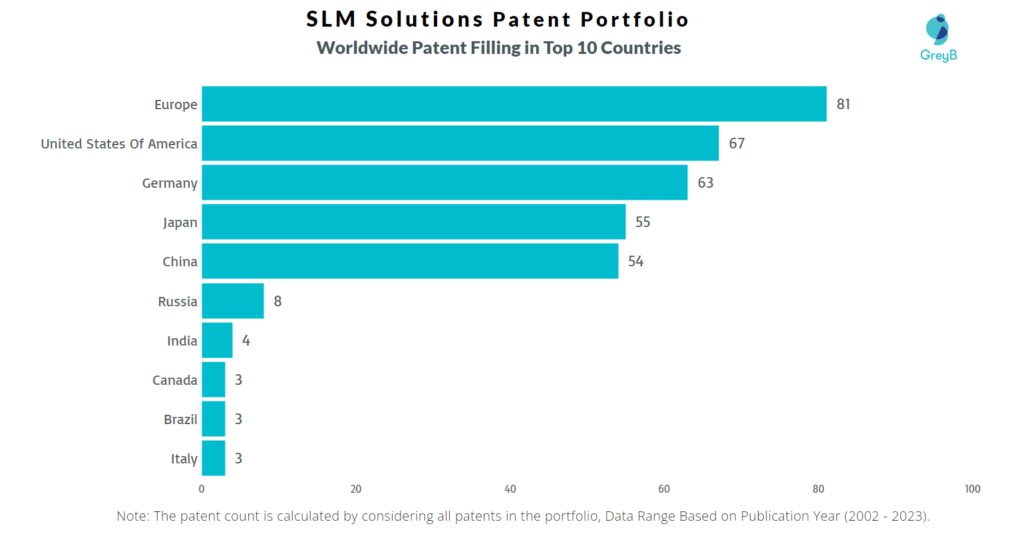
Countries in which SLM Solutions Filed Patents
| Country | Patents |
| Europe | 81 |
| United States Of America | 67 |
| Germany | 63 |
| Japan | 55 |
| China | 54 |
| Russia | 8 |
| India | 4 |
| Canada | 3 |
| Brazil | 3 |
| Italy | 3 |
| Spain | 3 |
| Australia | 1 |
| Austria | 1 |
Where are Research Centres of SLM Solutions Patents Located?
10 Best SLM Solutions Patents
DE202013009787U1 is the most popular patent in the SLM Solutions portfolio. It has received 89 citations so far from companies like Velo3D, General Electric and One Click Metal.
Below is the list of 10 most cited patents of SLM Solutions:
| Publication Number | Citation Count |
| DE202013009787U1 | 89 |
| EP2878402A1 | 61 |
| US20160059310A1 | 51 |
| DE10236907A1 | 49 |
| EP3147047A1 | 43 |
| US9221100B2 | 38 |
| US9527246B2 | 35 |
| EP2399695A1 | 35 |
| EP2335848B1 | 32 |
| EP2875897B1 | 31 |
How many inventions of other companies were rejected due to SLM Solutions patents?
The statistics below share strategic R&D insights. It tells the companies that were trying to protect inventions similar to SLM Solutions invention. They couldn’t because SLM Solutions had protected those before them.
Examiners at the USPTO referred 25 SLM Solutions patents in 101 rejections (35 USC § 102 or 35 USC § 103 types).
The top citing companies in the SLM Solutions patent portfolio are General Electric, Concept Laser and Hewlett-Packard.
List of the Companies whose Patents were rejected citing SLM Solutions –
| Company | Number of Patent Applications that faced Rejection Citing SLM Solutions Patents | Number of Rejections (102 & 103) |
| General Electric | 13 | 25 |
| Concept Laser | 8 | 20 |
| Hewlett-Packard | 4 | 5 |
| Velo3D | 4 | 6 |
| Canon | 2 | 2 |
| Arcam | 2 | 5 |
| Mtu Aero Engines | 2 | 5 |
| Renishaw | 1 | 1 |
| Hsbc Bank | 1 | 1 |
| Chongqing Institute Of Green And Intelligent Technology | 1 | 2 |
Count of 102 and 103 Type Rejections based on SLM Solutions Patents
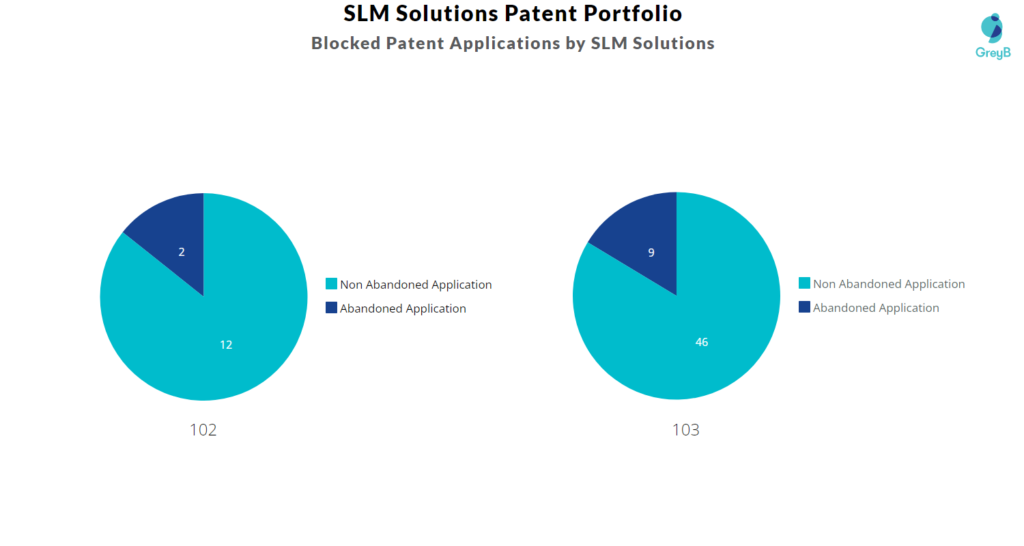
Top SLM Solutions Patents used in Rejecting Most Patent Applications
| Patent Number | Count of Rejected Applications |
| US9221100B2 | 8 |
| US9931789B2 | 6 |
| US20160059310A1 | 5 |
| US10093123B2 | 4 |
| US10335854B2 | 4 |
| US9527246B2 | 3 |
| US10682701B2 | 3 |
| US20180043621A1 | 2 |
| US10086481B2 | 2 |
| US10787352B2 | 2 |
| US9878497B2 | 2 |
| US9903762B2 | 2 |
| US10046520B2 | 2 |
| US11052610B2 | 2 |
| US20160059309A1 | 2 |
What Percentage of SLM Solutions US Patent Applications were Granted?
SLM Solutions (Excluding its subsidiaries) has filed 65 patent applications at USPTO so far (Excluding Design and PCT applications). Out of these 35 have been granted leading to a grant rate of 77.78%.
Below are the key stats of SLM Solutions patent prosecution at the USPTO.

Which Law Firms Filed Most US Patents for SLM Solutions?
| Law Firm | Total Applications | Success Rate |
| Taft Stettinius & Hollister | 33 | 81.25% |
| Thomas F Bergert | 26 | 62.50% |
| Carter Deluca & Farrell | 2 | 100.00% |
| Tarolli Sundheim Covell & Tummino | 2 | 100.00% |
| Krieg Devault | 1 | 0.00% |
| Quarles & Brady | 1 | 0% |
What are SLM Solutions key innovation segments?
What Technologies are Covered by SLM Solutions?
The chart below distributes patents filed by
