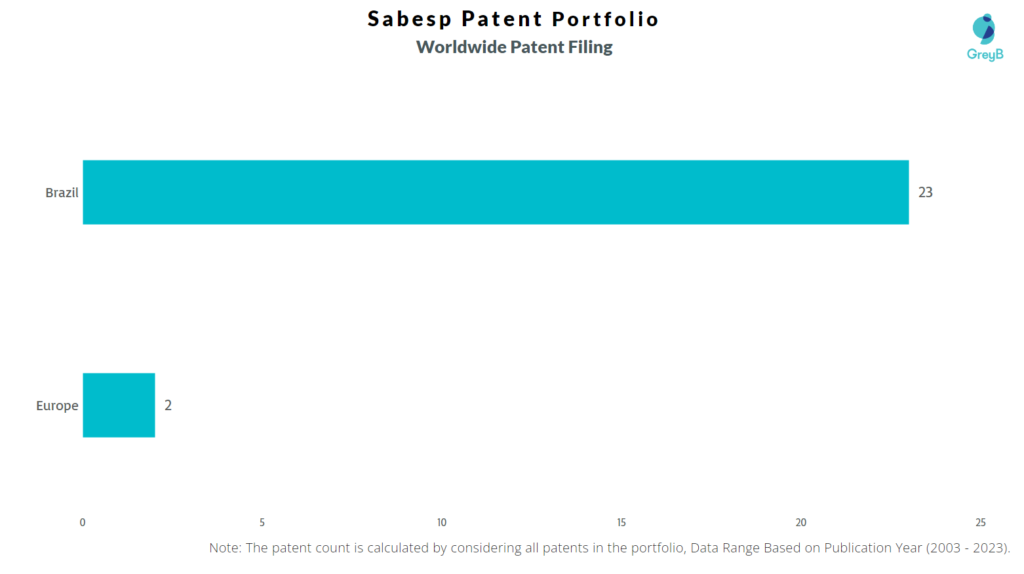
Sabesp has a total of 28 patents globally, out of which 6 have been granted. Of these 28 patents, more than 60% patents are active. Brazil is where Sabesp has filed the maximum number of patents, followed by Europe (EPO), it has generated an annual revenue of $4.26 billion in the year 2022. Parallelly, Brazil seems to be the main focused R&D center of Sabesp.
Sabesp was founded in the year 1973. Company is a Brazilian water and waste management company owned by the state of São Paulo. As of June 2023, Sabesp has a market cap of $7.48 Billion.
Do read about some of the most popular patents of Sabesp which have been covered by us in this article and also you can find Sabesp patents information, the worldwide patent filing activity and its patent filing trend over the years, and many other stats over Sabesp patent portfolio.
How many patents does Sabesp have?
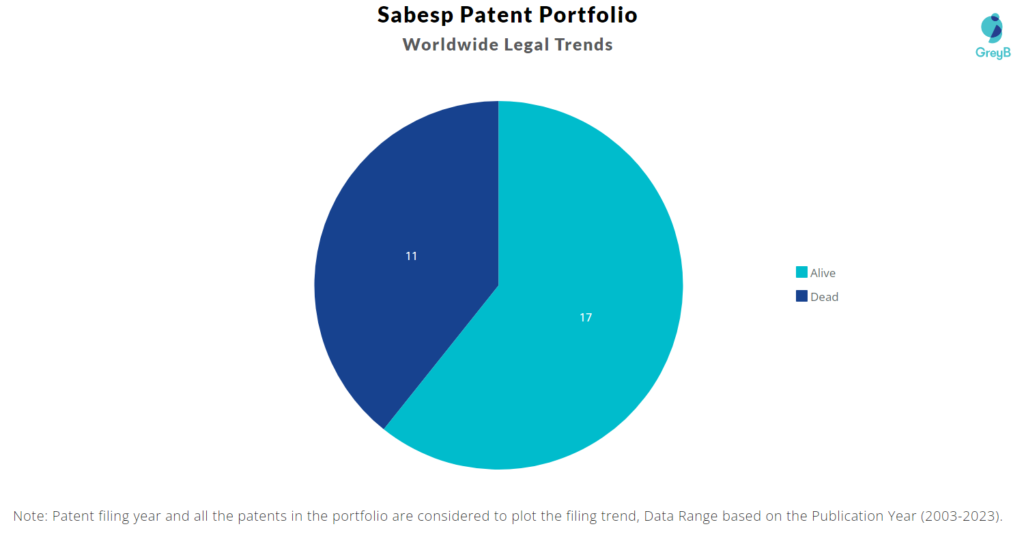
Sabesp has a total of 28 patents globally. These patents belong to 23 unique patent families. Out of 28 patents, 17 patents are active.
How Many Patents did Sabesp File Every Year?
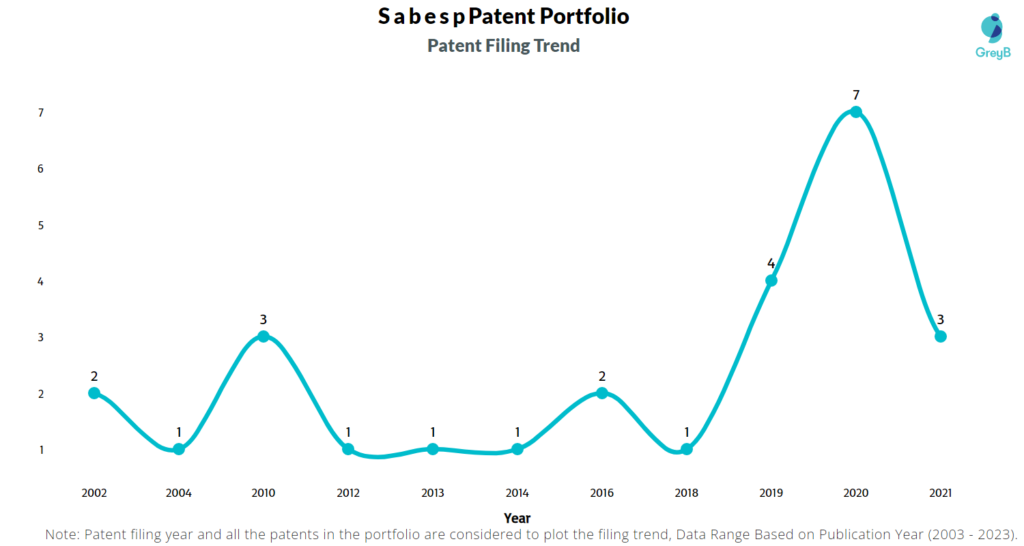
Are you wondering why there is a drop in patent filing for the last two years? It is because a patent application can take up to 18 months to get published. Certainly, it doesn’t suggest a decrease in the patent filing.
| Year of Patents Filing or Grant | Sabesp Applications Filed | Sabesp Patents Granted |
| 2022 | – | 1 |
| 2021 | 3 | 1 |
| 2020 | 7 | – |
| 2019 | 4 | – |
| 2018 | 1 | – |
| 2017 | – | 1 |
| 2016 | 2 | – |
| 2015 | – | – |
| 2014 | 1 | – |
| 2013 | 1 | – |
| 2012 | 1 | – |
| 2011 | – | – |
How many Sabesp patents are Alive/Dead?
Worldwide Patents
How Many Patents did Sabesp File in Different Countries?
Where are Research Centers of Sabesp Patents Located?
The R&D Centres of patents filed by Sabesp are in Brazil.
List of Sabesp’s Patents
| Sabesp Patents | Title |
| EP4083970A4 | Method And Simulation Bench For Leakage Signals In Lines |
| EP4083821A1 | Method And System For Analyzing And Providing A Quality Index For A Noise Correlator |
| WO2021184088A1 | Modular System For Treating Sanitary Sludge And Process Using Said System |
| WO2021127754A1 | Method And Simulation Bench For Leakage Signals In Lines |
| WO2021127755A1 | Method And System For Analyzing And Providing A Quality Index For A Noise Correlator |
| BR102016017191B1 | Sensor For Measurements Of Chemical Quantities, Manufacturing Process Of Sensor Devices And Use Of The Said Sensor For Measuring The Ph Of Water In Microfluid Systems |
| BR102021020140A2 | System For Fluid Turbidity Analysis And Method For Fluid Turbidity Analysis |
| BR102021006959A2 | Water Collection Device, Process And Device Installation Kit And Water Sample Collection Method |
| BR102021005538A2 | Three-Phase Separator For Ascending Flow Anaerobic Reactors And Sludge Blanket |
| BR102016025684B1 | Bubble Removal System, Autonomous Microlaboratory And Use Of Autonomous Microlaboratory For Water Quality Monitoring |
| BR202020017973U2 | Box For Hydrometers Installation |
| BR102020005478A2 | Modular Slean Sludge Treatment System And Process Using Such System |
| BR102019028015A2 | Analysis Method And System And Quality Index Supply For Noise Correlation |
| BR102019028022A2 | Automatic Frequency Band Selection Process And System In Noise Correlation For Leak Detection |
| BR102019028020A2 | System And Process For Estimating Speed And Leak Noise Propagation Delay In At Least One Pipeline |
| BR102019028026A2 | Pipeline Leakage Signals Simulation Method And Bench |
| BR102012022273B1 | Rotating Device For Washing Water Tanks Attached To A Truck, With High Pressure Hydroblast System |
| BR102018075052A2 | Box For Hydrometers Installation |
| BR102014019693A2 | Digital Leak Search System |
| BRMU9002495Y1 | Auxiliary Device For Removal Of Supernatants In Sewage Treatment |
| BR202013005932U2 | Portable Metrological Test Equipment |
| BRMU9002515U2 | Compact, Mobile And Autonomous Unit For Odor Control By Biofilter |
| BRPI1005719A2 | Mobile Bench For Field Calibration Of Hydrometers |
| BRMU8202514Y1 | Construction Layout In Hydraulic Building Simulator For Teaching Purposes. |
| BRMU8400296U2 | Measurement Unit |
| BRPI9801819B1 | Motorized Drive For Automatic Correction Of Chemical Dosage In Conventional Gravity Dosage Dosers |
| BRPI0205354A2 | Tap Remover |
| BRPI0101205A2 | Mobile Unit For Metrological Verification Of Hydrometers In The Field |
What are Sabesp’s key innovation segments?
What Technologies are Covered by Sabesp?
The chart below distributes patents filed by Sabesp
