Applied Materials was founded in 1967 by Michael A McNeilly and is doing business in the Semiconductors industry. The Company offers a wide range of Semiconductor Manufacturing Equipment, Materials Engineering, Flat Panel Display Manufacturing Equipment, and Global Services for the industries served. As of November 2021, Applied Materials has a market cap of $141.10 Billion.
Applied Materials has a total of 57742 patents globally, out of which 28130 have been granted. Among these 57742 patents, more than 45% of patents are active. The USA is where Applied Materials has filed the maximum number of patents, followed by Taiwan and Korea and it also seems reasonable as the biggest market for Applied Materials in the USA. The USA seems to be the main focused R&D center and is also the origin country of Applied Materials.
Do read about some of the most popular patents of Applied Materials which have been covered by us in this article and also you can find Applied Materials patents information, the worldwide patent filing activity and its patent filing trend over the years, and many other stats over Applied Materials patent portfolio.
How many patents does Applied Materials have?
Applied Materials has a total of 57742 patents globally. These patents belong to 15299 unique patent families. Out of 57742 patents, 26111 patents are active.
How many Applied Materials patents are Alive/Dead?
Worldwide Patents

Patent Families

How Many Patents did Applied Materials File Every Year?
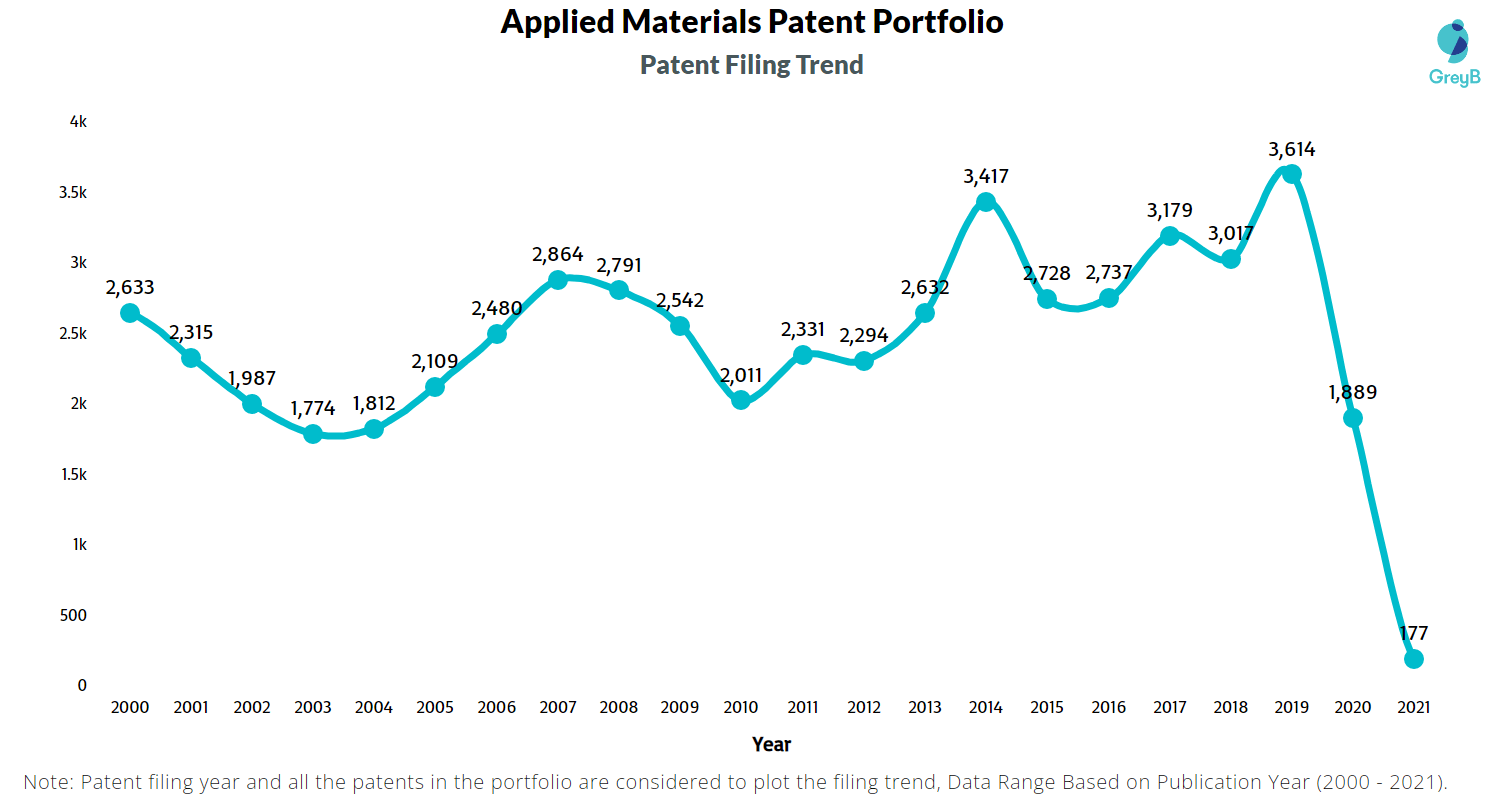
Are you wondering why there is a drop in patent filing for the last two years? It is because a patent application can take up to 18 months to get published. Certainly, it doesn’t suggest a decrease in the patent filing.
| Year of Patents Filing or Grant | Applied Materials Applications Filed | Applied Materials Patents Granted |
| 2011 | 2331 | 1217 |
| 2012 | 2294 | 1303 |
| 2013 | 2632 | 1259 |
| 2014 | 3417 | 1302 |
| 2015 | 2728 | 1322 |
| 2016 | 2737 | 1632 |
| 2017 | 3179 | 1722 |
| 2018 | 3017 | 1754 |
| 2019 | 3614 | 1994 |
| 2020 | 1889 | 2206 |
| 2021 | 177 | 1528 |
How Many Patents did Applied Materials File in Different Countries?
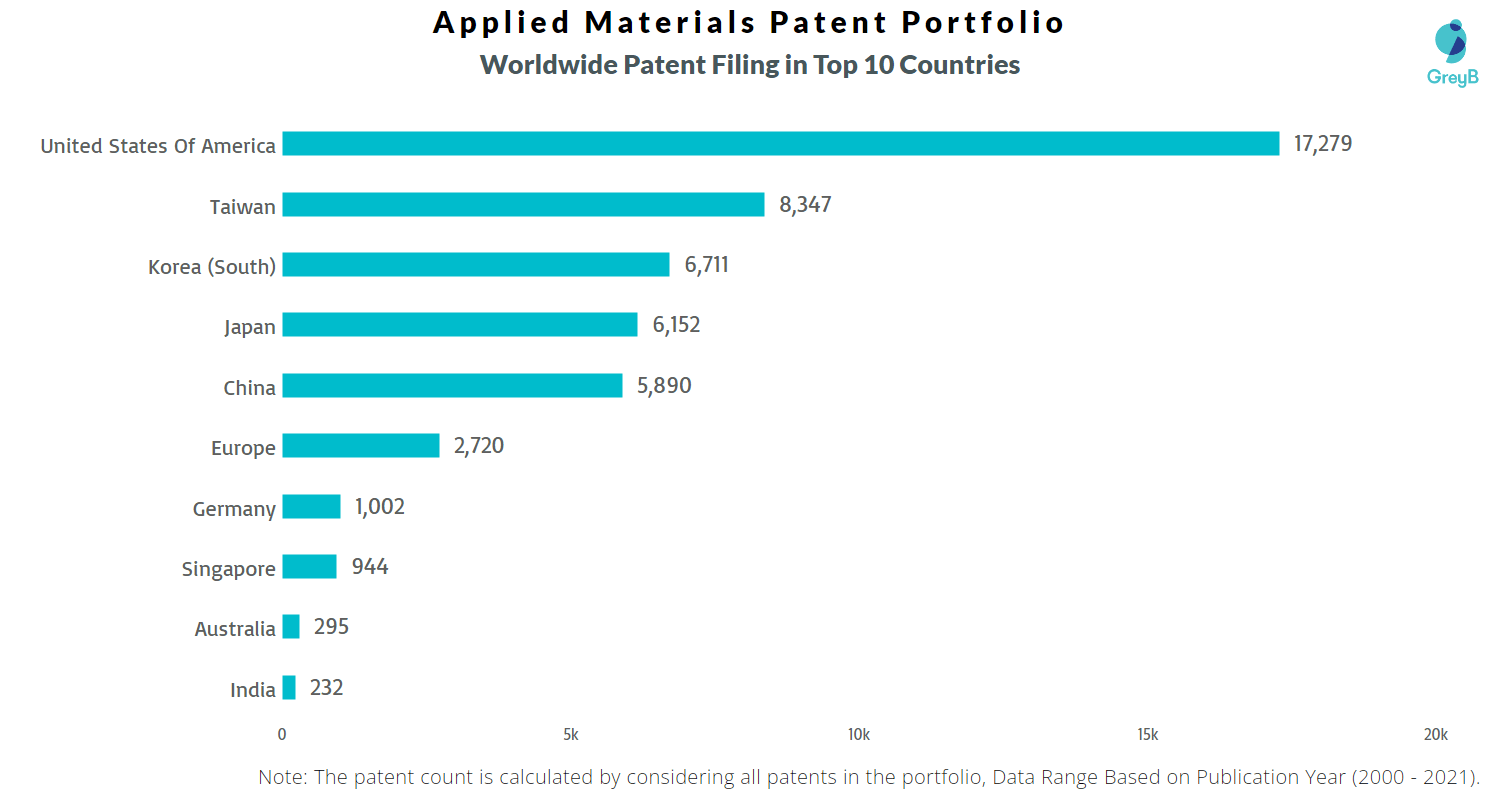
Countries in which Applied Materials Filed Patents
| Country | Patents |
| United States Of America | 17279 |
| Taiwan | 8347 |
| Korea (South) | 6711 |
| Japan | 6152 |
| China | 5890 |
| Europe | 2720 |
| Germany | 1002 |
| Singapore | 944 |
| Australia | 295 |
| India | 232 |
| Austria | 154 |
| United Kingdom | 85 |
| Israel | 73 |
| Italy | 69 |
| Canada | 36 |
| Spain | 33 |
| Poland | 30 |
| Russian Federation | 29 |
| Malaysia | 27 |
| Switzerland | 18 |
| Brazil | 16 |
| Philippines | 12 |
| France | 10 |
| Netherlands | 9 |
| Portugal | 9 |
| Mexico | 7 |
| Hungary | 5 |
| Viet Nam | 3 |
| Colombia | 2 |
| Chile | 2 |
| Denmark | 2 |
| Eurasian Patent Organization | 2 |
| Gulf Cooperation Council | 2 |
| Slovenia | 2 |
| Dominican Republic | 1 |
| Croatia | 1 |
| Ecuador | 1 |
| South Africa | 1 |
| Argentina | 1 |
| Georgia | 1 |
| Peru | 1 |
| Hong Kong (S.A.R.) | 1 |
| Serbia | 1 |
Where are Research Centers of Applied Materials Patents Located?

10 Best Applied Materials Patents
US6573030B1 is the most popular patent in the Applied Materials portfolio. It has received 951 citations so far from companies like Micron Technology, ASM IP Holding and SK Hynix.
Below is the list of 10 most cited patents of Applied Materials:
| Publication Number | Citation Count |
| US6573030B1 | 951 |
| US6086677A | 748 |
| US6197181B1 | 626 |
| US6302964B1 | 615 |
| US6054379A | 604 |
| US6035101A | 589 |
| US6387207B1 | 582 |
| US20030116087A1 | 556 |
| US20030019428A1 | 544 |
| US6136163A | 539 |
Which Companies are using Applied Materials Patents to Advance their Research?
If patents or patents from a particular technology area of a company receive a lot of citations, it implies that the technology is being followed and incrementally innovated by the citing companies. It also indicates that citing companies are working on similar and closely related technologies.
The top companies in the Applied Materials patent portfolio are Tokyo Electron Limited, Tsmc and Samsung.
List of the top forward citing Companies –
| Company | Number of Patents |
| Tokyo Electron Limited | 1111 |
| Tsmc | 953 |
| Samsung | 678 |
| Lam Research | 672 |
| IBM | 264 |
| Asm Ip Holding Bv | 206 |
| LG | 178 |
| Umc | 169 |
| Novellus Systems | 168 |
| Micron Technology | 144 |
Count of 102 and 103 Type Rejections based on Applied Materials Patents

Top Applied Materials Patents used in Rejecting Most Patent Applications
| Patent Number | Count of Rejected Applications |
| US20080216887A1 | 48 |
| US20100012172A1 | 42 |
| US20060060238A1 | 32 |
| US6821563B2 | 30 |
| US20100051085A1 | 28 |
| US20080178805A1 | 27 |
| US20050172996A1 | 26 |
| US20030049372A1 | 25 |
| US7298941B2 | 22 |
| US20090191711A1 | 21 |
| US20030045098A1 | 21 |
| US7951637B2 | 20 |
| US20090093100A1 | 20 |
| US6261408B1 | 18 |
| US6261433B1 | 18 |
| US8129212B2 | 17 |
| US7144751B2 | 17 |
| US7159599B2 | 17 |
| US9391296B2 | 16 |
| US8390980B2 | 16 |
What Percentage of Applied Materials US Patent Applications were Granted?
Applied Materials (Excluding its subsidiaries) has filed 15230 patent applications at USPTO so far (Excluding Design and PCT applications). Out of these 9993 have been granted leading to a grant rate of 73.35%.
Below are the key stats of Applied Materials patent prosecution at the USPTO.

Which Law Firms Filed Most US Patents for Applied Materials?
| Law Firm | Total Applications | Success Rate |
| Patterson & Sheridan Llp | 5047 | 66.16% |
| Kilpatrick Townsend & Stockton | 1159 | 69.52% |
| Moser Taboada | 1133 | 75.21% |
| Fish & Richardson | 761 | 77.04% |
| Servilla Whitney Llc | 621 | 74.37% |
| Lowenstein Sandler Llp | 510 | 90.67% |
| Patent Counsel | 475 | 62.02% |
| Schwabe Williamson & Wyatt | 370 | 96.40% |
| Dugan & Dugan Pc | 366 | 39.16% |
Applied Materials is fine-tuned for rapid testing and development to accelerate its customers’ time to market, with $100 million reinvested each year to keep the centre at the cutting edge. More than 500 Applied Engineers collaborate with clients 24 hours a day, 7 days a week to bring novel semiconductor designs to life.
This one of a kind facility enables Applied Materials to collaborate from the start of the design process, typically two generations ahead of existing technologies, to push the boundaries of what’s possible. With over 120 advanced process tools spanning from lithography to deposition and etch, as well as 80 metrology and inspection instruments, Applied Materials gives customers a unique capacity to accelerate technology transitions, cut cycle times to production, and bring innovative products to market with less risk.
As Moore’s Law scaling becomes more difficult, Applied Materials accelerated the customer availability of novel chip-making materials and process technologies that enabled breakthroughs in semiconductor performance, power, and cost, opening up new avenues for Applied and its customers to drive innovation.
With advanced materials-based R&D, process technologies, device prototyping, and pilot-scale production capabilities, the center also supports industrial initiatives in fields such as Artificial Intelligence (AI), Augmented and Virtual Reality (AR/VR), advanced optics, big data, life sciences, and autonomous vehicles, among others.
What are Applied Material’s key innovation segments?
What Technologies are Covered by Applied Materials Patents?
The chart below distributes patents filed by Applied Materials in different countries on the basis of the technology protected in patents. It also represents the markets where Applied Materials thinks it’s important to protect particular technology inventions.

R&D Focus: How Applied Materials research focus changed over the years?

Interested in knowing about the areas of innovation that are being protected by Applied Materials?
