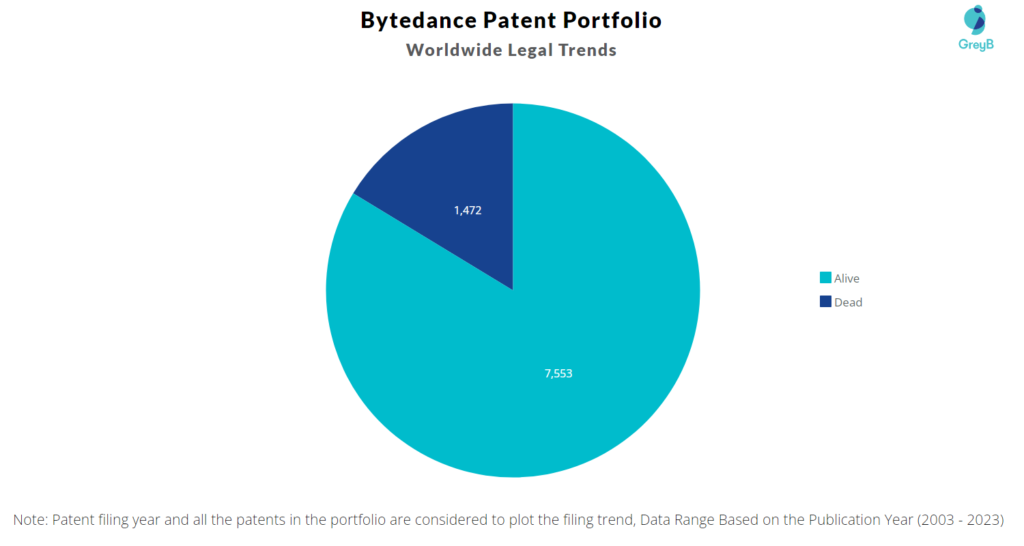
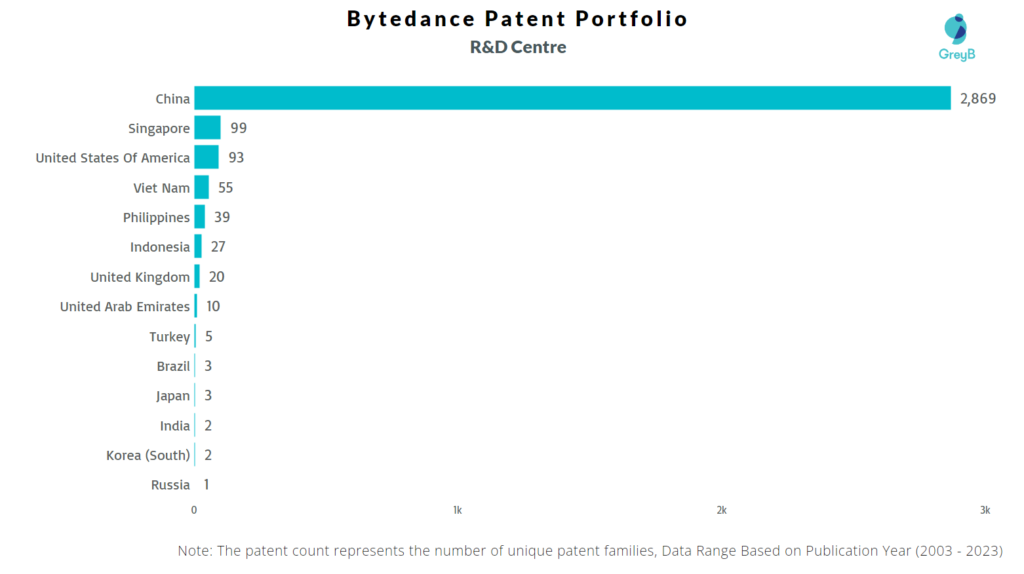
Bytedance has a total of 9025 patents globally, out of which 4240 have been granted. Of these 9025 patents, more than 83% patents are active. The China is where Bytedance has filed the maximum number of patents, followed by United States of America and Japan. Parallelly, The China seems to be the main focused R&D center and also is the origin country of Bytedance.
Bytedance was founded in 2012. The Company operates as a multinational internet technology holding company. The Company operates a range of content platforms that inform, educate, entertain and inspire people.
Do read about some of the most popular patents of Bytedance which have been covered by us in this article and also you can find Bytedance patents information, the worldwide patent filing activity and its patent filing trend over the years, and many other stats over Bytedance patent portfolio.
How many patents does the Founder and CEO of Bytedance have?
The Founder and the CEO Yiming Zhang has 7 patents.
How many patents does Bytedance have?
Bytedance has a total of 9025 patents globally. These patents belong to 3664 unique patent families. Out of 9025 patents, 7553 patents are active.
How Many Patents did Bytedance File Every Year?
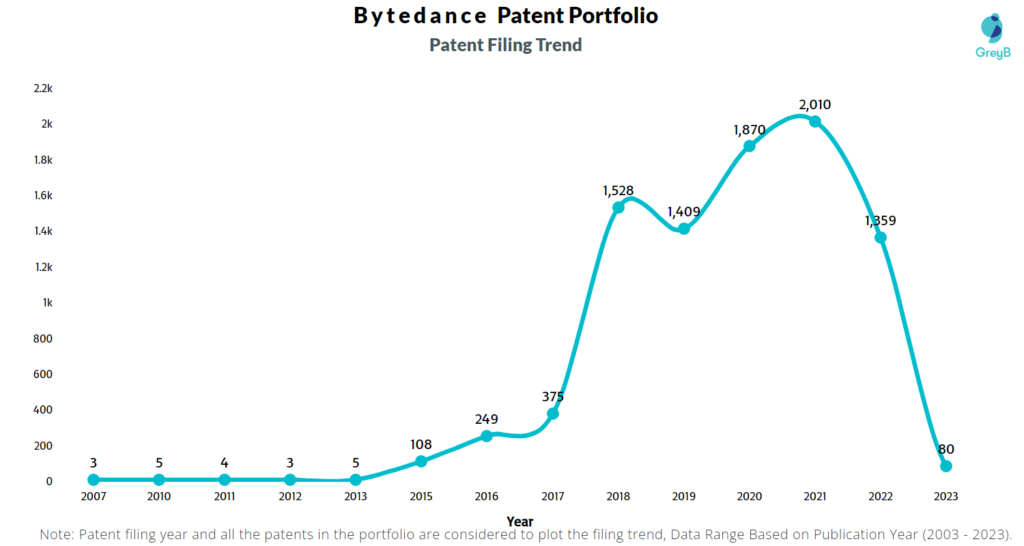
Are you wondering why there is a drop in patent filing for the last two years? It is because a patent application can take up to 18 months to get published. Certainly, it doesn’t suggest a decrease in the patent filing.
| Year of Patents Filing or Grant | Bytedance Applications Filed | Bytedance Patents Granted |
| 2023 | 80 | 445 |
| 2022 | 1359 | 971 |
| 2021 | 2010 | 799 |
| 2020 | 1870 | 452 |
| 2019 | 1409 | 1024 |
| 2018 | 1528 | 376 |
| 2017 | 375 | 95 |
| 2016 | 249 | 57 |
| 2015 | 108 | 20 |
| 2013 | 5 | 1 |
| 2012 | 3 | – |
How many Bytedance patents are Alive/Dead?
Worldwide Patents
How Many Patents did Bytedance File in Different Countries?
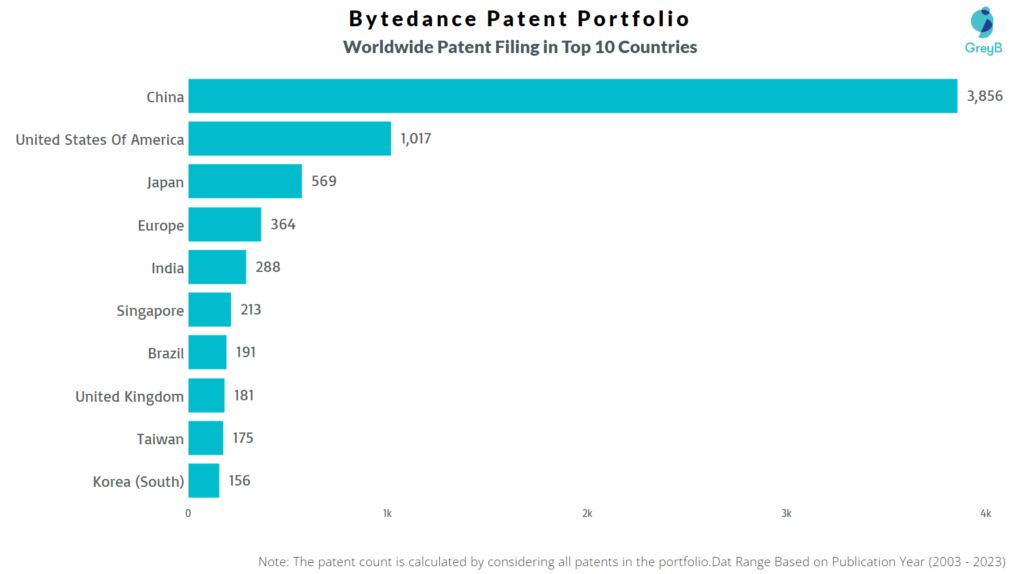
Countries in which Bytedance Filed Patents
| Country | Patents |
| China | 3856 |
| United States Of America | 1017 |
| Japan | 569 |
| Europe | 364 |
| India | 288 |
| Singapore | 213 |
| Brazil | 191 |
| United Kingdom | 181 |
| Taiwan | 175 |
| Korea (South) | 156 |
| Indonesia | 128 |
| Australia | 125 |
| Mexico | 84 |
| South Africa | 72 |
| Canada | 66 |
| Viet Nam | 60 |
| Philippines | 40 |
| Saudi Arabia | 33 |
| Malaysia | 20 |
| Russia | 20 |
| United Arab Emirates | 14 |
| Hong Kong (S.A.R.) | 11 |
| Argentina | 7 |
| Turkey | 5 |
| Thailand | 4 |
| Germany | 1 |
Where are Research Centers of Bytedance Patents Located?
10 Best Bytedance Patents
US9583142B1 is the most popular patent in the Bytedance portfolio. It has received 103 citations so far from companies like Samsung, Walmart Apollo and Verisign.
Below is the list of 10 most cited patents of Bytedance:
| Publication Number | Citation Count |
| US9583142B1 | 103 |
| US20200396465A1 | 98 |
| US20210029362A1 | 94 |
| US10778997B2 | 81 |
| US20200195960A1 | 76 |
| US20200213612A1 | 70 |
| US20200413048A1 | 65 |
| USD788137S1 | 60 |
| USD870140S1 | 58 |
| USD875115S1 | 56 |
How many inventions of other companies were rejected due to Bytedance patents?
The statistics below share strategic R&D insights. It tells the companies that were trying to protect inventions similar to Bytedance invention. They couldn’t because Bytedance had protected those before them.
Examiners at the USPTO referred 83 Bytedance patents in 196 rejections (35 USC § 102 or 35 USC § 103 types).
The top citing companies in the Bytedance patent portfolio are Tencent, Qualcomm and LG.
List of the Companies whose Patents were rejected citing Bytedance –
| Company | Number of Patent Applications that faced Rejection Citing Bytedance Patents | Number of Rejections (102 & 103) |
| Tencent | 15 | 21 |
| Qualcomm | 12 | 16 |
| LG | 11 | 14 |
| Huawei | 6 | 8 |
| Hfi Innovation | 5 | 7 |
| Beijing Dajia | 4 | 7 |
| Oppo | 4 | 4 |
| Apple | 4 | 7 |
| Microsoft | 4 | 6 |
| Alibaba | 3 | 3 |
Count of 102 and 103 Type Rejections based on Bytedance Patents
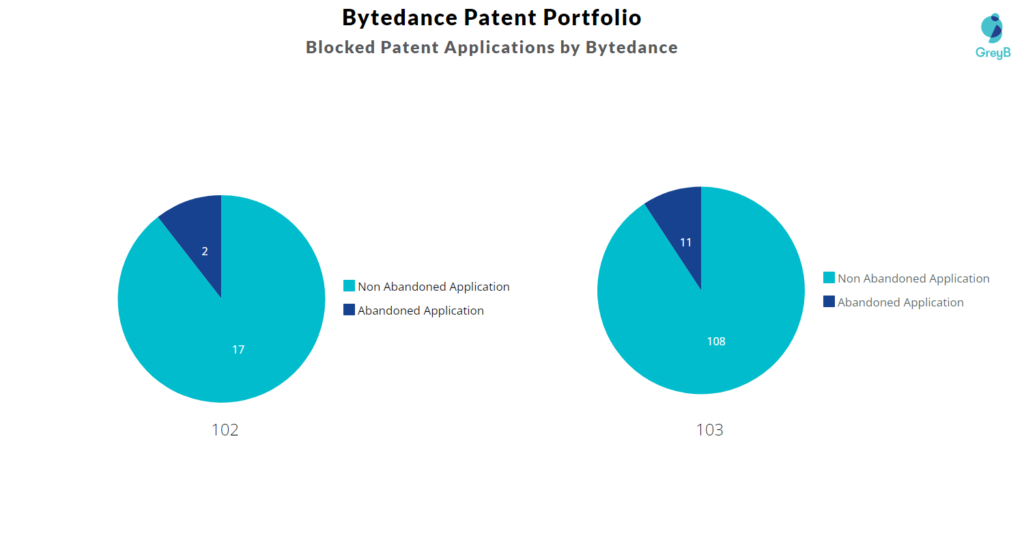
Top Bytedance Patents used in Rejecting Most Patent Applications
| Patent Number | Count of Rejected Applications |
| US8510847B2 | 21 |
| US10042169B2 | 6 |
| US11570458B2 | 4 |
| US10067349B2 | 3 |
| US11115676B2 | 3 |
| US10031340B2 | 3 |
| US10372289B2 | 3 |
| US10176134B2 | 3 |
| US11412212B2 | 3 |
| US20200195960A1 | 2 |
| US11606570B2 | 2 |
| US20220394304A1 | 2 |
| US9294430B2 | 2 |
| US11616973B2 | 2 |
| US10902663B2 | 2 |
What Percentage of Bytedance US Patent Applications were Granted?
Bytedance (Excluding its subsidiaries) has filed 844 patent applications at USPTO so far (Excluding Design and PCT applications). Out of these 319 have been granted leading to a grant rate of 94.1%.
Below are the key stats of Bytedance patent prosecution at the USPTO.

Which Law Firms Filed Most US Patents for Bytedance?
| Law Firm | Total Applications | Success Rate |
| Perkins Coie Llp Sdo General | 552 | 92.86% |
| Bakerhostetler | 129 | 97.10% |
| Faegre Drinker Biddle & Reath | 80 | 100.00% |
| Arentfox Schiff | 29 | 100.00% |
| Conley Rose | 18 | 100.00% |
| Mauriel Kapouytian Woods | 16 | 100.00% |
| Thomas Horstemeyer | 10 | 100.00% |
| Budzyn Ip Law | 1 | 0% |
| Dorsey & Whitney | 1 | 100.00% |
| Getech Law | 1 | 0.00% |
What are Bytedance key innovation segments?
What Technologies are Covered by Bytedance?
The chart below distributes patents filed by Bytedance
