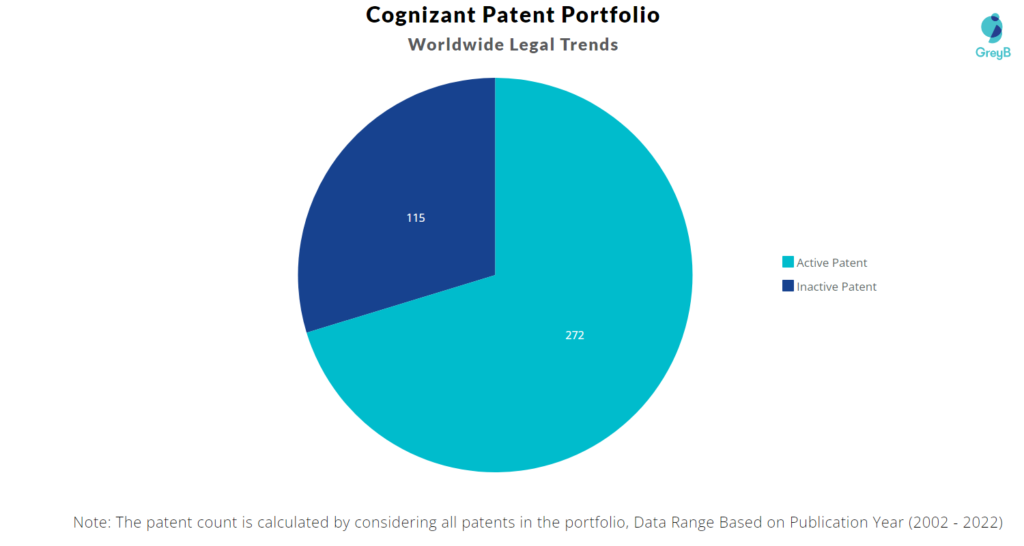
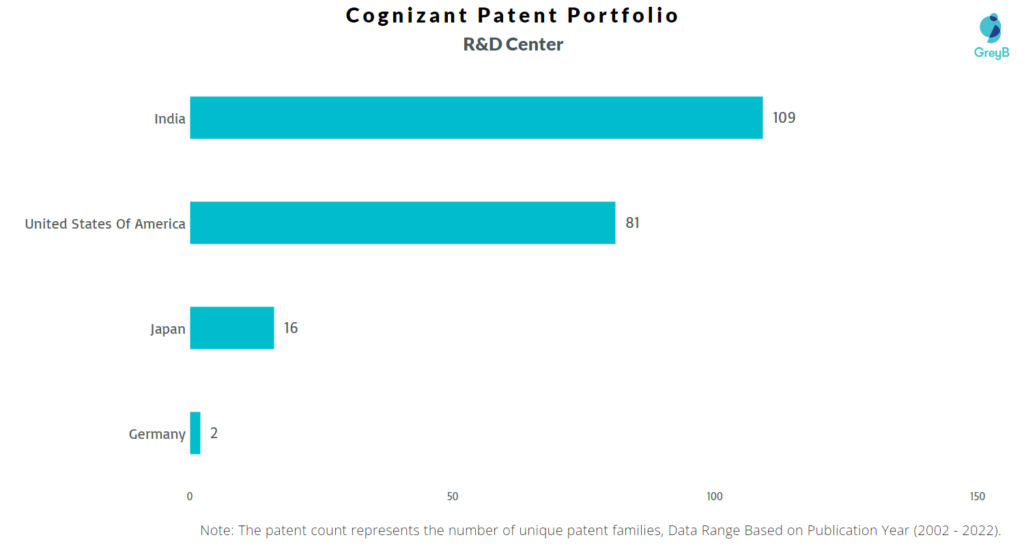
Cognizant has a total of 387 patents globally, out of which 122 have been granted. Of these 387 patents, more than 70% patents are active. United States of America is where Cognizant has filed the maximum number of patents, followed by India and Japan, it has generated an annual revenue of $18.5 billion in the year 2021. India seems to be the main focused R&D center of Cognizant.
Cognizant was founded in the year 1994 by Kumar Mahadeva and Francisco D’Souza. Company is doing business in information technology services and consulting. As of March 2022, Cognizant has a market cap of $48.11 Billion.
Do read about some of the most popular patents of Cognizant which have been covered by us in this article and also you can find Cognizant’s patents information, the worldwide patent filing activity and its patent filing trend over the years, and many other stats over Cognizant’s patent portfolio.
How many patents does the founder and the CEO of Cognizant have?
The founders, Kumar Mahadeva and Francisco D’Souza have 0 patents respectively. The CEO, Brian Humphries has 0 patents.
How many patents does Cognizant have?
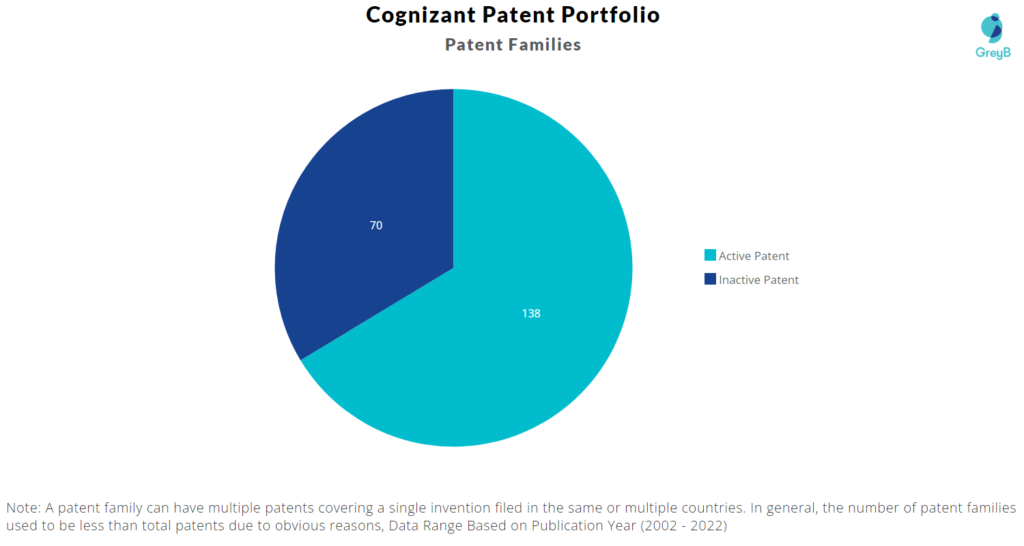
Cognizant has a total of 387 patents globally. These patents belong to 208 unique patent families. Out of 387 patents, 272 patents are active.
How Many Patents did Cognizant File Every Year?
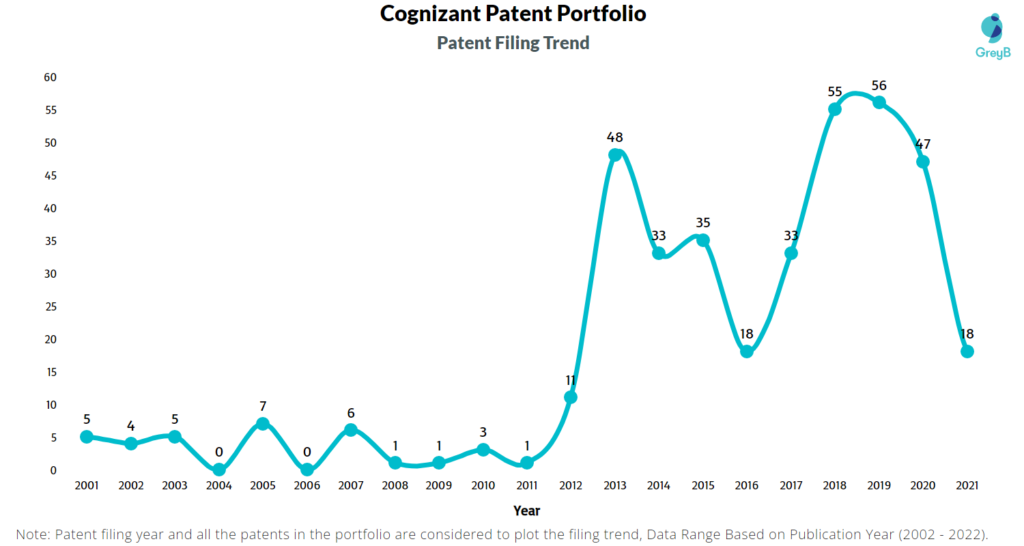
Are you wondering why there is a drop in patent filing for the last two years? It is because a patent application can take up to 18 months to get published. Certainly, it doesn’t suggest a decrease in the patent filing.
| Year of Patents Filing or Grant | Cognizant Applications Filed | Cognizant Patents Granted |
| 2011 | 1 | – |
| 2012 | 11 | 1 |
| 2013 | 48 | 1 |
| 2014 | 33 | 7 |
| 2015 | 35 | 6 |
| 2016 | 18 | 13 |
| 2017 | 33 | 7 |
| 2018 | 55 | 4 |
| 2019 | 56 | 19 |
| 2020 | 47 | 20 |
| 2021 | 18 | 28 |
| 2022 | – | 8 |
How many Cognizant patents are Alive/Dead?
Worldwide Patents
Patent Families
How Many Patents did Cognizant File in Different Countries?
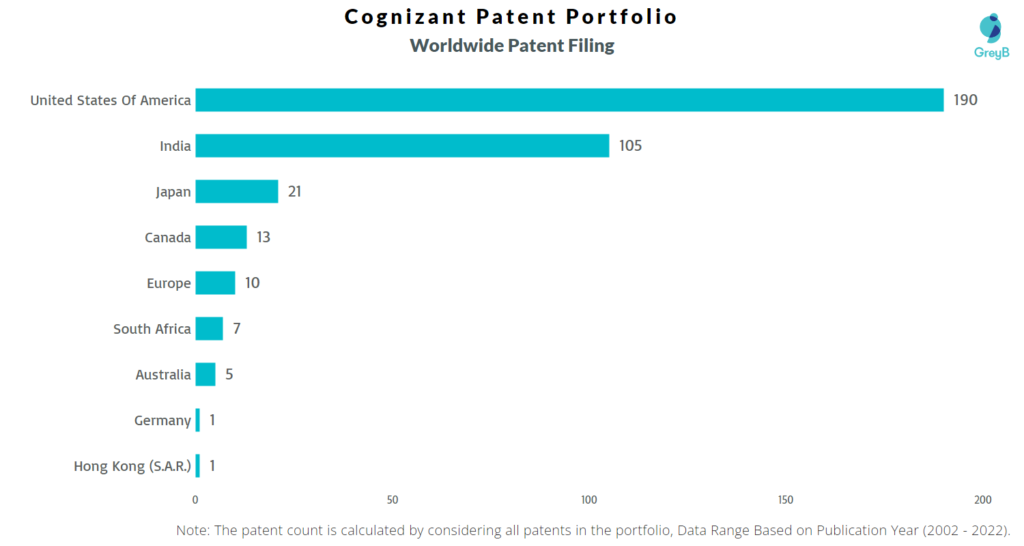
Countries in which Cognizant Filed Patents
| Country | Patents |
| United States Of America | 190 |
| India | 105 |
| Japan | 21 |
| Canada | 13 |
| Europe | 10 |
| South Africa | 7 |
| Australia | 5 |
| Germany | 1 |
| Hong Kong (S.A.R.) | 1 |
Where are Research Centers of Cognizant Patents Located?
10 Best Cognizant Patents
US20040111622A1 is the most popular patent in the Cognizant portfolio. It has received 128 citations so far from companies like American Well, Ehealth Global Technologies, and Microsoft.
Below is the list of 10 most cited patents of Cognizant:
| Publication Number | Citation Count |
| US20040111622A1 | 128 |
| US20090125370A1 | 87 |
| US20140244277A1 | 75 |
| US10509718B2 | 50 |
| US20120239517A1 | 34 |
| WO2014128751A1 | 34 |
| US20150106791A1 | 33 |
| US9043458B2 | 28 |
| WO2014128787A1 | 27 |
| USD761299S1 | 24 |
Which Companies are using Cognizant Patents to Advance their Research?
If patents or patents from a particular technology area of a company receive a lot of citations, it implies that the technology is being followed and incrementally innovated by the citing companies. It also indicates that citing companies are working on similar and closely related technologies.
The top citing companies in the Cognizant patent portfolio are SAP, IBM, and Wipro.
List of the top forward citing Companies –
| Company | Number of Patents |
| SAP | 5 |
| IBM | 5 |
| Wipro | 4 |
| Tata Consultancy Services | 3 |
| Salesforce.com | 3 |
| Microsoft | 3 |
| 2 | |
| Intuit | 2 |
| Boe Technology Group | 2 |
| Morgan Stanley | 2 |
Count of 102 and 103 Type Rejections based on Cognizant Patents
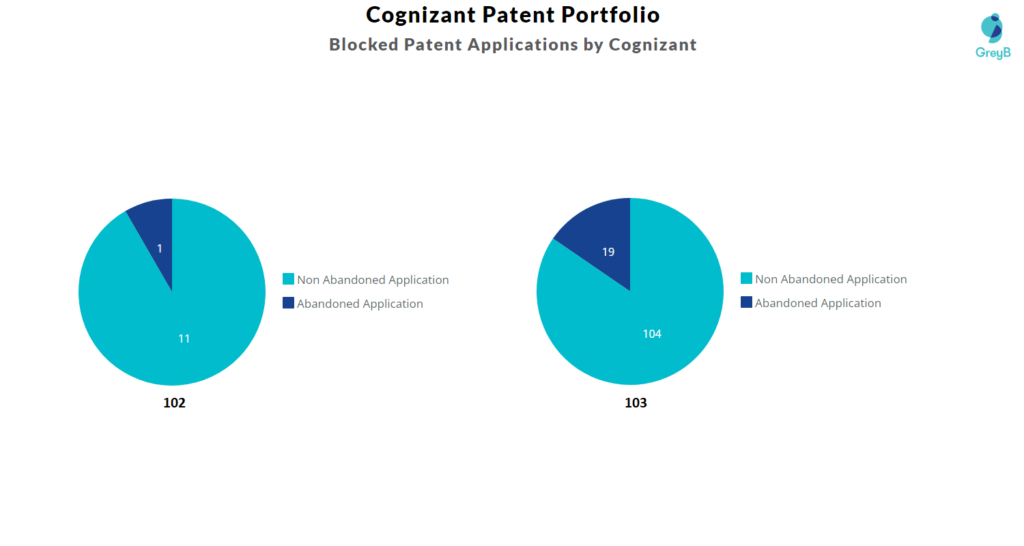
Top Cognizant Patents used in Rejecting Most Patent Applications
| Patent Number | Count of Rejected Applications |
| US9519695B2 | 18 |
| US9043458B2 | 12 |
| US10909459B2 | 7 |
| US9208310B2 | 7 |
| US9158744B2 | 5 |
| US9843625B2 | 5 |
| US20040111622A1 | 4 |
| US20170148082A1 | 3 |
| US10846571B2 | 3 |
| US8819642B2 | 3 |
| US10660576B2 | 3 |
| US20140149294A1 | 3 |
| US20160180403A1 | 3 |
| US20140244277A1 | 3 |
| US9659213B2 | 3 |
What Percentage of Cognizant US Patent Applications were Granted?
Cognizant (Excluding its subsidiaries) has filed 228 patent applications at USPTO so far (Excluding Design and PCT applications). Out of these 149 have been granted leading to a grant rate of 79.68%.
Below are the key stats of Cognizant patent prosecution at the USPTO.

Which Law Firms Filed Most US Patents for Cognizant?
| Law Firm | Total Application | Success Rate |
| Bey & Cotropia Pllc Trizetto | 102 | 87.50% |
| Cantor Colburn Llp | 91 | 72.60% |
| Lerner David Littenberg | 10 | 80.00% |
| Maier & Maier Pllc | 1 | 0% |
| Mcandrews Held & Malloy Ltd | 1 | 0.00% |
| Norton Rose Fulbright Us Llp | 1 | 100.00% |
Cognizant’s inventions are all based on significant insights into the requirements and desires of consumers. Cognizant strives to create products and services with a purpose that customers will pick again and again.
Cognizant is working on a wide range of projects, combining the hunt for breakthrough technology with the continual need to adapt to consumer needs and improve the sustainability of Cognizant products.
Cognizant accomplishes this by combining significant consumer trends, cutting-edge science, and the use of data and digital technologies to create exceptional products, services, and experiences.
EXCLUSIVE INSIGHTS COMING SOON!
What are Cognizant key innovation segments?
What Technologies are Covered by Cognizant?
The chart below distributes patents filed by Cognizant in different countries on the basis of the technology protected in patents. It also represents the markets where Cognizant thinks it’s important to protect particular technology inventions.
R&D Focus: How Cognizant search focus changed over the years?
EXCLUSIVE INSIGHTS COMING SOON!
Interested in knowing about the areas of innovation that are being protected by Cognizant?
