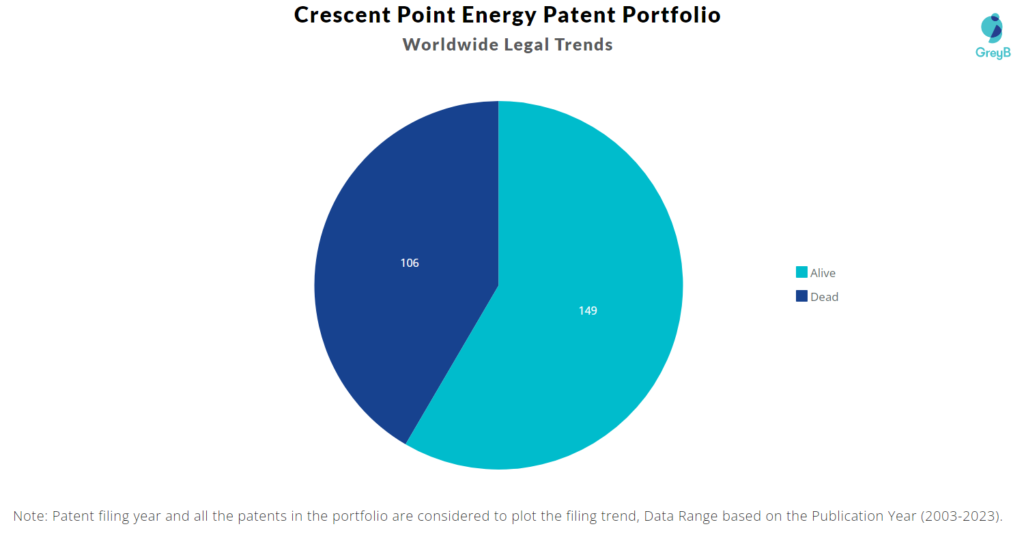
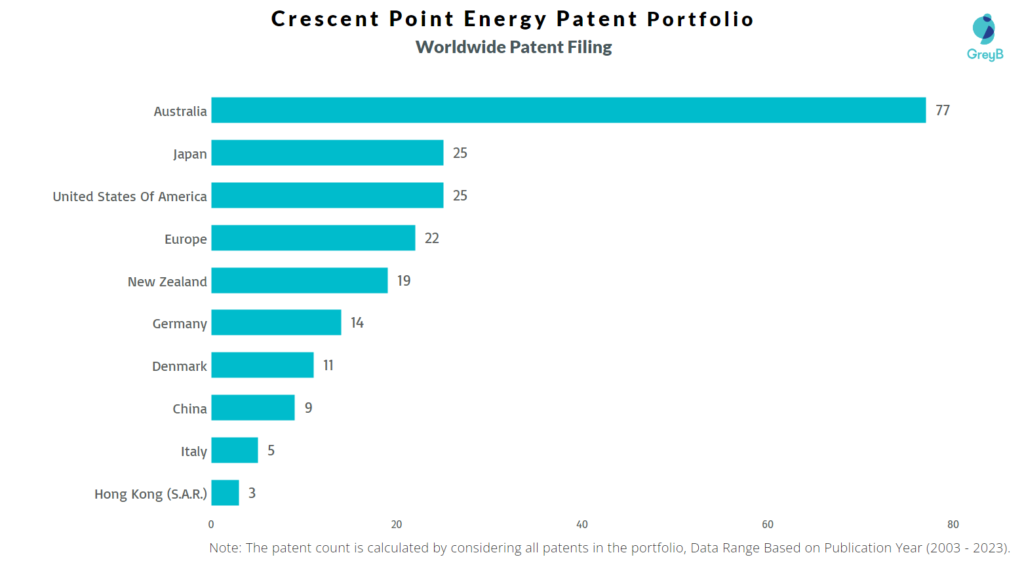
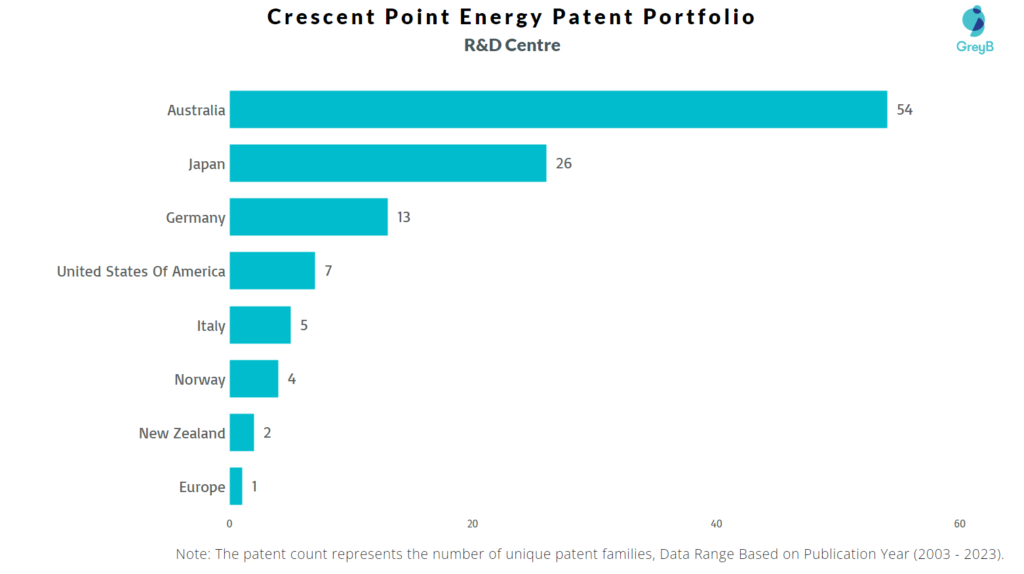
Crescent Point Energy has a total of 255 patents globally, out of which 130 have been granted. Of these 255 patents, more than 58% patents are active. Australia is where Crescent Point Energy has filed the maximum number of patents, followed by Japan and the USA, it has generated an annual revenue of $3.04 billion in the year 2022. Parallelly, Australia seems to be the main focused R&D center of Crescent Point Energy.
Crescent Point Energy was founded in the year 1994. The company is an independent exploration and production company that produces oil and gas.
Do read about some of the most popular patents of Crescent Point Energy which have been covered by us in this article and also you can find Crescent Point Energy patents information, the worldwide patent filing activity and its patent filing trend over the years, and many other stats over Crescent Point Energy patent portfolio.
How many patents does the CEO of Crescent Point Energy have?
The CEO, Craig Bryksa, has 0 patents.
How many patents does Crescent Point Energy have?
Crescent Point Energy has a total of 255 patents globally. These patents belong to 112 unique patent families. Out of 255 patents, 149 patents are active.
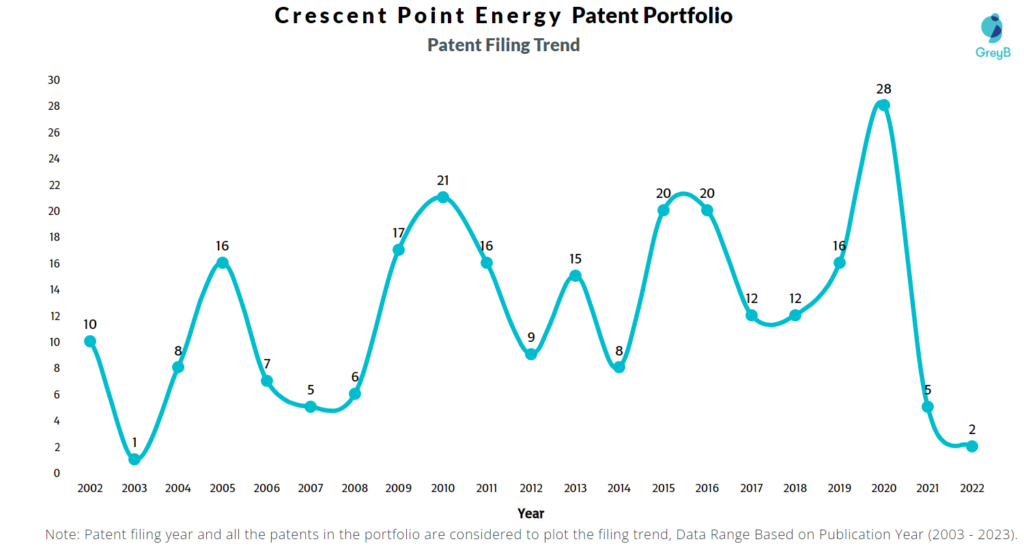
How Many Patents did Crescent Point Energy File Every Year?

Are you wondering why there is a drop in patent filing for the last two years? It is because a patent application can take up to 18 months to get published. Certainly, it doesn’t suggest a decrease in the patent filing.
| Year of Patents Filing or Grant | Crescent Point Energy Applications Filed | Crescent Point Energy Patents Granted |
| 2022 | 2 | 11 |
| 2021 | 5 | 15 |
| 2020 | 28 | 33 |
| 2019 | 16 | 6 |
| 2018 | 12 | 11 |
| 2017 | 12 | 9 |
| 2016 | 20 | 4 |
| 2015 | 20 | 6 |
| 2014 | 8 | 6 |
| 2013 | 15 | 3 |
| 2012 | 9 | 2 |
| 2011 | 16 | 8 |
How many Crescent Point Energy patents are Alive/Dead?
Worldwide Patents

How Many Patents did Crescent Point Energy File in Different Countries?

Countries in which Crescent Point Energy Filed Patents
| Country | Patents |
| Australia | 77 |
| Japan | 25 |
| United States Of America | 25 |
| Europe | 22 |
| New Zealand | 19 |
| Germany | 14 |
| Denmark | 11 |
| China | 9 |
| Italy | 5 |
| Hong Kong (S.A.R.) | 3 |
| United Kingdom | 3 |
| Norway | 3 |
| India | 3 |
| Austria | 2 |
| Indonesia | 2 |
| Canada | 1 |
| Poland | 1 |
| Brazil | 1 |
| Slovenia | 1 |
| Portugal | 1 |
| Spain | 1 |
Where are Research Centers of Crescent Point Energy Patents Located?

10 Best Crescent Point Energy Patents
US20070209711A1 is the most popular patent in the Crescent Point Energy portfolio. It has received 15 citations so far.
Below is the list of 10 most cited patents of Crescent Point Energy:
| Publication Number | Citation Count |
| US20070209711A1 | 15 |
| US20040037531A1 | 14 |
| JP2014154602A | 13 |
| US7040089B2 | 11 |
| JP2014093868A | 11 |
| US20120152373A1 | 8 |
| US20080273962A1 | 8 |
| WO2012135890A1 | 8 |
| US9027861B2 | 7 |
| WO2006022551A1 | 7 |
What are Crescent Point Energy’s key innovation segments?
What Technologies are Covered by Crescent Point Energy?

The chart below distributes patents filed by Crescent Point Energy
