Patents often act as signposts of progress, and nowhere is this more evident than in East Asia. From 2019 to 2025, the region’s innovation footprint has grown so vast that it now defines much of the global conversation around technology and intellectual property. China, Japan, South Korea, Taiwan and Hong Kong are not only filing at record levels but they are shaping the future of industries as diverse as semiconductors, digital communications, clean energy and healthcare.
What sets East Asia apart is the scale and intensity of its innovation. Here, multinational giants like Samsung, Huawei and Toyota compete shoulder to shoulder with ambitious startups and world-renowned universities. Governments, too, play a decisive role, channeling resources into R&D and building ecosystems where ideas are rapidly converted into patented breakthroughs. The result is a patent landscape that feels less like a steady march and more like a relentless sprint driven by the urgency to lead in areas such as AI, 5G and sustainable technologies.
For a balanced view of worldwide trends, we’ve also published a separate article covering countries outside East Asia, giving readers the opportunity to connect both perspectives and see the complete picture of global innovation.
Which are the Top 100 Companies in Global Patent Landscape?
The list below presents the top 100 companies based on the count of their total published patents in the last 5 Years (2019 – 2024) along with the percent change in the patent count in the last 2 years.
Top 100 Companies with the Most Published Patents (2019–2024)
| Rank | Company | Headquarter Country | Published Patent (2019 – 2024) | Published Patent in 2023 | Published Patent in 2024 | YoY Change(%) |
|---|---|---|---|---|---|---|
| Samsung | South Korea | 353572 | 79513 | 85846 | 0.079647 | |
| LG | South Korea | 271805 | 23491 | 62714 | 1.669703 | |
| Huawei | China | 214749 | 47265 | 46881 | -0.008124 | |
| Qualcomm | USA | 151012 | 34977 | 39004 | 0.115133 | |
| Mitsubishi | Japan | 120269 | 21486 | 22304 | 0.038071 | |
| Toyota | Japan | 108671 | 21726 | 23566 | 0.084691 | |
| Canon | Japan | 102536 | 21892 | 22199 | 0.014023 | |
| Haier | China | 99033 | 31919 | 13503 | -0.576960 | |
| Bosch | Germany | 94179 | 16259 | 16661 | 0.024725 | |
| State Grid | China | 91101 | 16254 | 13946 | -0.141996 | |
| Panasonic | Japan | 89947 | 17600 | 19121 | 0.086420 | |
| Oppo | China | 84053 | 15589 | 14046 | -0.098980 | |
| Sony | Japan | 82862 | 17601 | 14727 | -0.163286 | |
| Gree | China | 82859 | 13796 | 13949 | 0.011090 | |
| Apple | USA | 78055 | 17105 | 20179 | 0.179714 | |
| Sumitomo | Japan | 76652 | 12244 | 12337 | 0.007596 | |
| BOE Technology | China | 76427 | 15872 | 17086 | 0.076487 | |
| Ericsson | Sweden | 75595 | 14554 | 13275 | -0.087880 | |
| Hyundai | South Korea | 71714 | 16875 | 12290 | -0.271704 | |
| Tencent | China | 66588 | 23174 | 15123 | -0.347415 | |
| Philips | Netherlands | 62146 | 10004 | 9551 | -0.045282 | |
| Philips | Netherlands | 62146 | 10004 | 4494 | -0.550780 | |
| Fujifilm | Japan | 60720 | 12390 | 11155 | -0.099677 | |
| IBM | USA | 60459 | 12405 | 8932 | -0.279968 | |
| Honda | Japan | 60324 | 12272 | 10459 | -0.147735 | |
| Midea | China | 60237 | 9874 | 10495 | 0.062892 | |
| Microsoft | USA | 59910 | 10643 | 10621 | -0.002067 | |
| USA | 59199 | 12179 | 13620 | 0.118318 | ||
| Intel | USA | 55312 | 9972 | 8841 | -0.113418 | |
| TSMC | Taiwan | 54818 | 13555 | 14409 | 0.063003 | |
| Sinopec | China | 54573 | 13145 | 13833 | 0.052339 | |
| Xiaomi | China | 52197 | 12690 | 14869 | 0.171710 | |
| NTT | Japan | 50635 | 11936 | 11936 | 0.000000 | |
| Vivo | China | 47691 | 11974 | 11320 | -0.054618 | |
| Denso | Japan | 46820 | 9163 | 8298 | -0.094401 | |
| Kia | South Korea | 46295 | 10794 | 10444 | -0.032425 | |
| ZTE | China | 45906 | 9948 | 11225 | 0.128368 | |
| Ford | USA | 43078 | 6194 | 5399 | -0.128350 | |
| NEC | Japan | 42017 | 9789 | 9333 | -0.046583 | |
| Seiko Epson | Japan | 39688 | 8845 | 7615 | -0.139062 | |
| Kyocera | Japan | 36930 | 4472 | 11725 | 1.621869 | |
| BASF | Germany | 35765 | 6439 | 6348 | -0.014133 | |
| China Mobile | China | 34039 | 13378 | 12036 | -0.100314 | |
| China Mobile | China | 34039 | 13378 | 4833 | -0.638735 | |
| Sharp | Japan | 33569 | 5417 | 5154 | -0.048551 | |
| Toshiba | Japan | 32190 | 6612 | 6469 | -0.021627 | |
| Boeing | USA | 31687 | 4774 | 4139 | -0.133012 | |
| Murata Manufacturing | Japan | 31551 | 7109 | 6929 | -0.025320 | |
| Applied Materials | USA | 30809 | 8058 | 8246 | 0.023331 | |
| Ricoh | Japan | 30577 | 5656 | 5112 | -0.096181 | |
| BMW | Germany | 30446 | 5373 | 6294 | 0.171413 | |
| Nokia | Finland | 30136 | 6073 | 8605 | 0.416927 | |
| Siemens | Germany | 29623 | 4765 | 4289 | -0.099895 | |
| Nippon Steel | Japan | 29140 | 5906 | 5673 | -0.039451 | |
| Nike | USA | 28950 | 4852 | 4997 | 0.029885 | |
| BYD | China | 27962 | 5632 | 10324 | 0.833097 | |
| HP | USA | 27952 | 3667 | 2453 | -0.331061 | |
| Micron Technology | USA | 27596 | 6306 | 6354 | 0.007612 | |
| Roche | Switzerland | 27579 | 4998 | 4720 | -0.055622 | |
| Volkswagen | Germany | 27261 | 4252 | 4459 | 0.048683 | |
| Dow | USA | 26638 | 5297 | 4640 | -0.124032 | |
| 3M | USA | 26621 | 3582 | 3015 | -0.158291 | |
| Schaeffler | Germany | 26526 | 4231 | 4165 | -0.015599 | |
| Tokyo Electron | Japan | 26129 | 5974 | 6578 | 0.101105 | |
| Daikin | Japan | 25654 | 6086 | 5840 | -0.040421 | |
| Fujitsu | Japan | 25558 | 4528 | 3365 | -0.256846 | |
| Geely | China | 25107 | 5777 | 7182 | 0.243206 | |
| Procter & Gamble | USA | 24988 | 4119 | 3993 | -0.030590 | |
| Semiconductor Energy Laboratory | Japan | 24914 | 5235 | 5314 | 0.015091 | |
| Baidu | China | 24855 | 8583 | 5975 | -0.303856 | |
| JFE Steel | Japan | 24563 | 5731 | 6154 | 0.073809 | |
| Inspur | China | 24499 | 6892 | 5465 | -0.207052 | |
| Halliburton | USA | 23899 | 4548 | 3598 | -0.208883 | |
| Nissan | Japan | 23890 | 4165 | 3795 | -0.088836 | |
| General Electric | USA | 23786 | 3724 | 5800 | 0.557465 | |
| General Electric | USA | 23786 | 3724 | 5420 | 0.455424 | |
| Guangdong Power Grid | China | 23570 | 4660 | 5361 | 0.150429 | |
| PetroChina | China | 23040 | 4501 | 6425 | 0.427461 | |
| Hitachi | Japan | 22675 | 4940 | 8501 | 0.720850 | |
| Nitto Denko | Japan | 22573 | 4729 | 4577 | -0.032142 | |
| Sanyo Bussan | Japan | 21645 | 6025 | 5201 | -0.136763 | |
| SK Hynix | South Korea | 21369 | 4872 | 5318 | 0.091544 | |
| CATL | China | 21148 | 7149 | 12873 | 0.800671 | |
| Ping An Technology | China | 21106 | 4518 | 3451 | -0.236166 | |
| Saudi Aramco | Saudi Arabia | 20926 | 3830 | 4545 | 0.186684 | |
| Toray Industries | Japan | 19711 | 3442 | 3351 | -0.026438 | |
| Audi | Germany | 19633 | 3005 | 2997 | -0.002662 | |
| FAW | China | 19393 | 5354 | 6578 | 0.228614 | |
| Amazon | USA | 19305 | 2845 | 3225 | 0.133568 | |
| Brother | Japan | 19083 | 4131 | 3958 | -0.041878 | |
| Honeywell | USA | 18739 | 3178 | 3336 | 0.049717 | |
| Konica Minolta | Japan | 18339 | 2817 | 2863 | 0.016329 | |
| Honor | China | 18164 | 7555 | 8215 | 0.087359 | |
| Omron | Japan | 18086 | 3262 | 3179 | -0.025445 | |
| Lenovo | China | 18001 | 3346 | 4659 | 0.392409 | |
| Great Wall Motor | China | 17817 | 4642 | 4941 | 0.064412 | |
| Fanuc | Japan | 17628 | 3529 | 3304 | -0.063757 | |
| Dai Nippon Printing | Japan | 17501 | 3649 | 3294 | -0.097287 | |
| Mercedes-Benz | Germany | 17345 | 2797 | 3959 | 0.415445 | |
| Nicoventures | United Kingdom | 17245 | 4482 | 5219 | 0.164436 |
Which are the Top 50 Most Innovative Countries with Most Patents Globally?
The list below presents the top 50 countries based on the count of their total published patents in the last 5 Years (2019 - 2024) along with the percent change in the patent count in the last 2 years as well as the percentage change in patent count in the last 5 years.
Top 50 Countries with the Most Published Patents (2019–2024)
| Rank | Country | Total Patents Published in Last 5 Years | Published Patent in 2019 | Published Patent in 2023 | Published Patent in 2024 | YoY Change(%) | Change in Last 5 Years(%) |
|---|---|---|---|---|---|---|---|
| 1 | China | 34779737 | 4115200 | 5287608 | 5400303 | 0.021313 | 0.312282 |
| 2 | United States of America | 4928773 | 746445 | 734454 | 769280 | 0.047418 | 0.030592 |
| 3 | Japan | 3287401 | 498023 | 516620 | 488928 | -0.053602 | -0.018262 |
| 4 | Europe (EPO) | 2795152 | 427171 | 420834 | 453394 | 0.07737 | 0.061388 |
| 5 | South Korea | 2211179 | 304213 | 349483 | 341113 | -0.02395 | 0.121297 |
| 6 | Germany | 1481202 | 263105 | 209208 | 217847 | 0.041294 | -0.172015 |
| 7 | India | 843717 | 85012 | 163722 | 209515 | 0.2797 | 1.464534 |
| 8 | Great Britain | 746944 | 165545 | 94216 | 89694 | -0.047996 | -0.45819 |
| 9 | Taiwan | 641338 | 96022 | 97934 | 100583 | 0.027049 | 0.0475 |
| 10 | Austria | 514047 | 134367 | 50183 | 2079 | -0.958572 | -0.984527 |
| 11 | Australia | 413533 | 60342 | 61090 | 66053 | 0.081241 | 0.094644 |
| 12 | Turkey | 375366 | 53334 | 74331 | 43652 | -0.412735 | -0.181535 |
| 13 | Canada | 362920 | 63668 | 66978 | 28330 | -0.577025 | -0.555035 |
| 14 | Brazil | 353812 | 54917 | 49214 | 41593 | -0.154854 | -0.242621 |
| 15 | Russia | 322997 | 62384 | 45296 | 43366 | -0.042609 | -0.304854 |
| 16 | France | 217668 | 32022 | 33503 | 32625 | -0.026207 | 0.018831 |
| 17 | Italy | 217631 | 19570 | 38759 | 30939 | -0.20176 | 0.58094 |
| 18 | Hong Kong | 215726 | 21831 | 31550 | 30216 | -0.042282 | 0.384087 |
| 19 | Spain | 204198 | 28403 | 20688 | 33724 | 0.630124 | 0.187339 |
| 20 | Mexico | 186224 | 29413 | 29925 | 27953 | -0.065898 | -0.049638 |
| 21 | Indonesia | 150700 | 24473 | 21898 | 22706 | 0.036898 | -0.072202 |
| 22 | Poland | 127044 | 22264 | 14793 | 19654 | 0.328601 | -0.11723 |
| 23 | Singapore | 123983 | 16981 | 19506 | 19782 | 0.014149 | 0.164949 |
| 24 | South Africa | 110131 | 15634 | 17187 | 16097 | -0.06342 | 0.029615 |
| 25 | Vietnam | 109306 | 14136 | 15471 | 15392 | -0.005106 | 0.088851 |
| 26 | Israel | 106177 | 13703 | 17127 | 15918 | -0.07059 | 0.161643 |
| 27 | Thailand | 95091 | 12809 | 18043 | 17647 | -0.021948 | 0.377703 |
| 28 | Malaysia | 88044 | 13444 | 13706 | 8715 | -0.364147 | -0.351755 |
| 29 | Philippines | 62881 | 10284 | 7487 | 14192 | 0.895552 | 0.380008 |
| 30 | Ukraine | 59829 | 15398 | 5971 | 6978 | 0.168648 | -0.546824 |
| 31 | Denmark | 55882 | 12982 | 5890 | 5679 | -0.035823 | -0.562548 |
| 32 | New Zealand | 51773 | 4186 | 9560 | 9147 | -0.043201 | 1.185141 |
| 33 | Argentina | 45172 | 6048 | 8940 | 7583 | -0.15179 | 0.253803 |
| 34 | Norway | 39260 | 9274 | 4650 | 3326 | -0.284731 | -0.641363 |
| 35 | Chile | 36964 | 5157 | 6020 | 6090 | 0.011628 | 0.180919 |
| 36 | Saudi Arabia | 34922 | - | 5515 | 6476 | 0.174252 | - |
| 37 | Hungary | 34261 | 6518 | 3916 | 5954 | 0.520429 | -0.08653 |
| 38 | Eurasia | 30776 | 6425 | 5606 | - | - | - |
| 39 | Portugal | 29302 | 6180 | 3368 | 3072 | -0.087886 | -0.502913 |
| 40 | Netherlands | 20399 | 2644 | 3996 | 3227 | -0.192442 | 0.220499 |
| 41 | Colombia | 17937 | 2640 | 2397 | 2107 | -0.120985 | -0.201894 |
| 42 | Switzerland | 15056 | 2404 | 2149 | 2153 | 0.001861 | -0.104409 |
| 43 | Kazakhstan | 14380 | 3015 | - | 1956 | - | -0.351244 |
| 44 | Slovakia | 14277 | 4172 | - | - | - | - |
| 45 | Finland | 12574 | - | 5564 | 4802 | -0.136952 | - |
| 46 | Iran | 11930 | 2258 | 1702 | - | - | - |
| 47 | Croatia | 11421 | 2233 | - | 2061 | - | -0.077026 |
| 48 | Slovenia | 10583 | 3107 | - | - | - | - |
| 49 | Sweden | 9838 | 2286 | 1900 | 1943 | 0.022632 | -0.150044 |
| 50 | Luxembourg | 9346 | - | 2148 | 3115 | 0.450186 | - |
Which Countries have Filed Most Patents Globally from 2019 to 2025?
The chart below presents the number of published patents by the countries globally from 2019 to 2025 contributing to the global innovation and technological advancement.
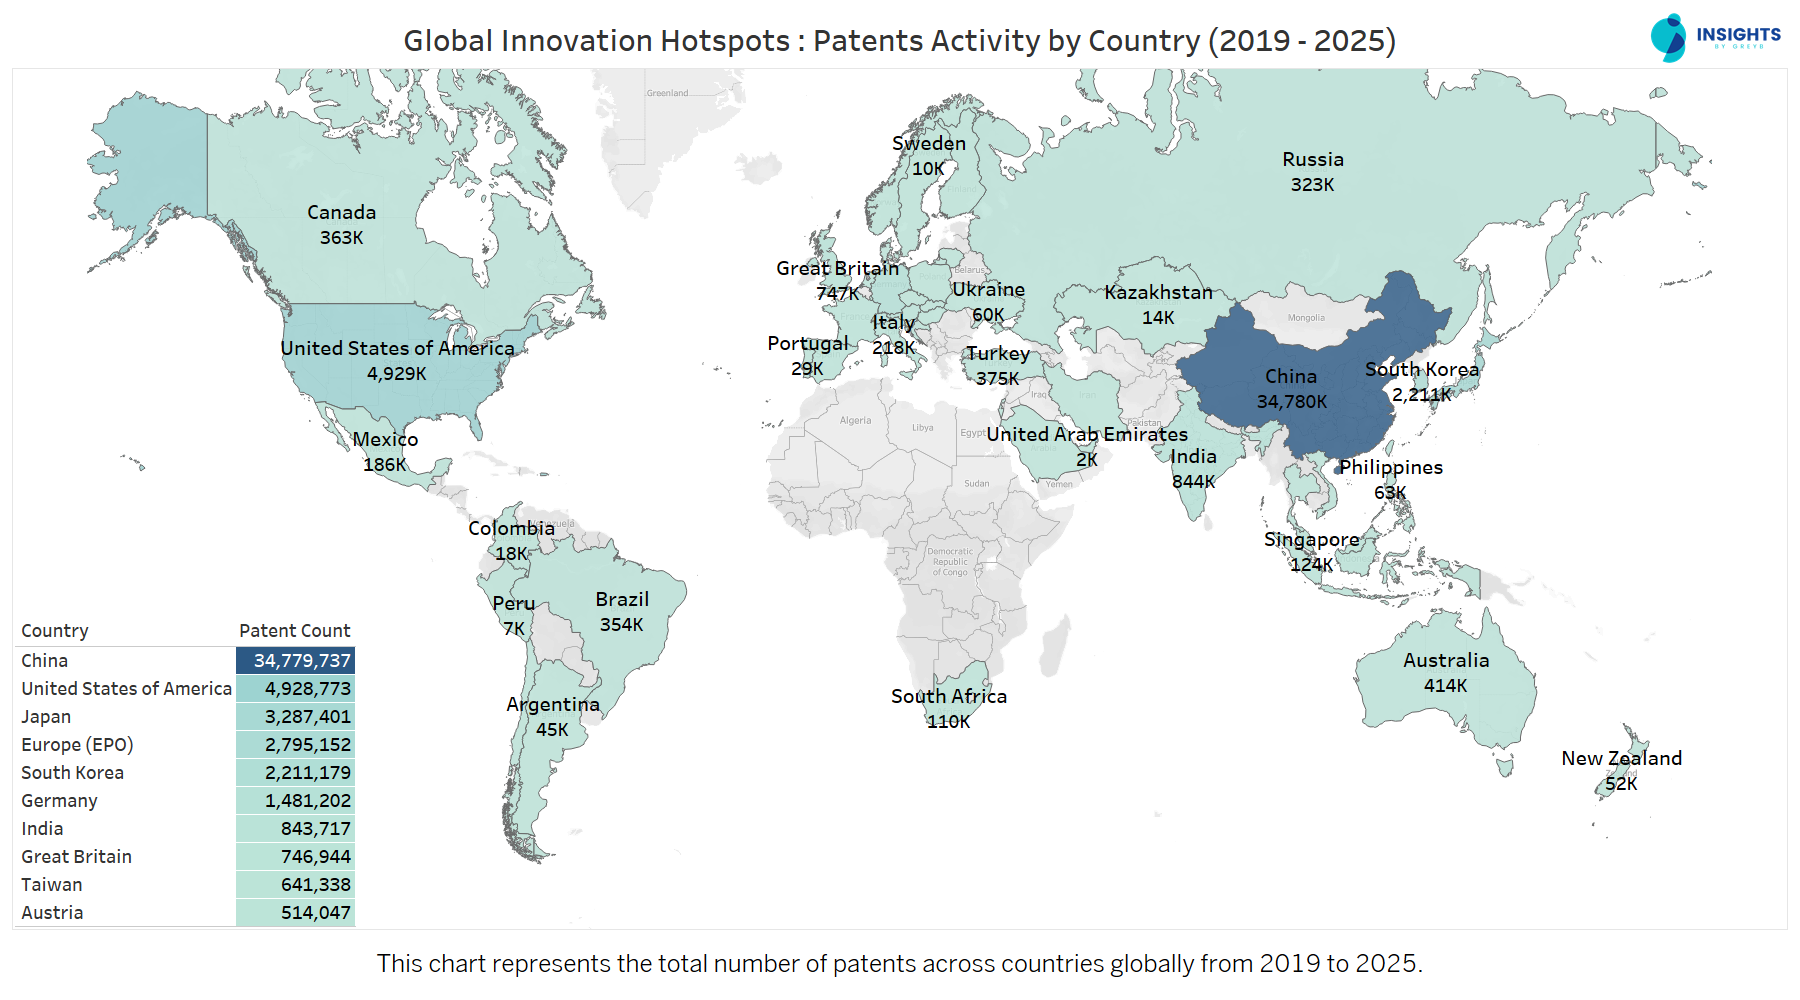
When it comes to patents, the map makes one fact impossible to ignore, China is in a league of its own. With over 34 million patents filed between 2019 and 2025, its volume dwarfs every other nation, more than seven times that of the United States. Japan and South Korea, while far behind China, still stand as global heavyweights, each contributing millions of filings that reinforce East Asia’s dominance.
Beyond this powerhouse trio, Europe (EPO) and the United States form the next tier, while countries like India, Taiwan and Germany emerge as important but secondary players. Interestingly, regions such as Brazil, Russia and Australia appear on the map but with far smaller footprints, hinting at concentrated rather than widespread innovation ecosystems.
Want a deeper dive into US vs Chinese AI patent strategies? Explore AI Patent Landscape: USA vs China.
As this map illustrates, East Asian countries led by China, Japan and South Korea has become the epicenter of global innovation, driving a significant portion of the world’s patent activity. In this article, we delve deeper into the patent landscape of these key East Asian nations, exploring how their advancements are shaping the future of innovation.
To begin this exploration, let’s first look at the publication and grant trends from 2019 to 2025, which reveal how patent activity has evolved across East Asia.
How Have Patent Publications and Grants Evolved in East Asia Over Time?
This chart presents the total count of published and granted patents from 2019 to 2025 for the key innovative countries analyzed in the East Asian Patent Landscape.
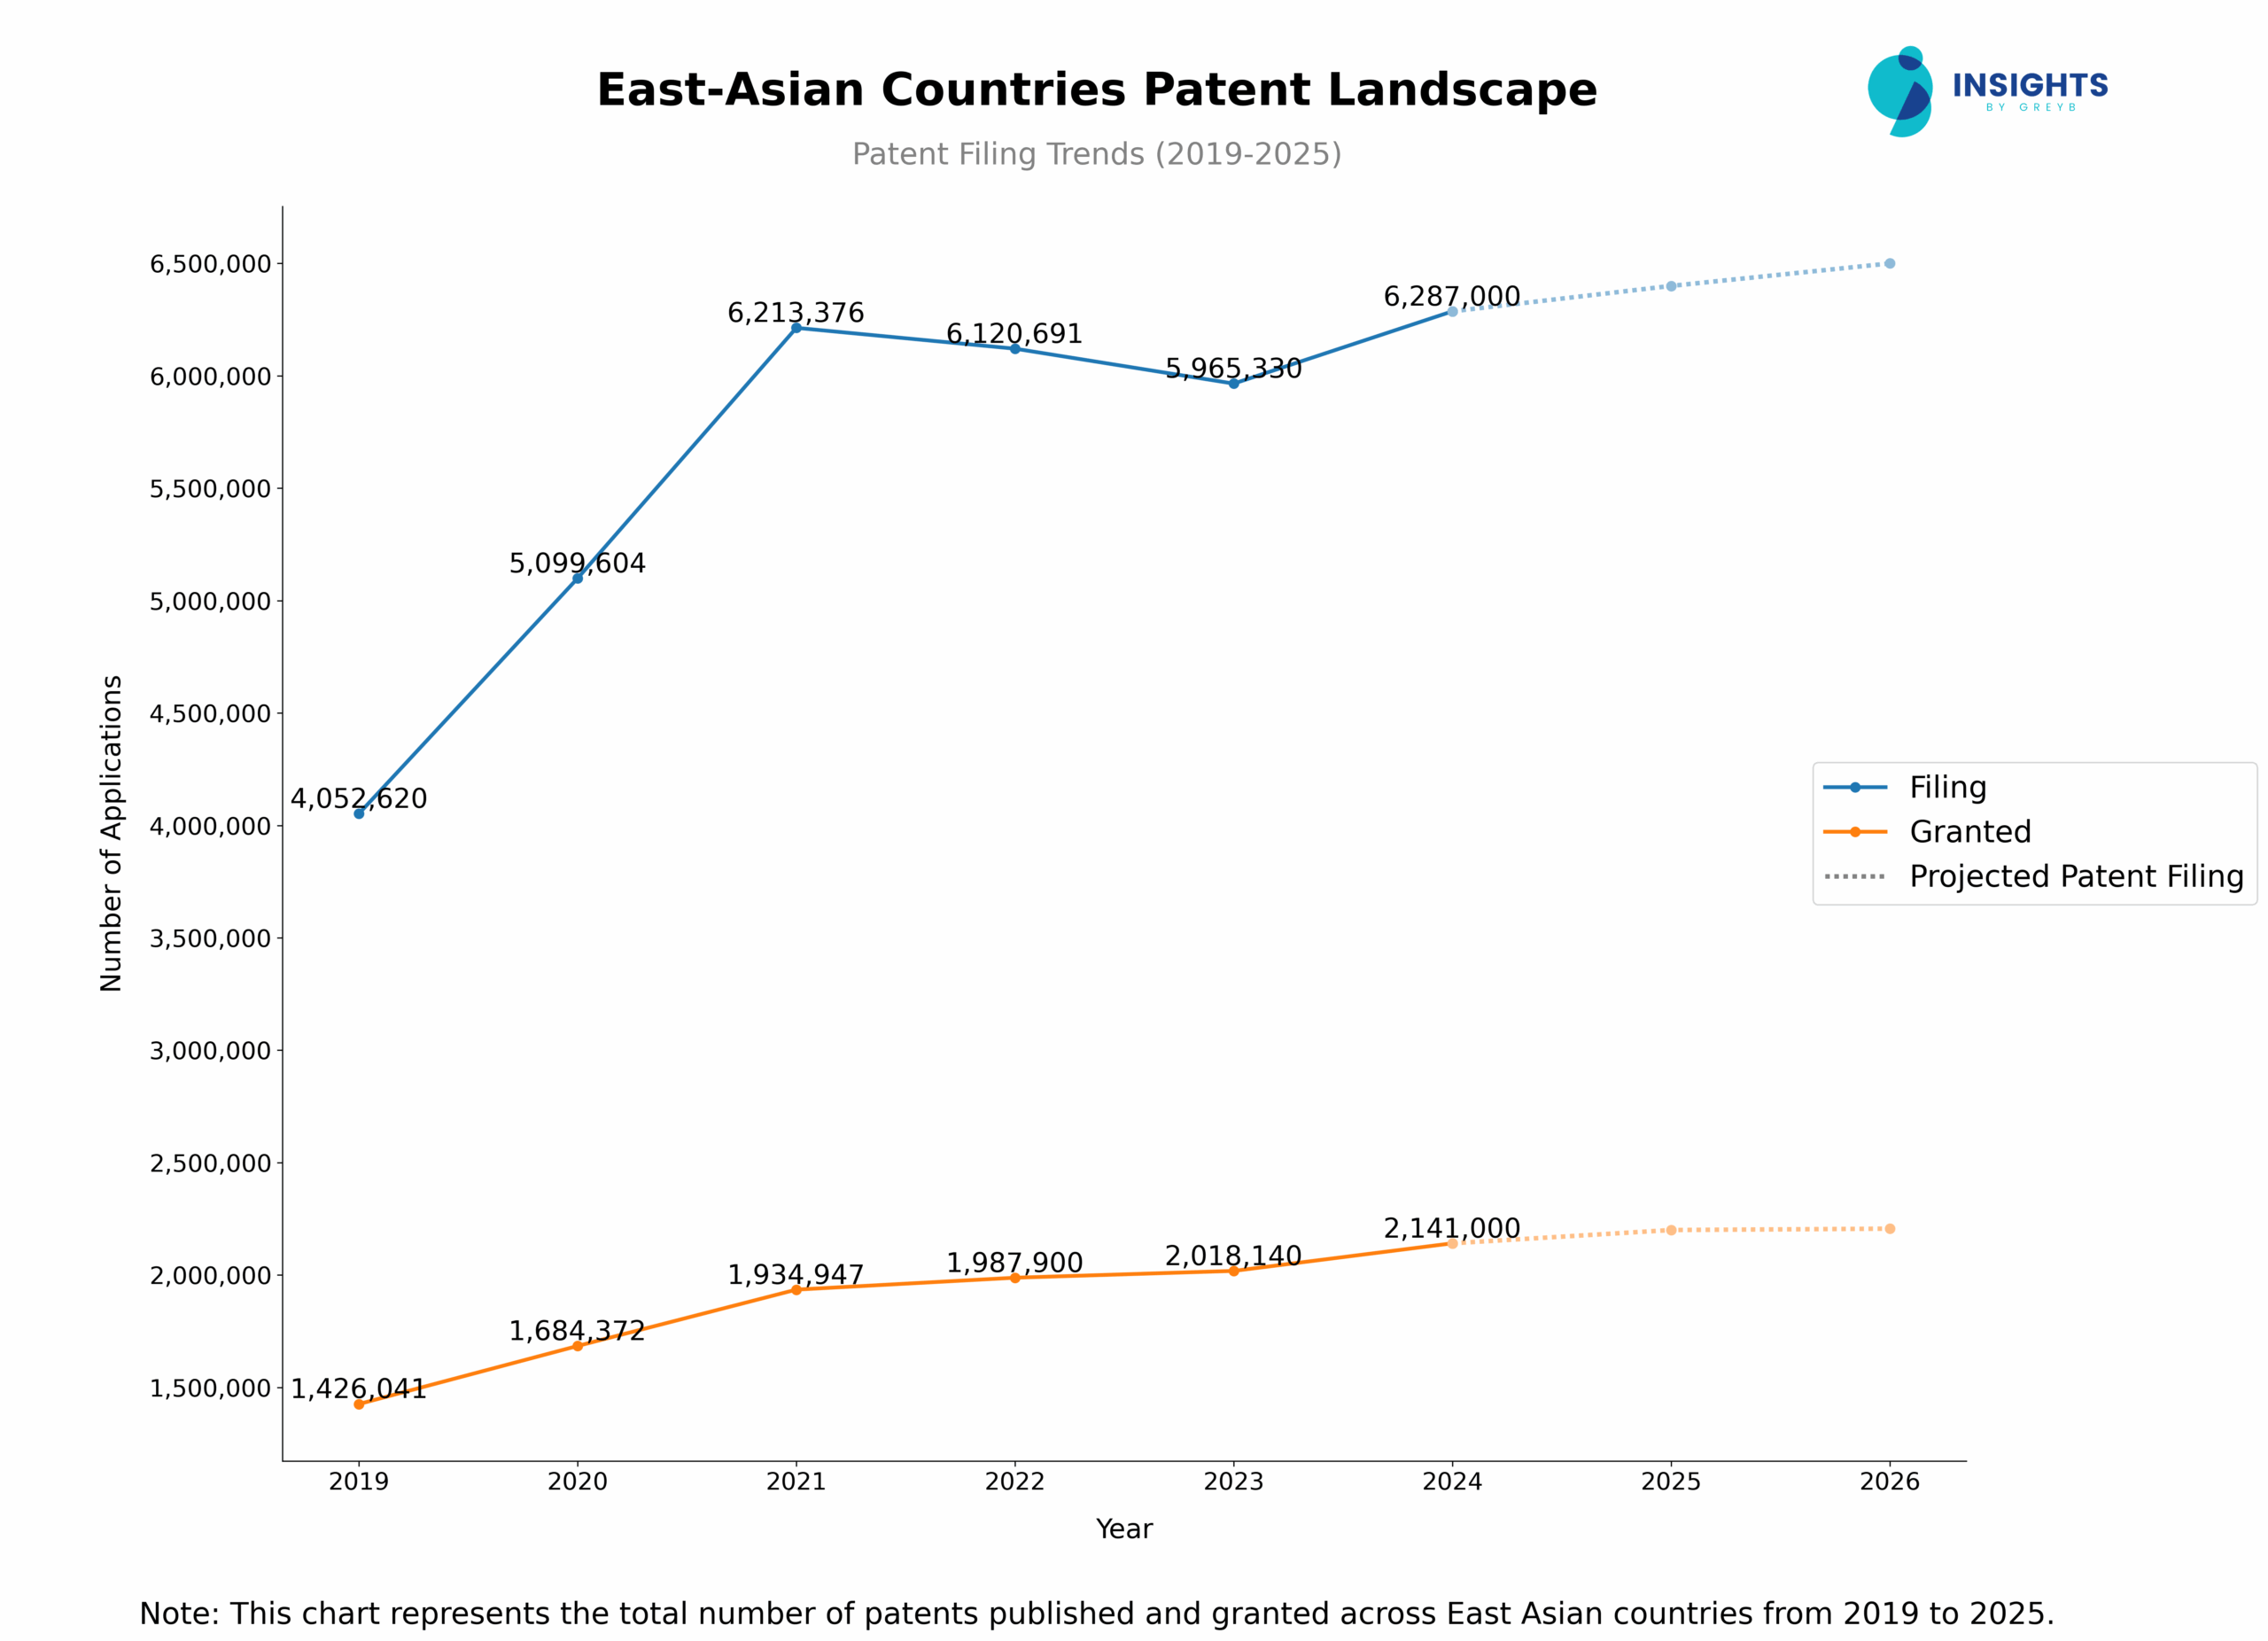
2024 recorded the highest number of patent publications in the past six years, with a 54% increase over 2019, marking a continued surge in patent publications in East Asia.
Also, are you wondering why there is a drop in patent filing for the last two years? It’s because a patent application can take up to 18 months to get published. Certainly, it doesn’t suggest a decrease in patent filing. We are considering total records of published patent applications for our research, utilising the most recent year’s patent count for comparison.
How Does Patent Legal Status Impact Innovation in East Asia?
This chart illustrates the legal status of patents filed between 2019 and 2025 for the East Asian countries in our analysis highlighting the proportion of active and inactive patents.
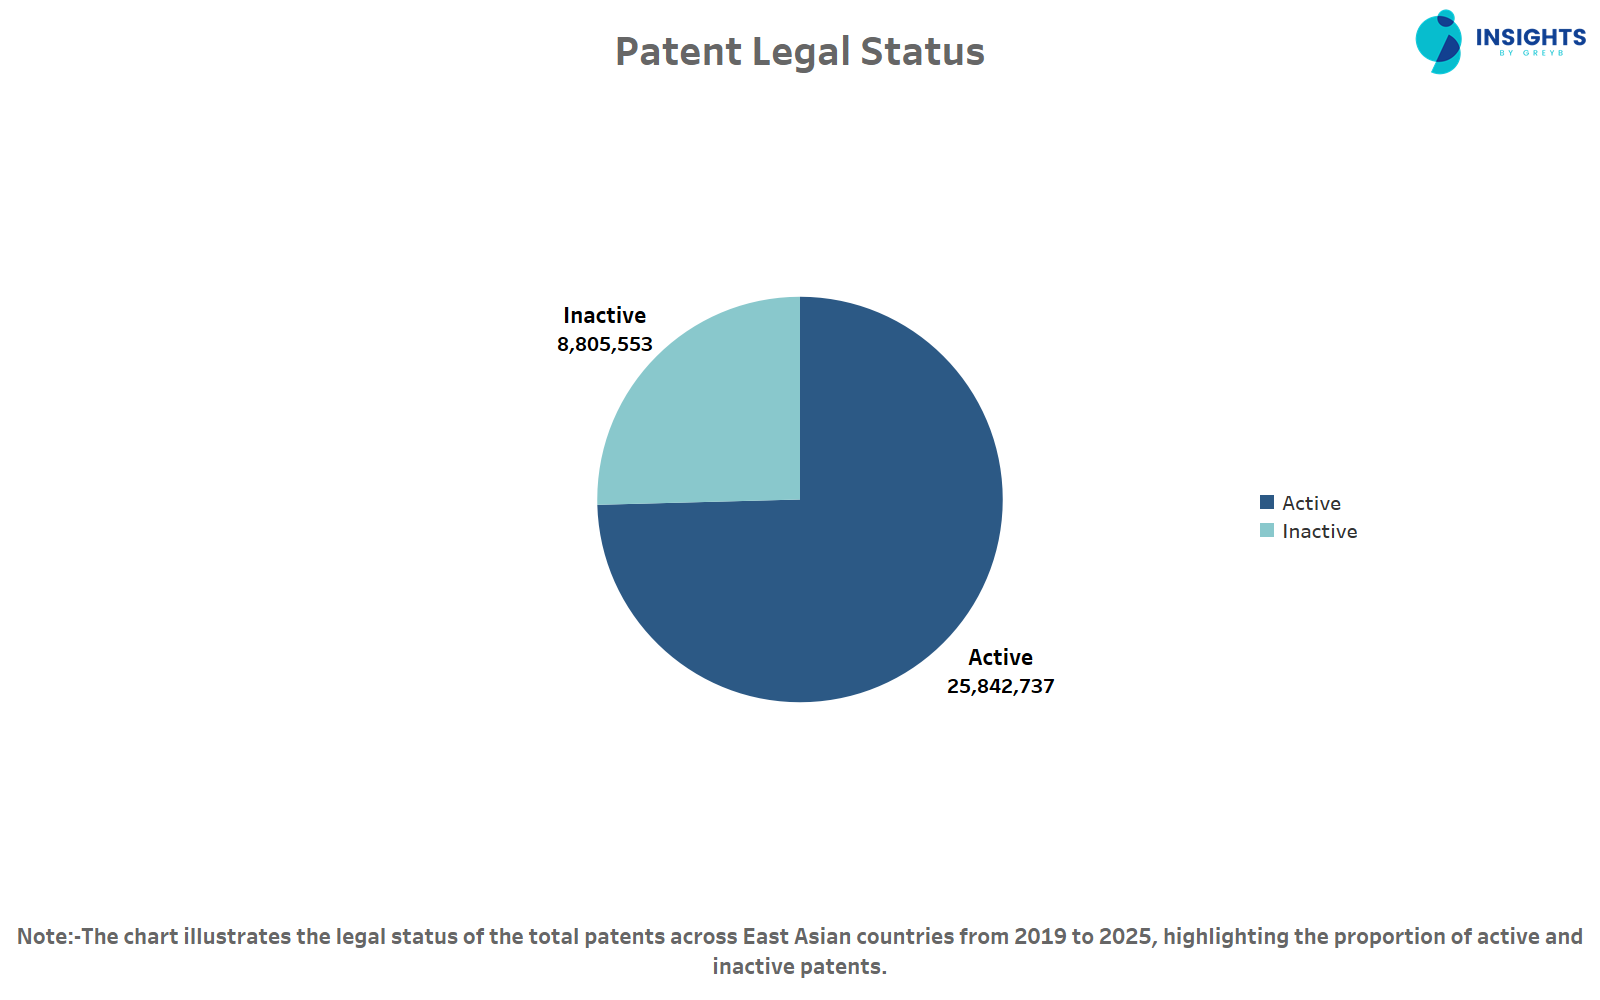
Approximately 65% of patents remain active, reflecting sustained innovation protection and market competitiveness, while the 35% inactive patents highlight strategic abandonments and expirations in IP management.
The legal status of patents offers a snapshot of how innovation is being sustained or phased out, examining the shifts in patent activity over time reveals the underlying momentum highlighting which East Asian countries are accelerating their innovation output and how their focus is evolving across sectors.
Where Are East Asia’s Leading R&D Centers Located?
This chart highlights the top research centers playing key role in innovation in East Asia innovation, based on unique patent families from 2019 to 2025.
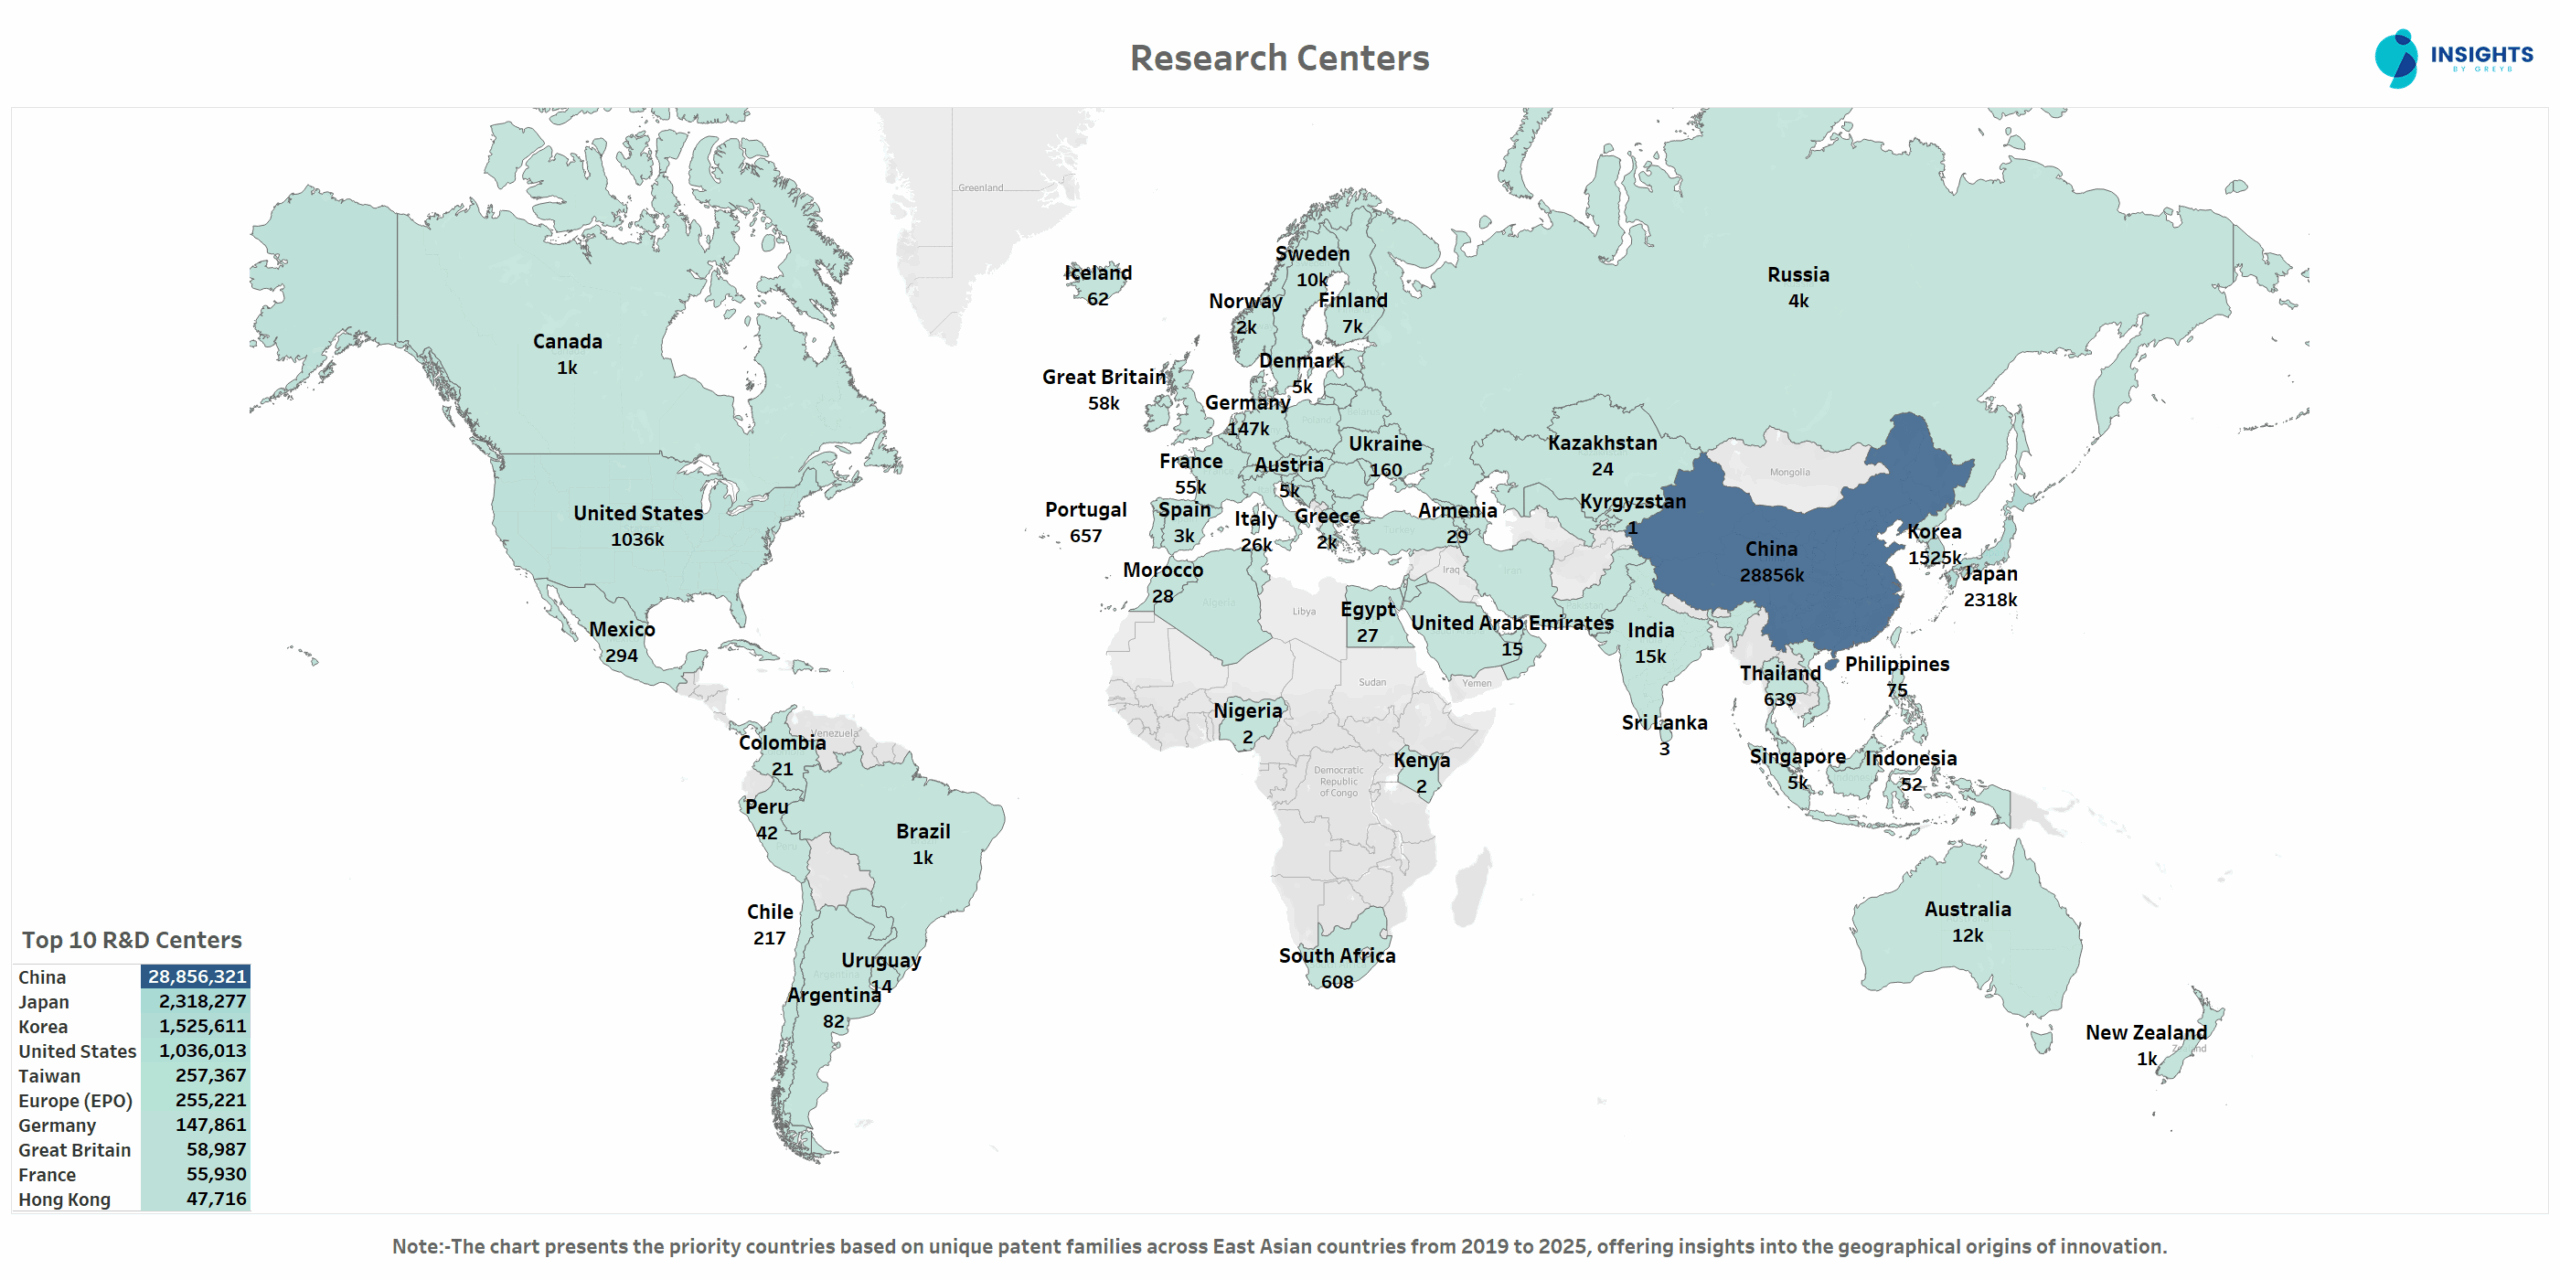
With 20.8M filings, China alone accounts for over 75% of the top 5 global R&D centers' patents combined, indicating China’s rapid transformation into the world’s leading innovation powerhouse.
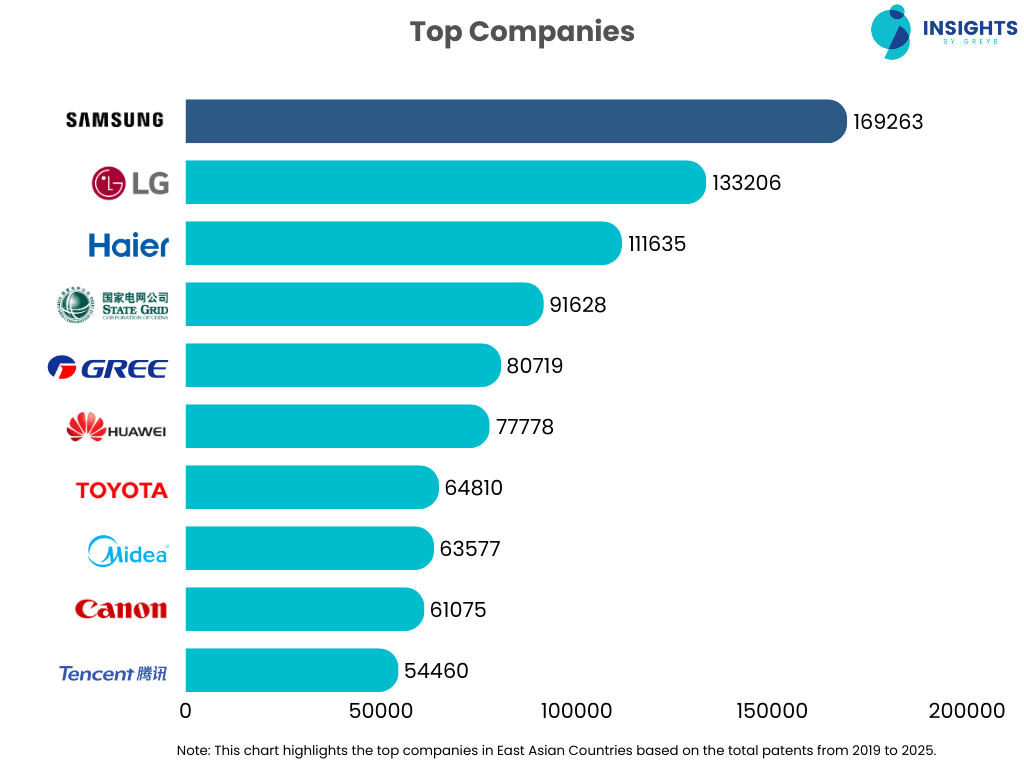
Which are the Top Companies in East Asia Patent Landscape?
This chart highlights the top companies in East Asia with the largest patent portfolios from 2019 to 2025, showcasing key industry leaders in innovation.
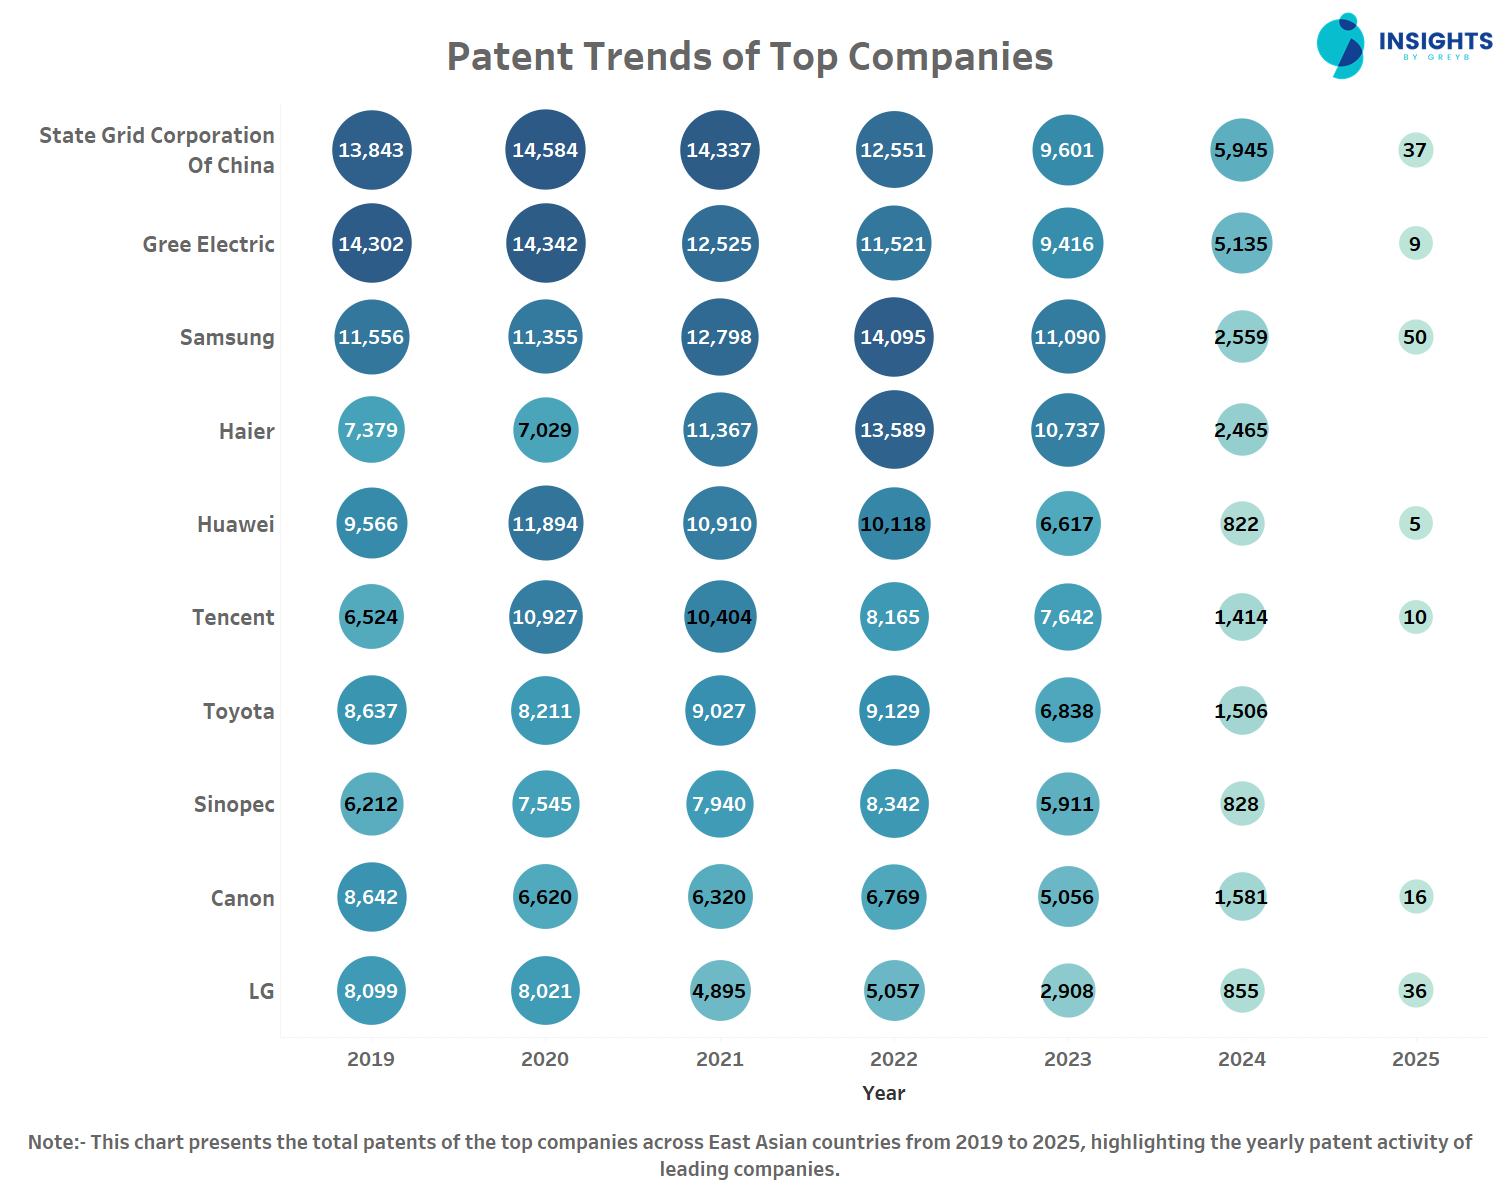
How Have Patent Filings Evolved Among the Leading Companies Over Time?
This chart presents the yearly patent activity of top companies in East Asia from 2019 to 2025, showcasing fluctuations in innovation investments.
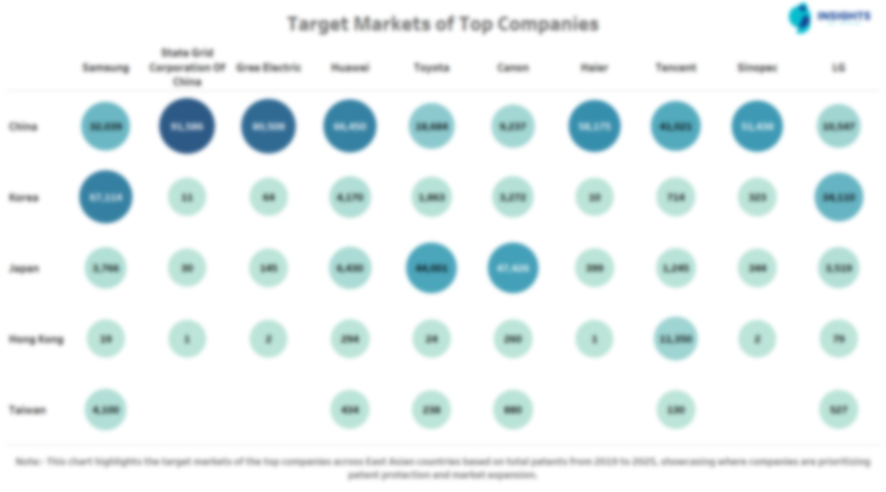
Where Are The Target Markets of Top Companies in East Asian Countries?
Unlock Exclusive Insights!
Get the full report detailing East Asian innovation trends and strategies. Fill out the form to access in-depth analysis and key takeaways.
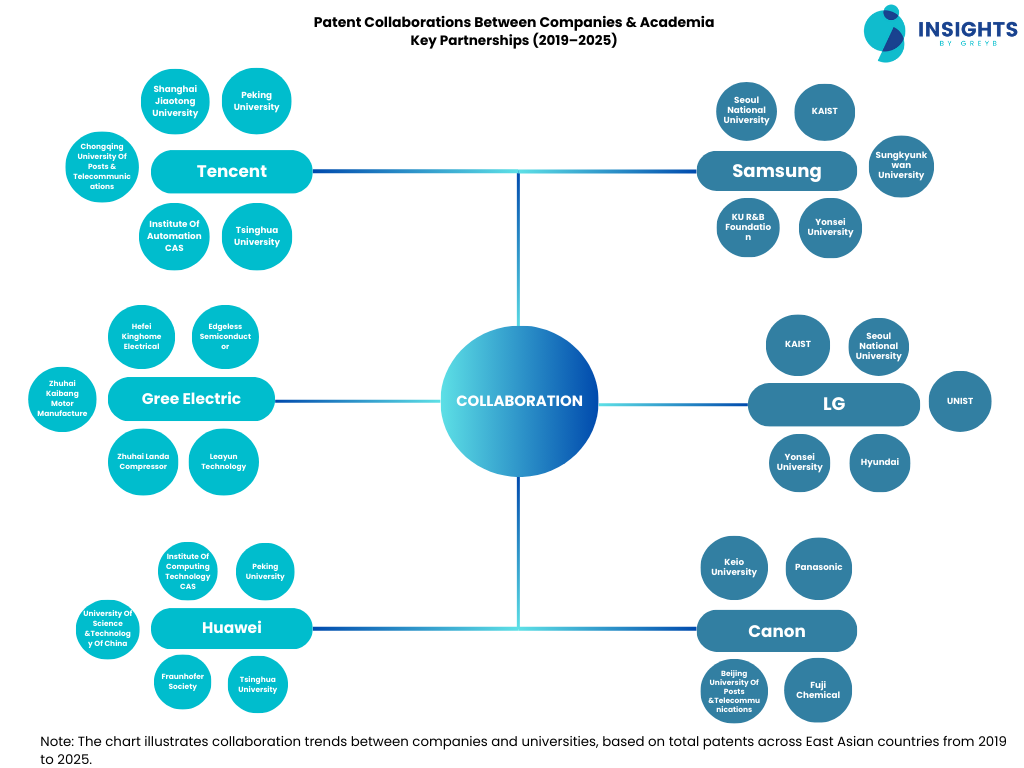
Which Companies and Universities Are Driving Patent Partnerships across East Asia?
This chart maps patent collaboration networks between companies and academic institutions from 2019 to 2025, highlighting key research partnerships that drive innovation in East Asia.
Which Key Technology Dominates Innovation in East Asia?
This chart highlights the top CPC (Cooperative Patent Classification) categories based on total patents between 2019 and 2025. It provides insights into which technology domains are driving East Asian innovation and where R&D efforts are concentrated in East Asia.
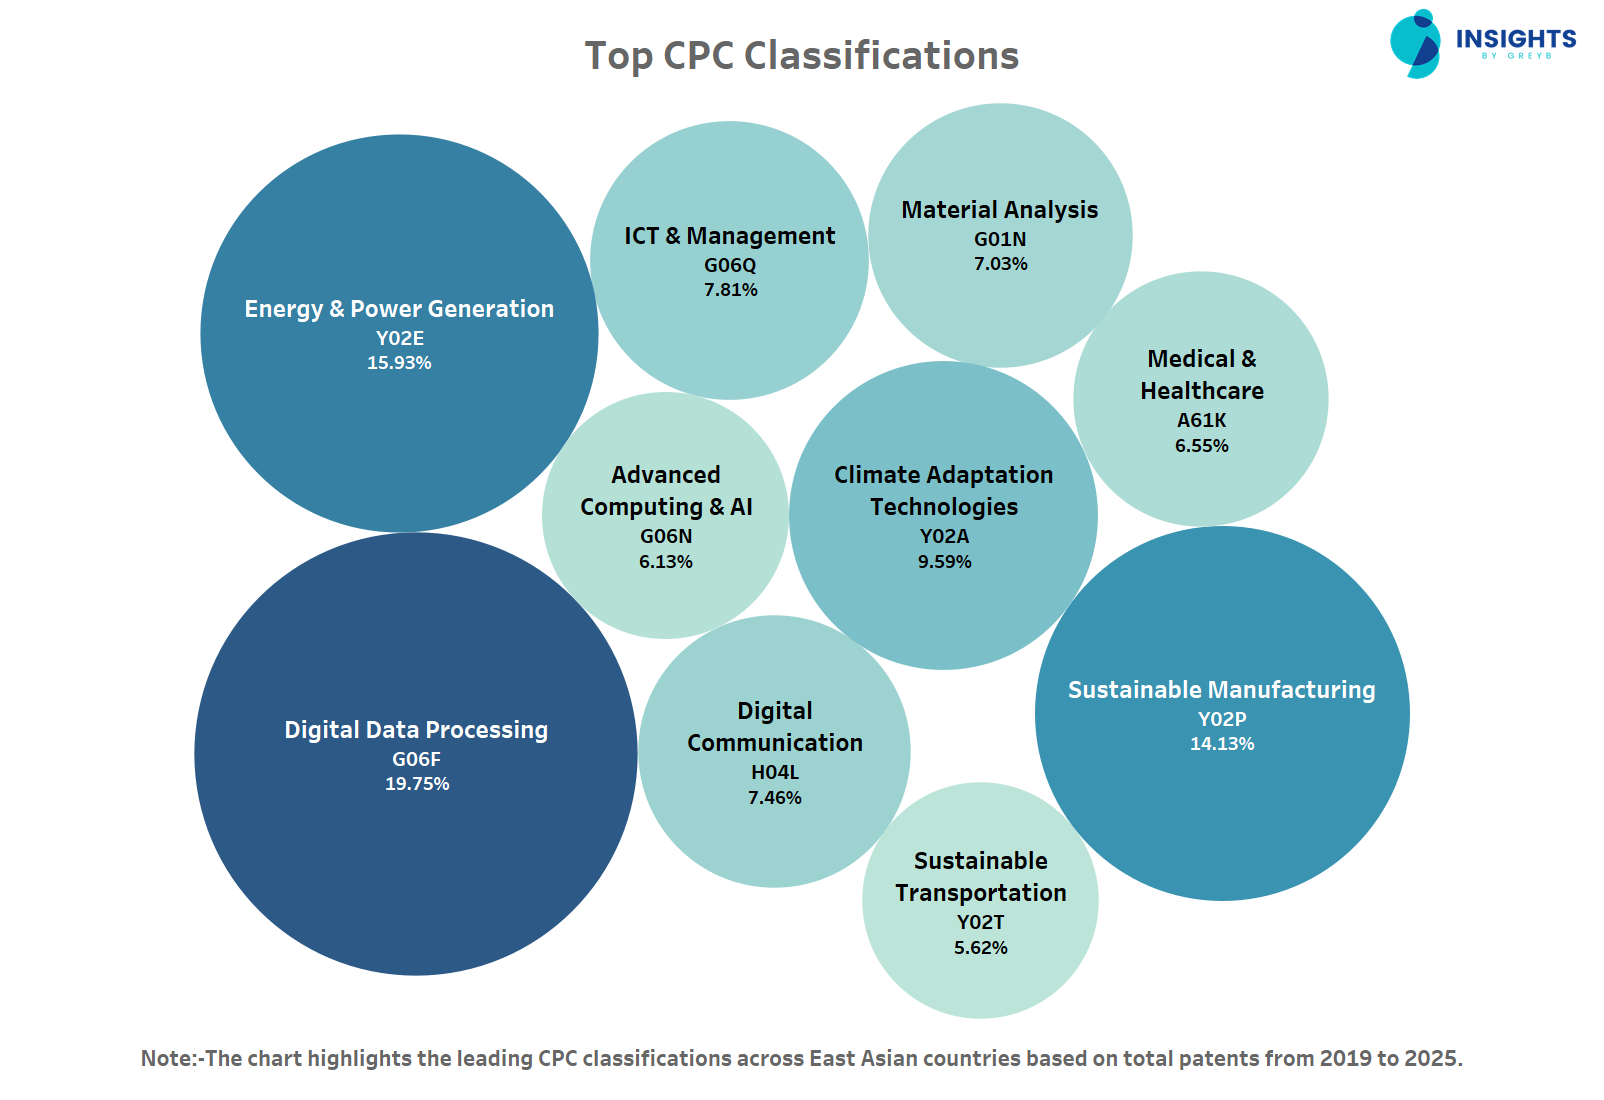
Nearly half of the patents focus on sustainability and digital transformation (G06F, Y02E and Y02P) reflecting a global R&D shift toward automation, climate resilience and energy efficiency. This trend aligns with corporate sustainability mandates and next-gen infrastructure investments.
Take your research to the next level with Slate R&D—your ultimate tool for in-depth patent analysis, competitive intelligence, and real-time innovation insights to stay ahead in your tech domain.
As industries converge around Energy & Power Generation, Digital Data Processing, and advanced Computing & AI, staying ahead of what’s next is critical. With Slate, you can dive deeper into emerging trends, monitor competitors, and uncover breakthrough technologies in real time.
Fill out the form below to gain full access.
Which Countries Lead in Key Technology Patents in East Asia?
This chart illustrates the country-wise distribution of CPC classifications, showcasing which East Asian nations dominate specific technology areas based on total patents filed from 2019 to 2025.
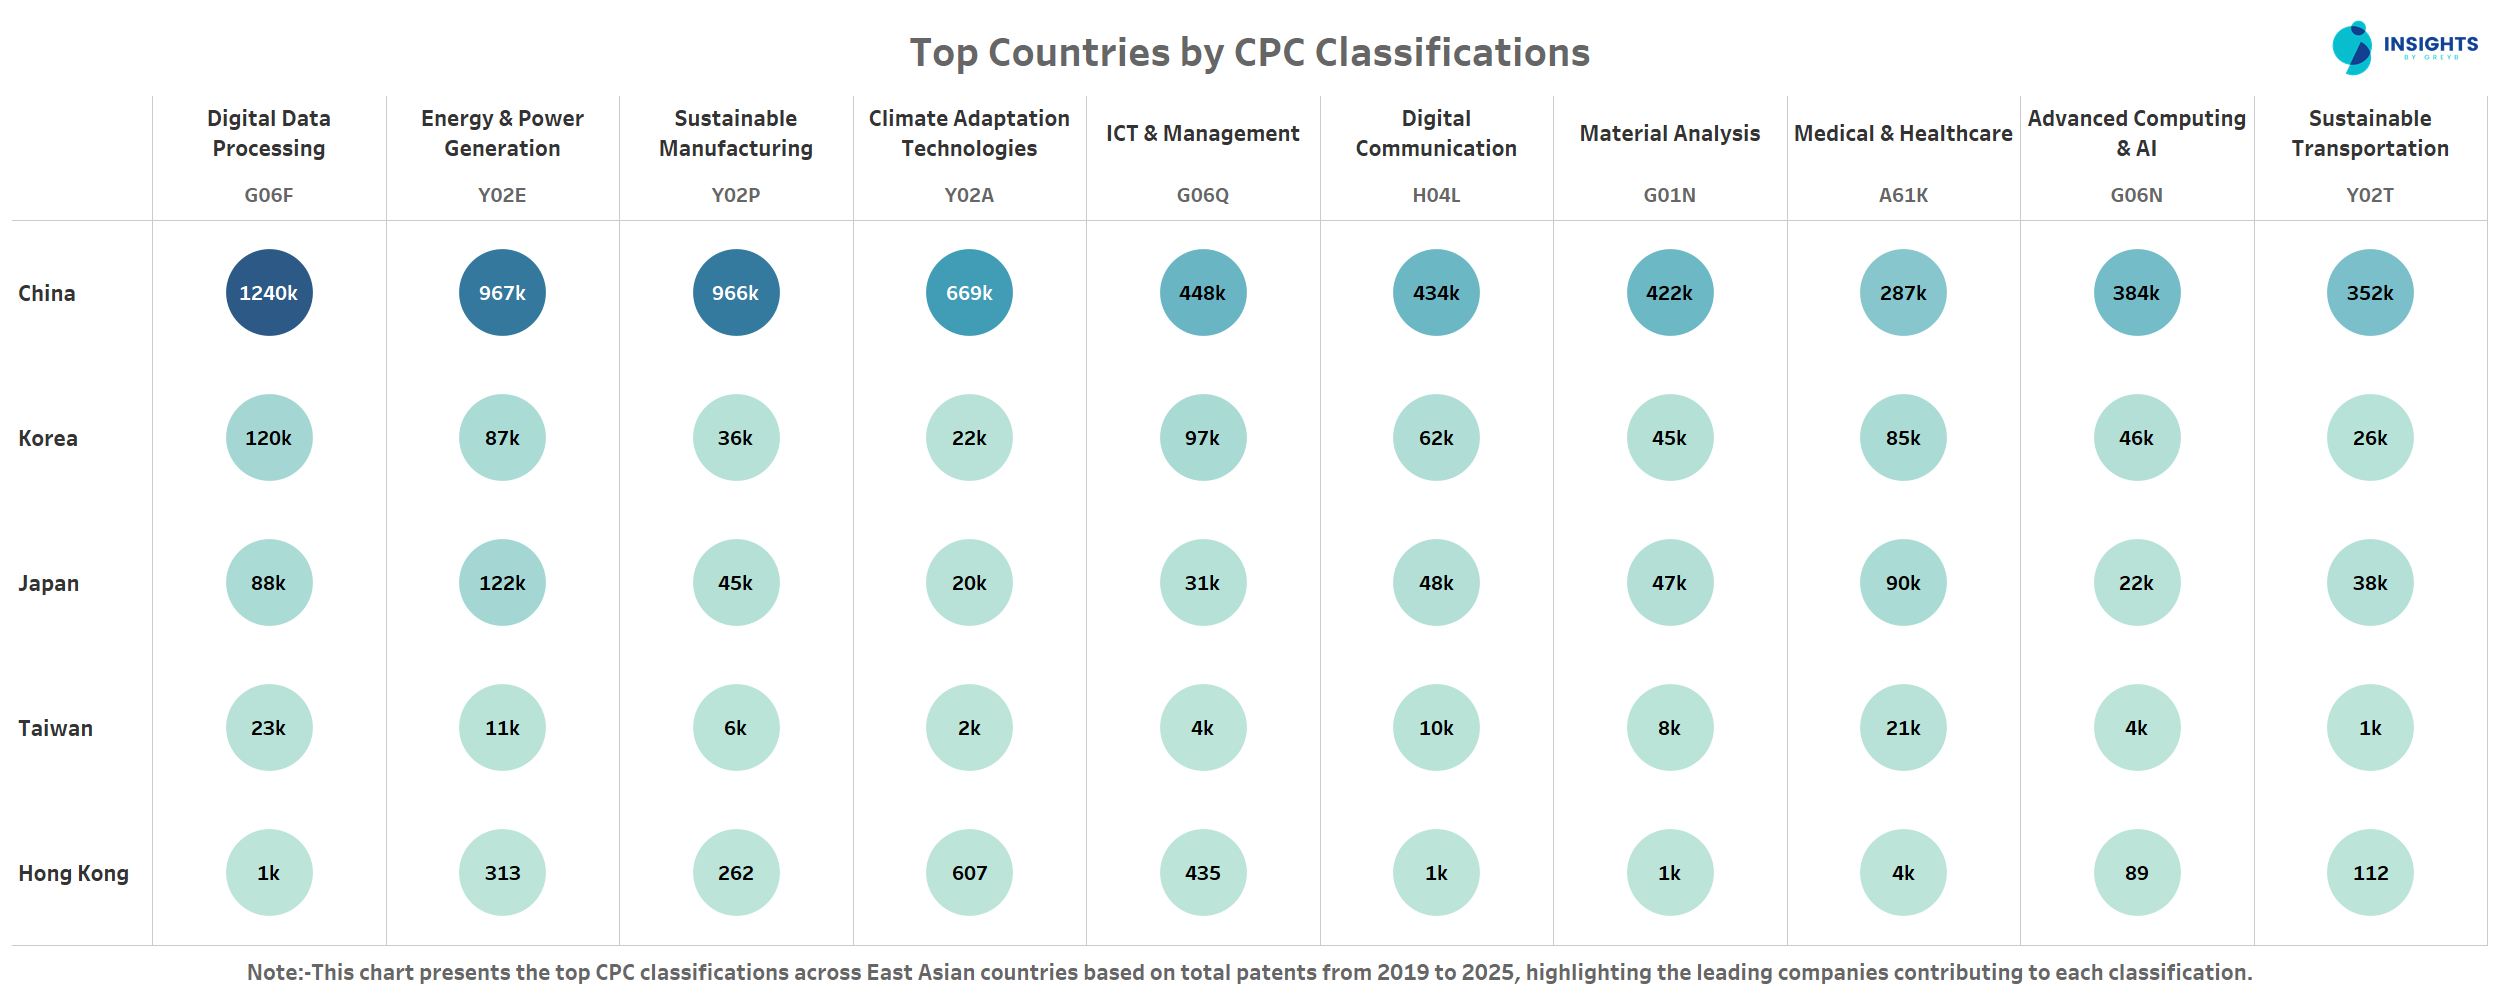
China’s Digital Data Processing (G06F) patents alone is nearly 5 times the combined total of Japan, Korea, Taiwan and Hong Kong. This highlights China's AI-first strategy in shaping the future of automation, computing, and smart systems.
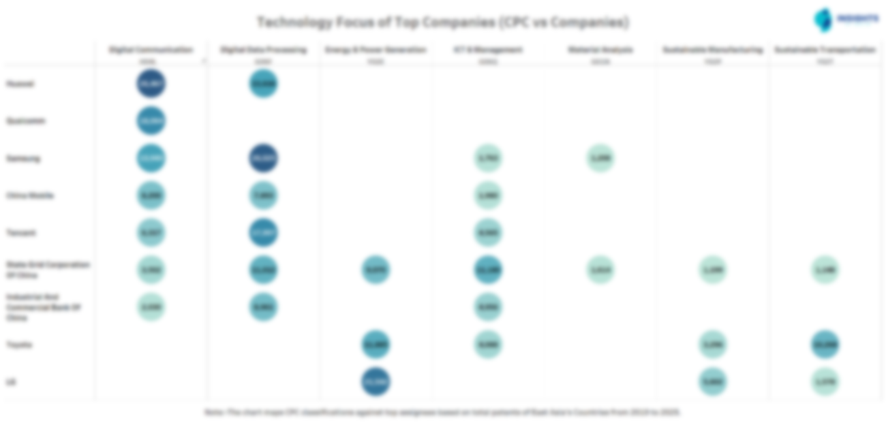
Which Companies Dominate Innovation in Key Technologies?
Get the Full Report on East Asian Innovation!
Gain deeper insights into the countries and companies driving the future of technology in East Asia. Fill out the form to unlock the full report, featuring comprehensive data on AI, patents, and industry leaders.
Access The Full Report Now!
How Have Annual Licensing Deals in East Asia Evolved Over the Years?
This chart presents the number of licensing deals per year from 2019 to 2025 in East Asia. It highlights the trends in how patented innovations are being licensed, showcasing fluctuations in licensing activity over the years.
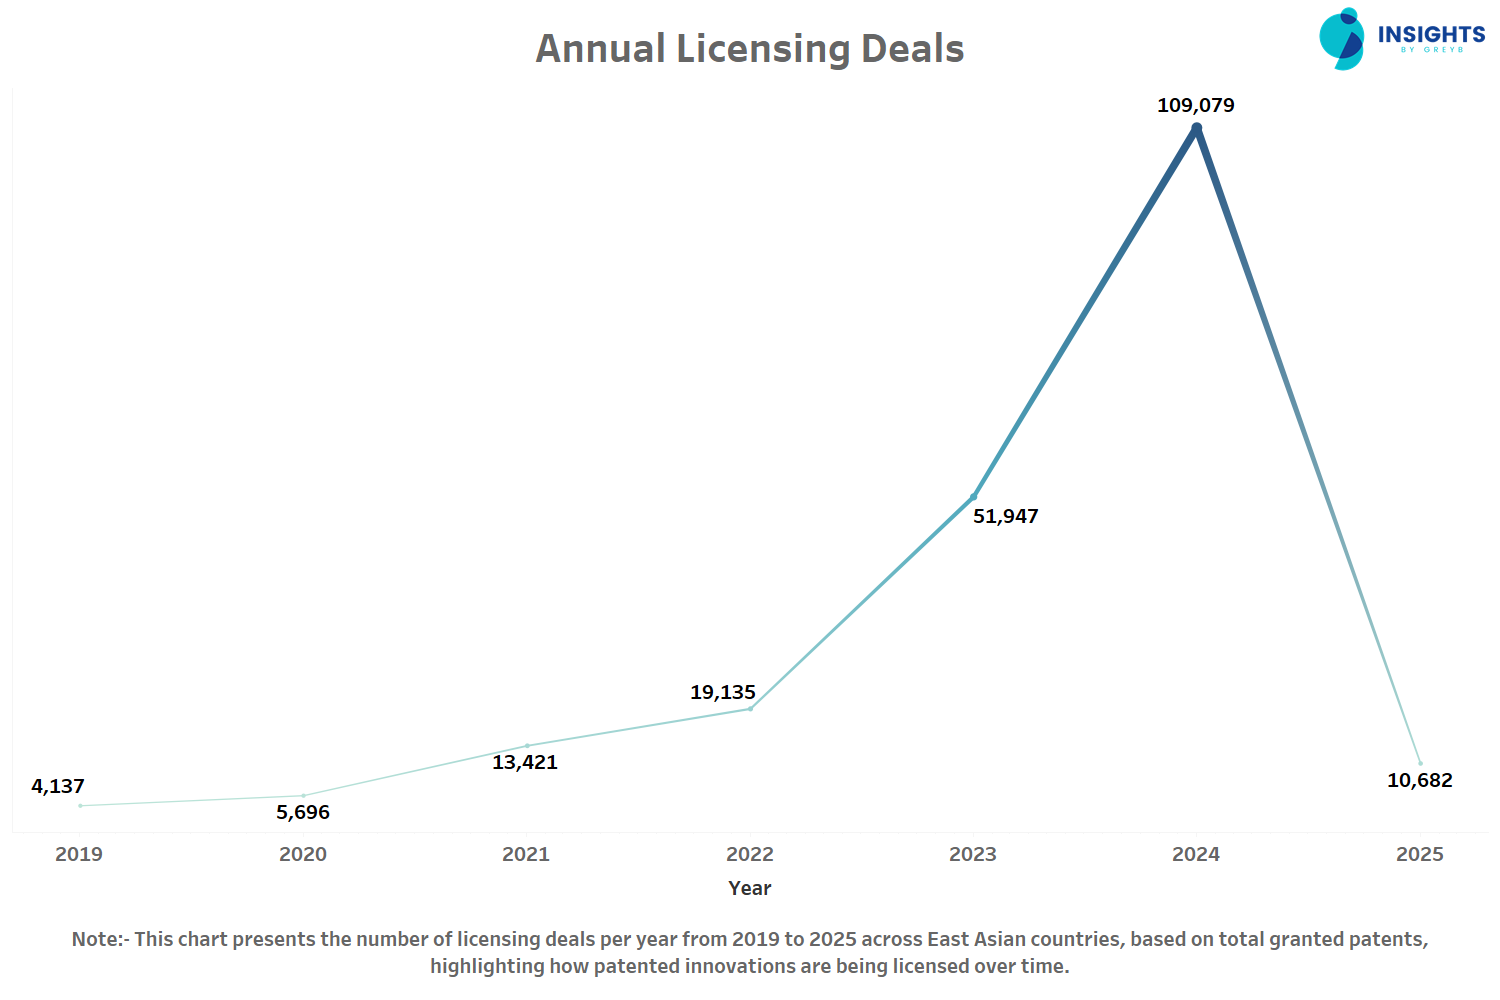
The surge in licensing deals across East Asia, particularly in 2024, can be largely attributed to China's swift patent examination process, with an average review time of just 15.5 months in 2024. This boost, alongside a 22.2% year-on-year increase in the first half of 2024 in patent licensing activities by academic institutions, highlights China’s thriving innovation ecosystem and its push to turn research into commercial success.
How Has Patent Litigation Changed Over the Years in East Asia?
This chart presents the number of patent litigation cases in East Asia from 2019 to 2025, highlighting trends in patent enforcement and legal disputes.
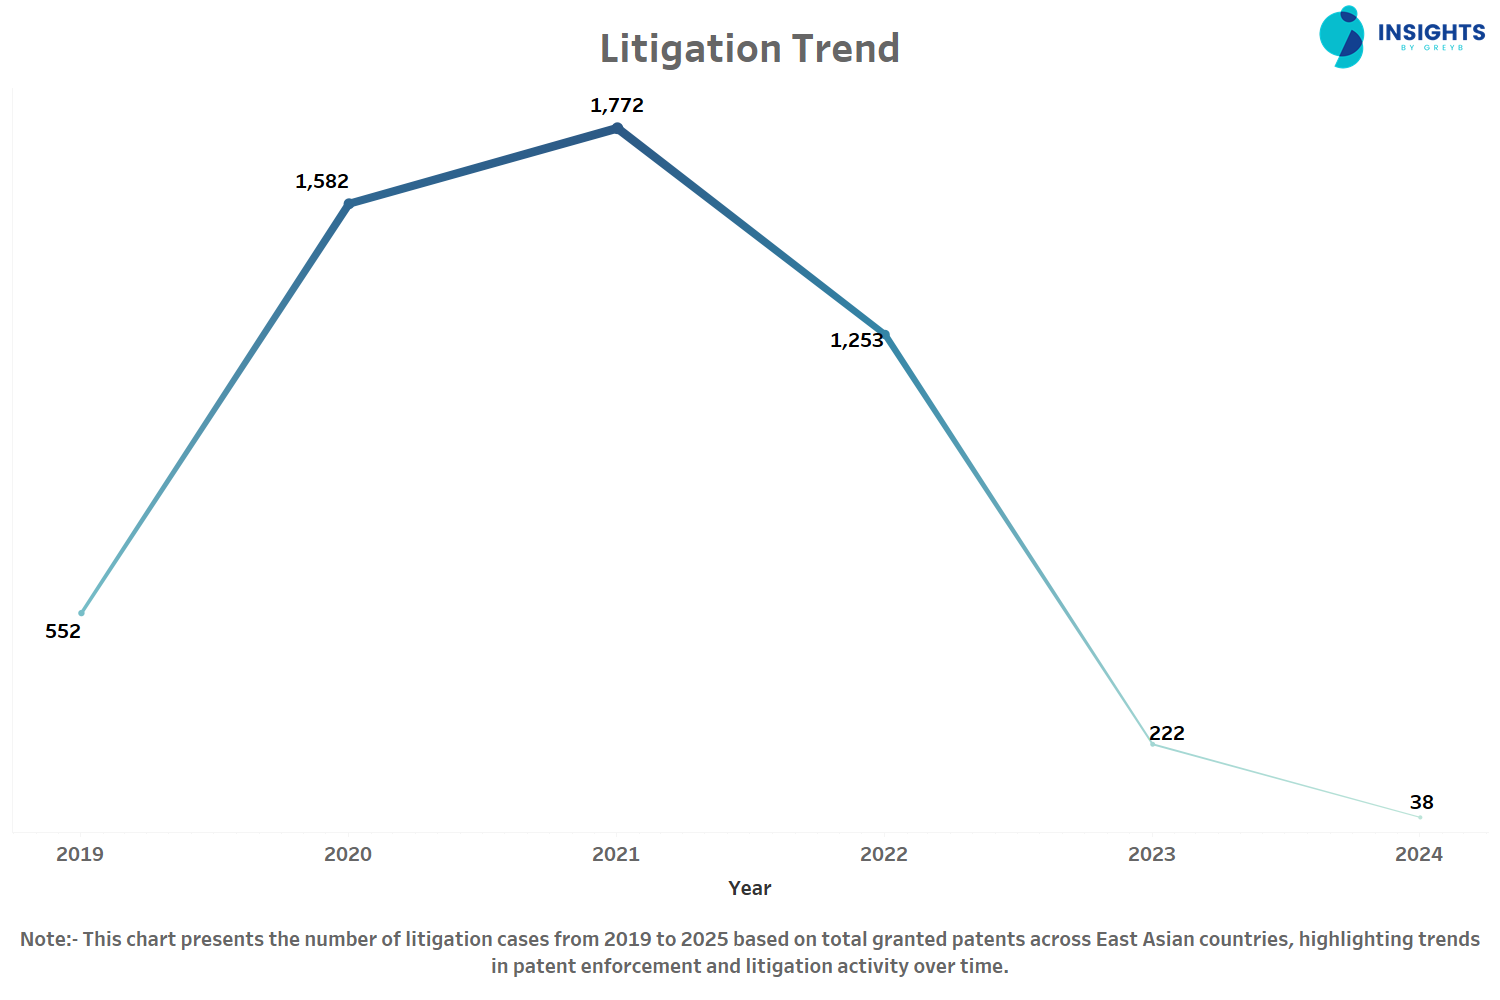
From 2019 to 2021, patent litigation cases tripled, but by 2025, they completely vanished. This suggests a shift in IP strategies, with companies possibly favoring settlements, licensing deals or alternative dispute resolutions over costly litigation.
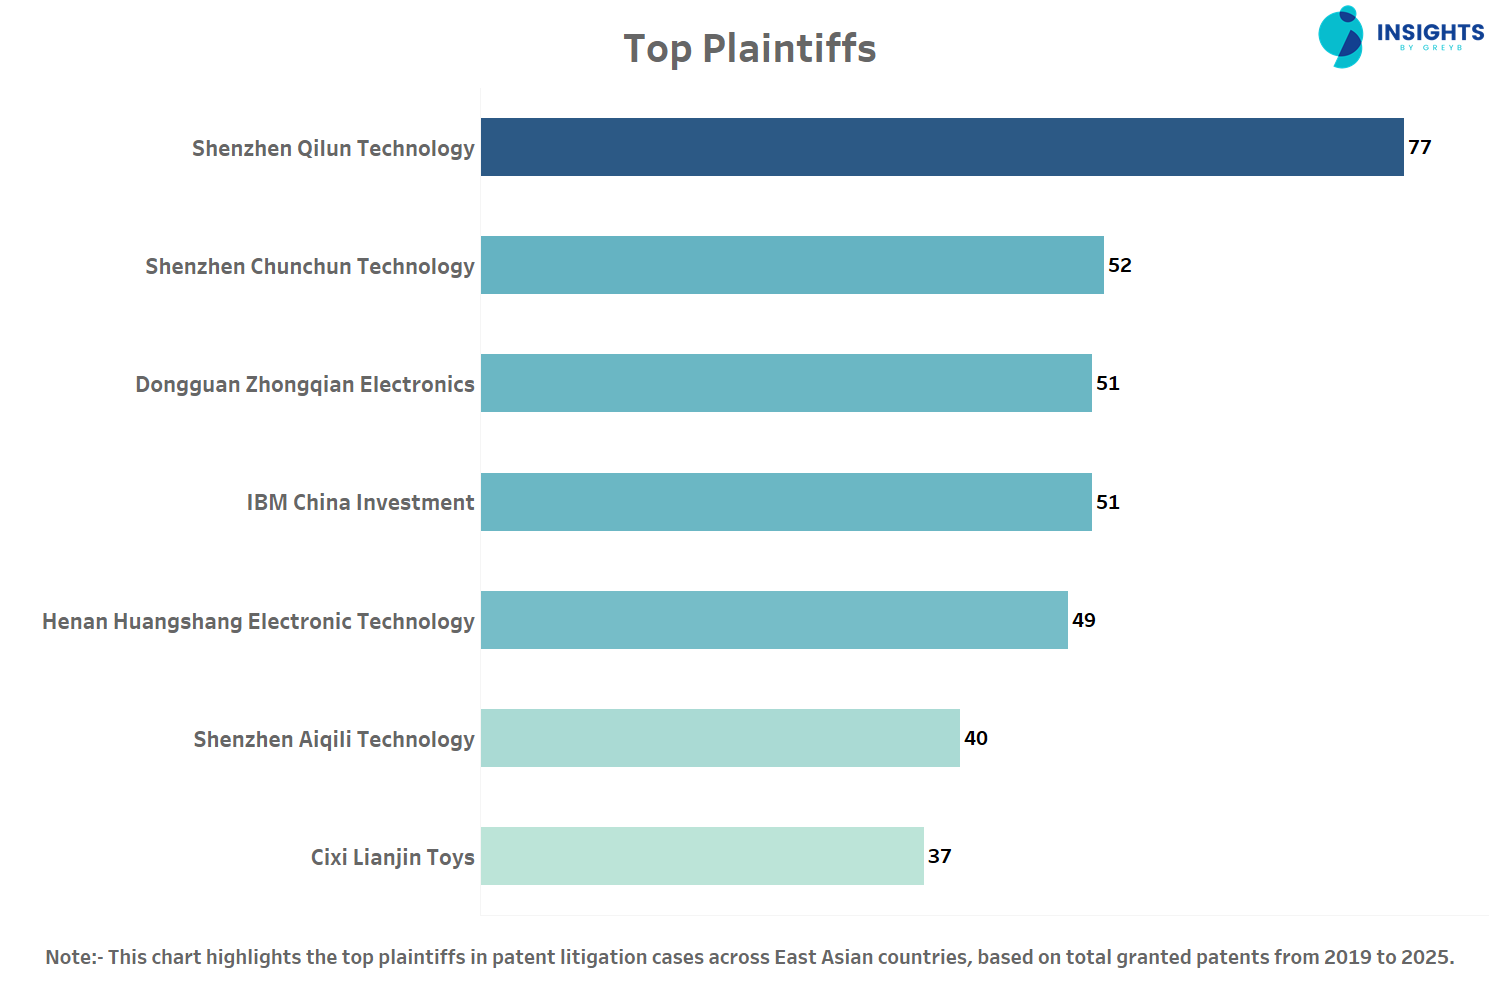
Which Plaintiffs Are Most Active in Patent Litigation in East Asia?
This chart highlights the top plaintiffs in patent litigation cases in East Asia from 2019 to 2025. It showcases companies that have actively enforced their patents, either to protect innovations or engage in strategic lawsuits.
What Patent Trends Reveal?
East Asia has cemented its position as the global epicenter of technological advancement, with China, Japan, South Korea, Taiwan and Hong Kong driving much of the world’s patent activity. Over the past few years, these nations have collectively reshaped industries, from AI and digital communication to clean energy and sustainability. The sheer scale and intensity of their innovation efforts have redefined the global patent landscape, positioning them as pivotal players in the race toward the future.
At the heart of this transformation is China, whose unparalleled volume of patent filings across key sectors especially AI demonstrates the country’s relentless ambition to lead in next-gen technologies. This dominance is only set to grow, with smart systems, automation and green technologies poised to fuel the next wave of innovation.
As East Asia continues to evolve, the shift from litigation-heavy strategies to licensing deals and collaborations will accelerate. This evolution, fueled by efficient patent processes and cross-border partnerships, will create fertile ground for commercialization and rapid scaling of transformative innovations. The region’s growing focus on sustainability will further strengthen its leadership in the global clean tech revolution, making green technologies and energy-efficient solutions key drivers of future growth.
Looking ahead, East Asia will not only continue to dominate in high-tech sectors like 5G and AI but will also be a critical force in shaping the global sustainability agenda. For innovators, investors and industry leaders, understanding and engaging with this rapidly evolving landscape will be essential to staying ahead in the global innovation race.
What you’ve read here is just a fraction of the story. The Global Patent and Innovation Leadership Report pulls together insights from 55 million+ patents across 150+ countries, giving you the clearest view yet of how innovation is shifting across the globe.
Split into two parts, one focused on countries outside East Asia, and the other dedicated to East Asia’s powerhouse nations, the report reveals patterns you won’t want to miss:
- Which 100 companies are setting the pace of innovation, and how their patent count have changed since 2019.
- Why 2024 marked a turning point in global litigation, with NPEs leading the charge.
- How company–university collaborations triggered breakthroughs like Samsung and Seoul National University’s graphene-ball battery.
- The patents with the highest global impact, cited thousands of times across sectors.
- Insights into how companies secure patents in their strongest markets first — Apple, Qualcomm, and Bosch reinforcing home advantage before expanding abroad.
- …and much more that simply can’t fit into a single article.